


Abstract
Combined treatment of advanced head and neck squamous cell carcinomas (HNSCC) with radiotherapy and the epidermal growth factor receptor (EGFR) inhibitor cetuximab improves clinical outcome in comparison to radiotherapy alone but is effective only in a few cases. To select those patients most likely to benefit from EGFR inhibition, it can be advantageous to quantify the tumor EGFR status before and possibly during therapy. The aim of this study was to develop and characterize the 111In-cetuximab-F(ab′)2 tracer to image EGFR targeting in vivo. Methods: The affinity and internalization kinetics of 111In-cetuximab-F(ab′)2 were determined in vitro. The optimal protein-fragment dose for imaging was determined in nude mice with a subcutaneous head and neck carcinoma model (FaDu). Mice with FaDu tumors were imaged using ultra-high-resolution SPECT with 111In-cetuximab-F(ab′)2 or 111In-cetuximab IgG at 4, 24, 48, and 168 h after injection. Tumor tracer uptake was determined on micro-SPECT and autoradiography images of tumor sections. Immunohistochemical staining was used to analyze EGFR expression in the tumor. Results: In vitro, more than 50% of 111In-cetuximab-F(ab′)2 was internalized into FaDu cells within 24 h. The half maximal inhibitory concentration (IC50) of 111In-cetuximab-F(ab′)2 and 111In-cetuximab was similar: 0.42 ± 0.16 nM versus 0.28 ± 0.14 nM, respectively. The protein dose–escalation study showed that the highest uptake of 111In-cetuximab-F(ab′)2 in tumors was obtained at doses of 10 μg/mouse or less (13.5 ± 5.2 percentage injected dose per gram [%ID/g]). Tumor uptake of 111In-cetuximab was significantly higher (26.9 ± 3.3 %ID/g, P < 0.01). However, because of rapid blood clearance, tumor-to-blood ratios at 24 h after injection were significantly higher for 111In-cetuximab-F(ab′)2 (31.4 ± 3.8 vs. 1.7 ± 0.2, respectively; P < 0.001). The intratumoral distribution of 111In-cetuximab-F(ab′)2 correlated well with the immunohistochemical distribution of EGFR (r = 0.64 ± 0.06, P < 0.0001). micro-SPECT images of 111In-cetuximab-F(ab′)2 clearly showed preferential uptake in the tumor from 4 h onward, with superior tumor-to-background contrast at 24 h, compared with 111In-cetuximab (107.0 ± 17.0 vs. 69.7 ± 3.9, respectively; P < 0.05). Conclusion: 111In-cetuximab-F(ab′)2 displays higher tumor-to-blood ratios early after injection than 111In-cetuximab in an HNSCC model, making it more suitable for EGFR visualization and potentially for selecting patients for treatment with EGFR inhibitors.
The epidermal growth factor receptor (EGFR) pathway is involved in the regulation of cellular differentiation, cell cycle control, proliferation, and survival (1). EGFR is frequently overexpressed in tumors, including in 80%–100% of head and neck squamous cell carcinomas (HNSCC) (2). Increased expression correlates with poor prognosis, though its predictive value has not yet been shown (3–5). EGFR overexpression is a significant factor for therapy, in part because the EGFR pathway plays an important role in radiation resistance. The effectiveness of radiotherapy is dependent on several mechanisms including tumor oxygenation status, DNA repair processes, and proliferation, which are all influenced by EGFR activation (6,7). EGFR signaling can be counteracted by blocking of the extracellular receptor-ligand interaction with monoclonal antibodies or by inhibition of intracellular signal transduction cascades by blocking the tyrosine kinase domains. Several tyrosine kinase inhibitors such as erlotinib, gefitinib, and lapatinib have been developed, but only modest response rates were noted in phase II trials with HNSCC patients (8). Greater treatment progress has been achieved with monoclonal antibodies such as panitumumab, zalutumumab, nimotuzumab, and especially cetuximab (9). Preclinical studies showed that cetuximab (Erbitux, C225; Merck), by binding with the EGFR domain, prevented receptor activation, resulting in improved tumor responses (10). A randomized clinical study performed by Bonner et al. proved the effectiveness of cetuximab in a subset of HNSCC patients (11). However, not all patients benefit from the addition of cetuximab to radiotherapy, and preselection of patients prone to respond to EGFR blockage will provide a valuable asset for individualized treatment schemes. In several studies, EGFR copy number, but not EGFR expression as assessed by immunohistochemistry, was found to be predictive for response to EGFR inhibition (12,13). There are several limitations of immunohistochemical assessment of receptor expression such as sampling errors and the necessity of invasive procedures. EGFR quantification by means of imaging allows noninvasive monitoring of EGFR expression before, during, and after treatment, and expression of the target in the whole tumor can be determined, eliminating artifacts caused by sampling errors. In addition, imaging with a radiolabeled tracer specifically determines expression of accessible receptors (i.e., receptors that can be reached by systemically administered therapeutics).
Previously, we have labeled cetuximab with 111In and imaged the antibody uptake with SPECT in nude mice bearing FaDu squamous cell carcinoma xenografts (14). The FaDu tumors were clearly visualized. However, tumor accumulation and blood clearance rates were low and resulted in delayed imaging at 3–7 d after injection, which makes whole-antibody imaging less suitable for introduction into clinical practice.
Antibody F(ab′)2 fragments of cetuximab IgG have a lower molecular weight and therefore display faster blood-/tissue-clearance kinetics and enable earlier high-contrast molecular imaging (15). In this study, we aimed to characterize and optimize cetuximab-F(ab′)2 as an EGFR-targeting imaging agent in HNSCC. For this purpose, cetuximab-F(ab′)2 was labeled with 111In. Affinity and internalization kinetics were determined in vitro, and EGFR imaging was performed in nude mice with subcutaneous FaDu tumors using micro-SPECT (16). Ex vivo, EGFR expression was correlated to tracer uptake as determined by autoradiography of the tumors.
MATERIALS AND METHODS
Radiolabeling and Quality Control
Cetuximab-F(ab′)2 fragments (≈100 kDa) were produced from the whole IgG monoclonal antibody cetuximab (≈150 kDa) by pepsin digestion. For this, 5 mg of cetuximab were digested with 0.125 mg of pepsin (Boehringer) in 0.1 M citrate buffer, pH 3.8. After 4 h at 37°C, digestion was stopped by the addition of 0.25 mL of 1.0 M Tris, pH 10. The F(ab′)2 fragments were concentrated by ultrafiltration using a Centricon YM-10 (Millipore). The concentrated F(ab′)2 fragments were buffer-changed to NH4OAc (0.25 M pH 5.5) by dialysis, using a Slide A Lyzer 10-kDa (Pierce) and stored at 4°C. Standard sodium dodecyl sulfate–polyacrylamide gel (10%) electrophoresis was performed for 90 min at 150 V in Tris/glycine buffer. Protein on the gel was stained with Coomassie brilliant blue (0.1%). Results showed no detectable residual IgG or presence of Fab′ fragments.
Cetuximab and cetuximab-F(ab′)2 were conjugated to isothiocyanatobenzyl-diethylenetriaminepentaacetic acid (ITC-DTPA; Macrocyclics) in 0.1 M NaHCO3, pH 9.5, for 1 h at room temperature using a 50-fold molar excess of ITC-DTPA (14,15). Unbound ITC-DTPA was removed by dialysis against NH4OAc (0.25 M, pH 5.5). The antibody (fragment) was labeled with 111In (Covidien) after a 3-fold volume of 2-(N-morpholino)ethanesulfonic acid buffer, pH 5.5, was added. After 20 min, ethylenediaminetetraacetic acid was added to a final concentration of 5 μM to complex nonincorporated 111In. Labeling efficiency was determined using instant thin-layer chromatography on TEC Control chromatography strips (Biodex), with 0.1 M citrate buffer, pH 6.0, as the mobile phase. If labeling efficiency was below 95%, the 111In-labeled antibody or F(ab′)2 fragment was purified on a PD-10 column (Amersham Biosciences) that was eluted with phosphate-buffered saline (PBS) containing 0.5% bovine serum albumin. The radiochemical purity of 111In-cetuximab and 111In-cetuximab-F(ab′)2 exceeded 95% in all experiments.
Half Maximal Inhibitory Concentration (IC50) and Internalization
FaDu cells (a gift by the research section of the department of radiation oncology in Dresden (17) and maintained as a stable xenograft line at our department) were cultured and maintained as monolayer in RPMI medium (GIBCO; BRL Life Sciences Technologies) supplemented with 10% fetal calf serum at 37°C in a humidified atmosphere with 5% CO2.
The relative affinity of cetuximab and cetuximab-F(ab′)2 (IC50) was determined in FaDu cells. Cells were cultured in vitro to confluency in 6-well plates and were incubated with increasing concentrations of either unlabeled cetuximab or cetuximab-F(ab′)2 (300–0.001 nM, in triplicate) in binding buffer (RPMI, containing 0.5% bovine serum albumin) simultaneously with 111In-labeled cetuximab (1,000 Bq/mL; specific activity, 0.37 MBq/μg). Plates were incubated for 2 h at 4°C. After incubation, cells were washed twice with binding buffer and harvested using cotton plugs. The cell-associated activity was measured in a γ-counter (Perkin-Elmer).
The internalization kinetics of 111In-cetuximab-F(ab′)2 were determined in vitro in FaDu cells. Cells were cultured to confluency in 6-well plates and incubated with 111In-cetuximab-F(ab′)2 (1,000 Bq/mL; specific activity, 1.85 MBq/μg) for 1, 2, 4, or 24 h in 2 mL of binding buffer at 37°C in a humidified atmosphere with 5% CO2. After incubation, cells were washed with PBS and incubated for 10 min with acid buffer (0.1 M acetic acid, 154 nM NaCl, pH 2.6) at 0°C to remove and subsequently determine the membrane-bound fraction of the cell-associated 111In-cetuximab-F(ab′)2. Next, cells were harvested from the 6-well plates using cotton plugs, and internalized activity was measured in a γ-counter. Nonspecifically bound activity was determined by coincubation with unlabeled cetuximab (5 μg/mL) and processing of the wells as described above.
Tumor Model
Seventy-two 6- to 8-wk-old athymic BALB/c nu/nu mice were injected subcutaneously in the right flank with 5 × 10⁶ FaDu cells in 200 μL of RPMI medium. Mice with tumors with a mean diameter of 8 mm (range, 6–9 mm) were used in the experiments, 2–3 wk after inoculation. Animals were housed in filter-topped cages in a specific pathogen-free unit in accordance with institutional guidelines. The Animal Welfare Committee of the Radboud University Nijmegen Medical Centre approved the animal experiments.
Protein Dose Escalation and Biodistribution
The optimal dose of cetuximab-F(ab′)2 for imaging of EGFR expression was determined in an antibody dose–escalation study. Six groups of 6 mice with subcutaneous FaDu tumors were injected intravenously with 111In-cetuximab-F(ab′)2 at increasing protein doses of 1, 5, 10, 50, 100, and 500 μg of cetuximab-F(ab′)2 (2.4 ± 0.1 MBq). Mice were euthanized by cervical dislocation 24 h after injection of the tracer.
To determine optimal time-point measurement, the biodistribution of 111In-cetuximab-F(ab′)2 (5 μg, 0.17 MBq) and 111In-cetuximab (10 μg, 0.13 MBq (14)) was evaluated in groups of 6 mice per time point at 4, 24, and 48 h after injection with an additional time point for 111In-cetuximab at 168 h after injection as deemed optimal by Hoeben et al. (14). Control groups (n = 6) received a blocking dose (1,000 μg of cetuximab) before tracer injection.
From all mice, tumors and tissue samples (blood, skin, muscle, pancreas, small intestine, large intestine, lung, heart, kidney, and liver) were harvested and weighed. Subsequently, radioactivity uptake was determined in a γ-counter. Activity concentrations in the tissues were calculated as percentage of the injected dose per gram of tissue (%ID/g). To correct for radioactive decay, injection standards were counted simultaneously.
Micro-SPECT Imaging
Six mice were injected with 5 μg of 111In-cetuximab-F(ab′)2 (18 ± 2.1 MBq). A control mouse was coinjected with a 1,000-μg excess of unlabeled cetuximab 3 d before injection of 111In-cetuximab-F(ab′)2 to determine non–EGFR-mediated uptake of 111In-cetuximab-F(ab′)2. Images were acquired at 4, 24, and 48 h after injection on an ultra-high-resolution animal SPECT/CT scanner (U-SPECT-II; MILabs). Mice were scanned in a prone position under general anesthesia (isoflurane/N2O/O2) using the 1.0-mm-diameter multipinhole mouse collimator tube. SPECT scans were acquired for 30–90 min, depending on relapsed time after injection, followed by CT scans. As a reference, 5 mice, including 1 coinjected with 1,000 μg of cetuximab, were injected with 10 μg of 111In-cetuximab IgG (26 ± 6.2 MBq) and scanned at 4, 24, 48, and 168 h after injection for 20–60 min, followed by CT scans.
After the last scan, mice were euthanized by cervical dislocation, and uptake of the radiolabel in the tissues was determined ex vivo in a γ-counter. Scans were reconstructed with MILabs reconstruction software, using an ordered-expectation maximization algorithm with a voxel size of 0.375 mm. Tumor-to-muscle mean pixel value ratios were determined by drawing regions of interest (ROIs) around the tumor and in the hind leg muscle (Inveon Research Workplace software, version 3.0; Siemens Preclinical Solutions); mean pixel values were established by thresholding at 40% of maximum pixel value within tumor ROIs.
Autoradiography and Immunohistochemical Staining
The intratumoral distribution of the radiolabeled antibody (fragment) preparations was determined by autoradiography. Tumors from mice injected with 18 ± 2.1 MBq of 111In-cetuximab-F(ab′)2 or 26 ± 6.2 MBq of 111In-cetuximab were dissected and immediately snap-frozen in liquid nitrogen. Frozen tumor sections (5 μm thick) were cut and mounted on poly-l-lysine–coated slides for autoradiography. Slides were exposed to a Fujifilm BAS cassette 2025 overnight (Fuji Photo Film). Phospholuminescence plates were scanned using a Fuji BAS-1800 II bioimaging analyzer at a pixel size of 50 × 50 μm. Images were processed with Aida Image Analyzer software (Raytest). The same tumor sections were stained immunohistochemically.
Slides used for immunohistochemistry were fixed in acetone in 4°C for 10 min and stained for EGFR and blood vessels. Primary and secondary antibodies were diluted in primary antibody diluent (Abcam). Between all consecutive steps of the staining process, sections were rinsed 3 times for 5 min in 0.1 M PBS, pH 7.4 (Klinipath).
After rehydration in PBS, sections were incubated overnight at 4°C with goat anti-EGFR antibody (Santa Cruz Biotechnology Inc.), diluted 1:50. Subsequently, sections were incubated with donkey anti-goat Cy3 (Jackson Immunoresearch), diluted 1:600 for 30 min at 37°C. Next, sections were incubated with undiluted 9F1 (14) for 45 min at 37°C, followed by incubation with chicken anti-rat Alexa647 1:100 (Molecular Probes). Sections were mounted in Fluorostab (ICN). One adjacent section per tumor was stained with hematoxylin and eosin to help distinguish necrotic areas and nontumor tissue from viable tumor areas.
Tumor sections were analyzed using a digital image analysis system, as described previously (18). In short, whole-tissue sections were scanned, and gray-scale images (pixel size, 2.59 × 2.59 μm) for vessels and EGFR were obtained and subsequently converted into binary images. Thresholds for segmentation of the fluorescent signals were set above the background staining for each marker. Areas of necrosis were excluded from analysis by drawing ROIs.
Colocalization analysis was performed on autoradiography and immunohistochemistry gray-value images (gray scale range, 0–255). Images were coregistered using Photoshop (CS4, version 11.0.2; Adobe), and the pixel and figure size of the immunohistochemistry images were bicubically rescaled to match those of the autoradiography images for alignment (50 × 50 μm) and successively upscaled (200 × 200 μm) to compensate for image coregistration errors and scattering of the tracer signal in the autoradiography images. After alignment, ROIs drawn previously for excluding necrosis in immunohistochemical analysis were masked in autoradiography images. Coregistered pixel gray-values and overlap coefficients were determined with ImageJ (version 1.43m, JAVA-based image-processing package; National Institutes of Health) using the JACoP plug-in package (National Institutes of Health). Only pixels containing viable tumor tissue were included in the pixel-by-pixel Pearson correlation analysis of the coregistered images. Positioning accuracy between the autoradiography and immunohistochemistry images was over 95%.
Statistics
Statistical analyses were performed using Prism software (version 4.0c; GraphPad). Differences in uptake of the tracers were tested for significance using the nonparametric Mann–Whitney test. The nonparametric Spearman or parametric Pearson test was used accordingly to assess correlations between different parameters, and a P value of 0.05 or less was considered significant. Data are represented as mean ± SD.
RESULTS
In Vitro Characteristics
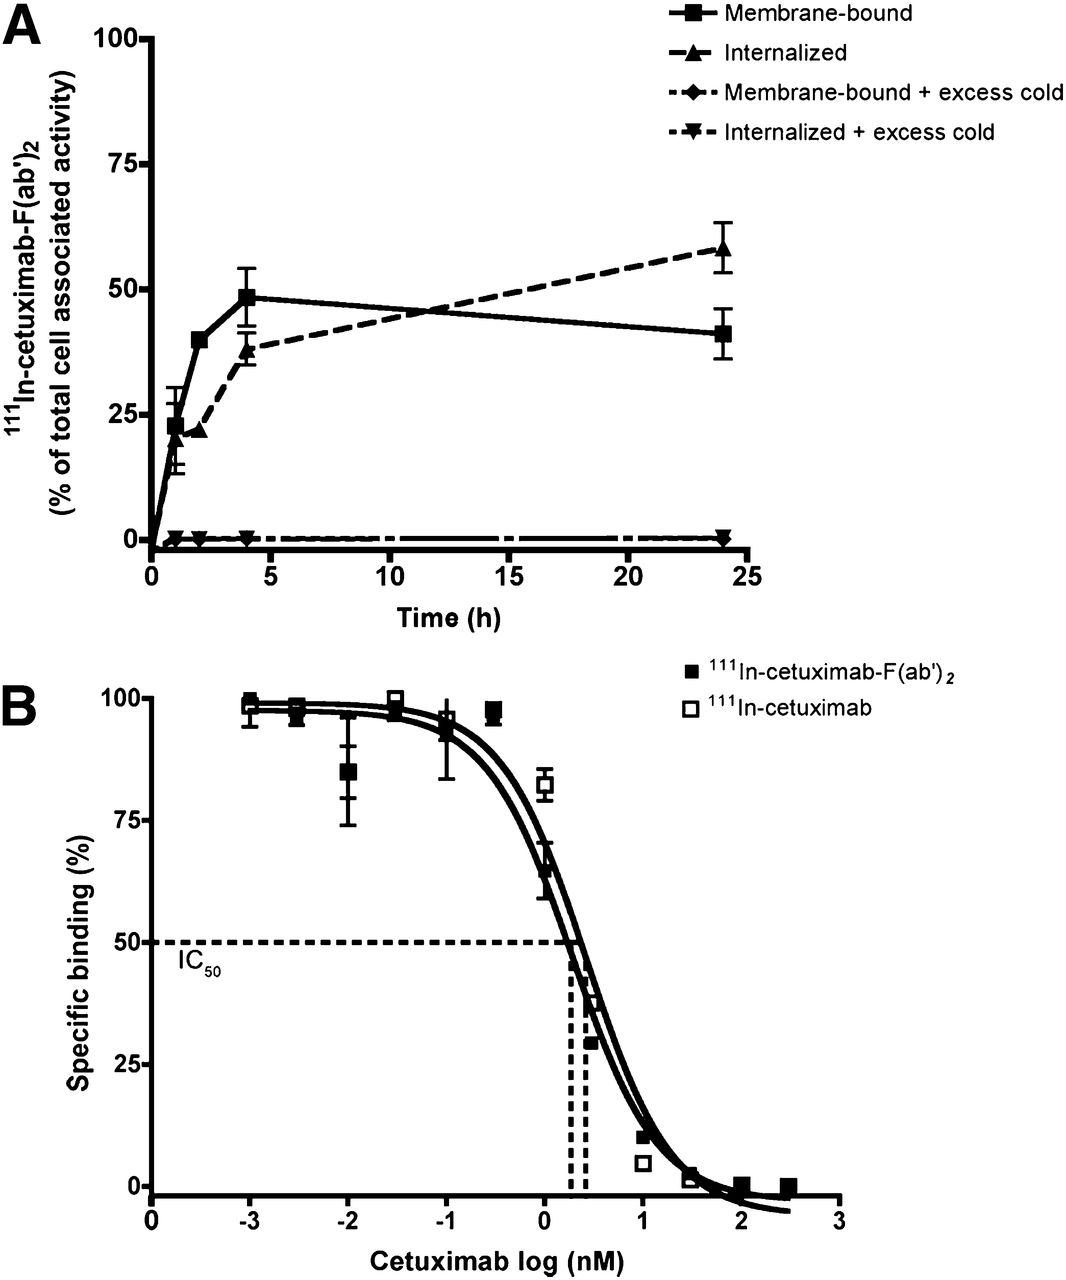
111In-cetuximab-F(ab′)2 was internalized in FaDu cells (Fig. 1A). Specific internalization gradually increased to 58% of the cell-associated activity after 24 h. The IC50 of cetuximab was 0.42 ± 0.16 nM, which was not significantly different from that of cetuximab-F(ab′)2 (0.28 ± 0.14 nM; P = 0.82) (Fig. 1B).

Internalization kinetics of 111In-cetuximab-F(ab′)2. Membrane binding and internalization in FaDu cells are presented as percentage of total cell-associated activity (A) and competitive binding curves of IC50 of 111In-cetuximab on FaDu cells with previously added cetuximab or cetuximab-F(ab′)2 (B). Data are mean ± SD.
111In-Cetuximab-F(ab′)2 Dose Escalation
The optimal protein dose of 111In-cetuximab-F(ab′)2 for SPECT imaging was determined in a dose-escalation study. Relative tracer uptake was similar at protein fragment doses up to 10 μg per mouse (11.9 ± 3.8 %ID/g, 13.5 ± 5.2 %ID/g, and 11.5 ± 3.8 %ID/g at 1, 5, and 10 μg, respectively) (Fig. 2). A protein fragment dose of 5 μg was selected for further experiments because it revealed the highest tumor-to-blood ratio of 44.5 ± 11.5 at 24 h after injection.
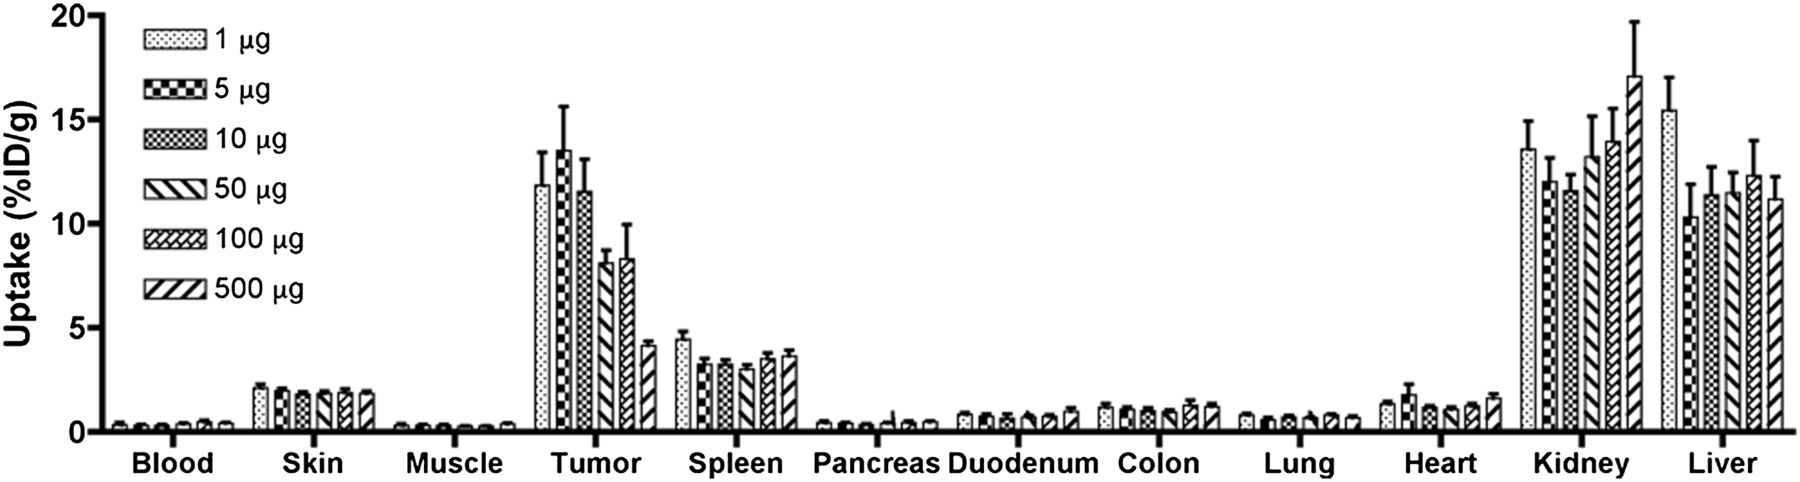
Dose escalation of 111In-cetuximab-F(ab′)2. Uptake of 111In-cetuximab-F(ab′)2 in subcutaneous FaDu tumors and other tissues, 24 h after injection. Values are presented as mean %ID/g ± SD for 6 mice per group.
Biodistribution
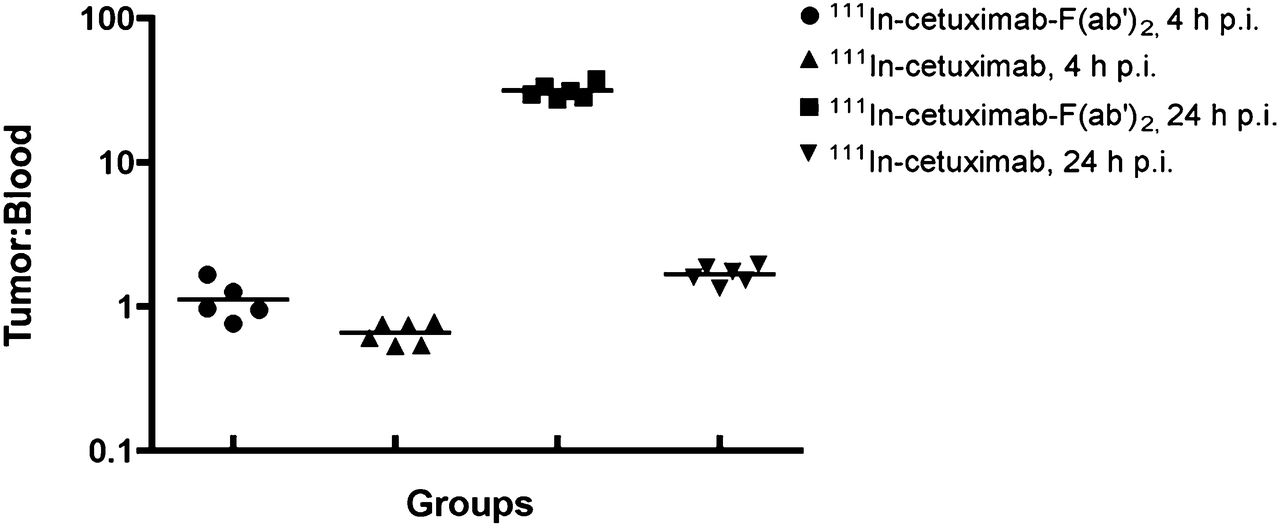
The biodistribution of 111In-cetuximab-F(ab′)2 and 111In-cetuximab at the respective optimal protein (fragment) doses is summarized in Figure 3. Tumor uptake of 111In-cetuximab-F(ab′)2 peaked at 24 h after injection at 10.3 ± 3.5 %ID/g. At the same time point, tumor uptake of 111In-cetuximab was higher (26.9 ± 3.3 %ID/g) (Fig. 3B). However, because of the rapid blood clearance of cetuximab-F(ab′)2, tumor-to-blood ratios of cetuximab-F(ab′)2 were much higher: 31.4 ± 3.8 versus 1.7 ± 0.2 at 24 h after injection (P = 0.02) (Fig. 4).

Biodistribution of 111In-cetuximab-F(ab′)2 (A) and 111In-cetuximab (B) in tumors and selected normal tissues at 4, 24, and 48 (and 168) h after tracer injection, with or without excess unlabeled cetuximab. Data are mean ± SD.

Tumor-to-blood ratios calculated from biodistribution studies (%ID/g) for 111In-cetuximab-F(ab′)2 and 111In-cetuximab at 4 and 24 h after injection. p.i. = after injection.
Autoradiography and Immunohistochemical Staining
Autoradiography showed a similar intratumoral distribution of the 111In-cetuximab-F(ab′)2, tracer compared with the expression of EGFR in the tumor as determined by immunohistochemistry (Fig. 5). Pixel-by-pixel analysis revealed a good correlation between the localized uptake of the tracer and EGFR staining pattern (mean r = 0.64; range, 0.52–0.80; P < 0.0001). Similar distribution patterns and colocalization of both signals were also seen in mice injected with the 111In-cetuximab tracer (r = 0.61; range, 0.36–0.91; P < 0.0001) (Table 1).
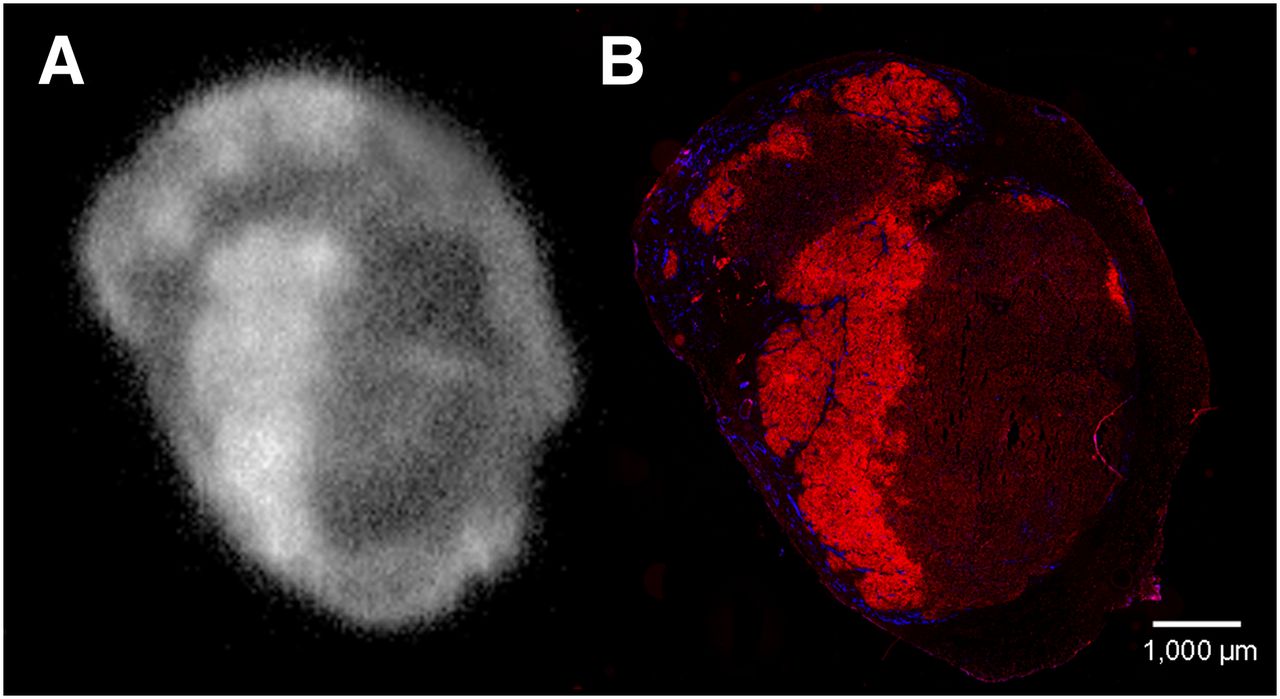
Visualization of EGFR in tumor sections. Autoradiography of 111In-cetuximab-F(ab′)2 uptake (A) and immunohistologic staining of EGFR (red) and vessels (blue) in same tumor section (B). Images were made 24 h after injection.
Spatial Correlation Between Immunohistochemistry and Autoradiography
Micro-SPECT Imaging
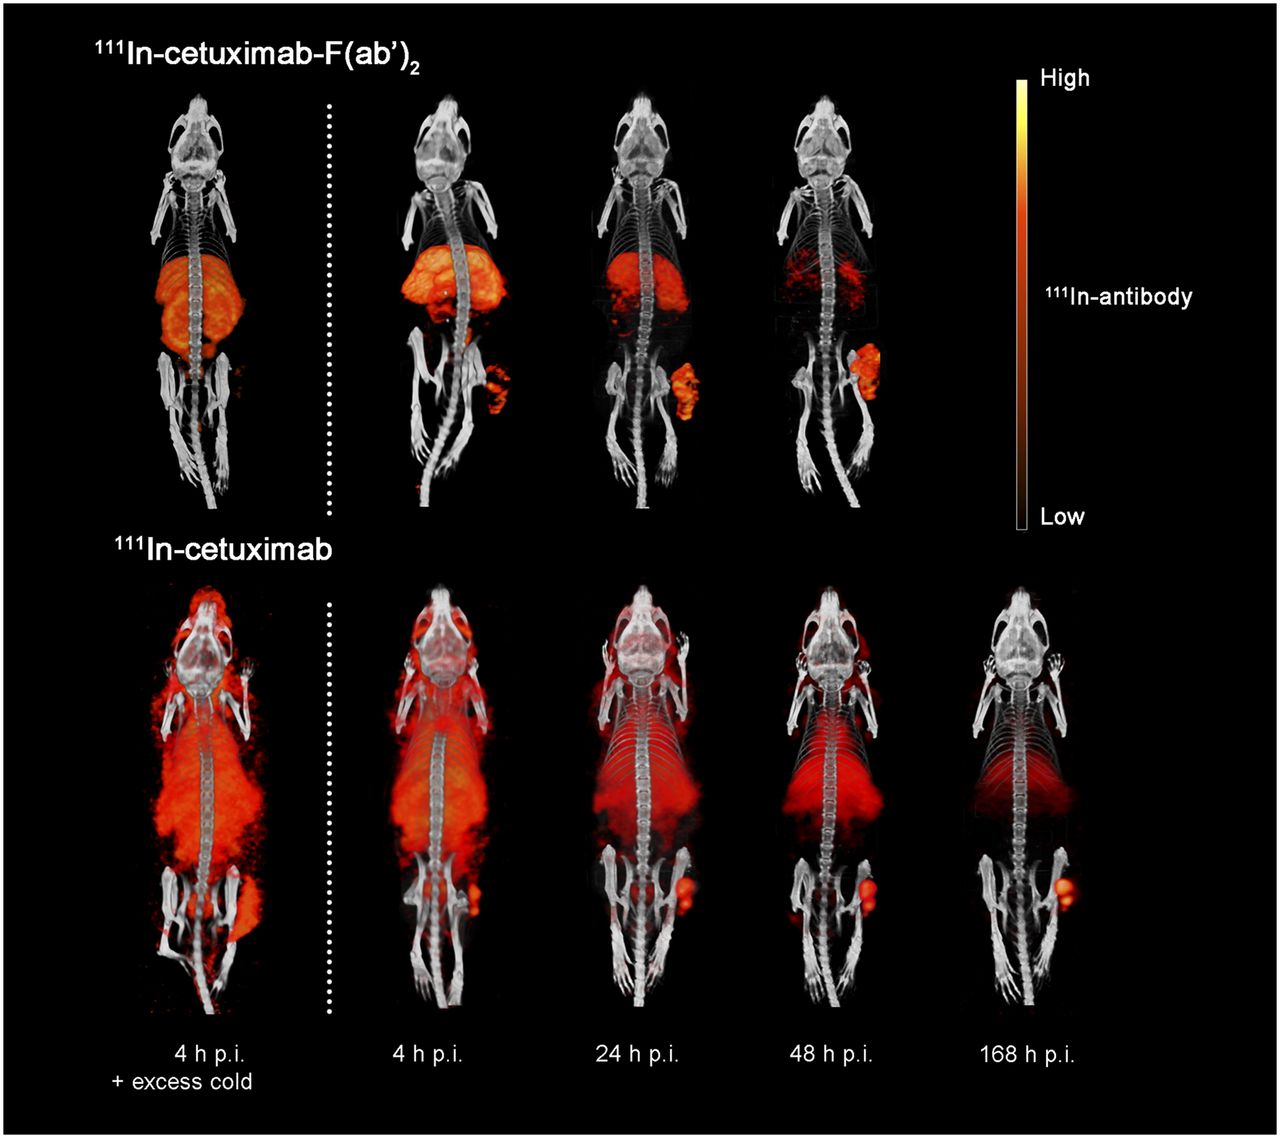
Micro-SPECT images of 111In-cetuximab-F(ab′)2 showed a preferential accumulation in the tumors as early as 4 h after injection and an increasing tumor-to-background contrast up to 48 h after injection. 111In-cetuximab-F(ab′)2 also showed visible uptake in the kidneys and liver. This uptake was not EGFR-mediated because it was also observed in mice that were coinjected with a blocking dose of cetuximab (Fig. 6). 111In-cetuximab showed clear tumor uptake from 24 h after injection onward, with tumor-to-background contrast increasing up to 7 d after injection. Background uptake levels remained high. This was also evident from tumor-to-muscle values, where a significantly higher ratio was found for 111In-cetuximab-F(ab′)2 at 24 h after injection than for 111In-cetuximab: 107.0 ± 17.0, 69.7 ± 3.9, respectively (P = 0.03) (Fig. 7).

Serial micro-SPECT images of 111In-cetuximab-F(ab′)2 were obtained at 4, 24, and 48 h after injection and of 111In-cetuximab at 4, 24, 48, and 168 h after injection, including mice that received blocking dose of unlabeled cetuximab. p.i. = after injection.

Tumor-to-muscle ratios of 111In-cetuximab-F(ab′)2 and 111In-cetuximab from SPECT imaging at 4, 24, and 48 h after injection. Data are mean ± SD. *P < 0.05. p.i. = after injection.
DISCUSSION
The present study showed that 111In-cetuximab-F(ab′)2 can be a potent tracer for noninvasive imaging of EGFR expression in HNSCC.
The IC50 of cetuximab-F(ab′)2 in the FaDu model was similar to that of cetuximab. The protein dose–escalation study revealed that tumor uptake of 111In-cetuximab-F(ab′)2 in the FaDu model was most efficient at antibody fragment doses of 10 μg/mouse or less, which is similar to the optimal entire protein dose of 111In-cetuximab (14). The accumulation of the tracer in tumors was mediated by EGFR expressed on the tumor cells, because uptake could be blocked with an excess of unlabeled cetuximab. The tracer showed nonspecific uptake in the liver and kidneys, presumably due to clearance of radiolabeled catabolites because the chimeric cetuximab (fragment) does not cross-react with murine EGFR. In patients, EGFR expression in the liver will cause specific tracer uptake. In a phase I clinical trial, in which patients with squamous cell lung carcinoma were imaged with 111In-cetuximab, the dosage of the antibody had to be increased to prevent the liver from acting as a sink (19). Up to 40 mg of cetuximab was taken up by the liver. The administration of an enhanced antibody protein dose could saturate liver uptake.
The circulatory half-life of F(ab′)2 fragments in mice is approximately 12 h, which is much shorter than that of the whole IgG (∼70 h) (20,21). In patients, the half-life of cetuximab is approximately 112 h (13,22), making the compound impractical for rapid and dynamic EGFR imaging. Because of the varying turnover rates of tumor cells and prolonged presence of the whole-antibody cetuximab tracer in the circulation, subsequent visualization could over- or underestimate the actual amount of EGFR. The relation between cellular dynamics and time of tracer imaging is especially relevant for advanced HNSCC tumors, because proliferating and hypoxic tumor cells have a profound negative impact on the outcome of radiotherapy (23–25). In addition, EGFR antibody complexes can be shed into the bloodstream (26), making late imaging less representative of actual EGFR expression levels. The differences in these time-dependent tumor microenvironmental factors between patients, such as metabolic turnover rates of the immune complexes, can result in biased interpatient variations. More rapid detection methods will improve the methodologic precision. 111In-cetuximab-F(ab′)2 could overcome this essential shortcoming of cetuximab imaging because of its rapid tumor accumulation and fast background clearance, especially notable in the tumor-to-blood ratios, which are by far superior to those of the cetuximab whole antibody.
The micro-SPECT images presented here show a good uptake of 111In-cetuximab-F(ab′)2 as early as 4 h after injection of the tracer, with excellent imaging contrast within 24 h. 111In-cetuximab had a higher absolute uptake in the tumor, but background levels remained high and sufficient tumor-to-background contrast was obtained only from 3 d after injection onward. In contrast, the rapid clearance of 111In-cetuximab-F(ab′)2 enables fast and repeated imaging.
A good correlation between immunohistochemical EGFR expression and intratumoral distribution of the cetuximab-F(ab′)2 tracer as determined by autoradiography was observed, indicating that most EGFR expressed in the tumor was targeted by 111In-cetuximab-F(ab′)2. However, previous studies have found contrasting results concerning correlations between cetuximab uptake and EGFR expression in xenografts, suggesting that the association is dependent on multiple microbiologic factors (14,22,27,28). Also, the issue of the protein fragment dose of the tracer is not trivial because our results show that tumor uptake is highly dependent on dose level. A possible explanation for the lack of correlation between EGFR expression and tumor uptake of 89Zr-labeled cetuximab in several tumor cell lines found by Aerts et al. could be the high cetuximab protein dose of 100 μg used in their study, resulting in a reduced tumor uptake of radiolabeled cetuximab and an increased background signal because of saturation of the EGFR (22).
EGFRvIII is an EGFR mutational variant of significant importance in HNSCC growth and treatment resistance; study results indicate decreased efficacy of cetuximab in EGFRvIII-expressing HNSCC (29). However, tumor cells overexpressing EGFRvIII in vitro showed high uptake of cetuximab labeled with the fluorophore Oregon Green 488, suggesting the potential for accurate imaging of EGFRvIII with cetuximab (30). In future studies, it will be of interest to evaluate the 111In-cetuximab-F(ab′)2 tracer in a tumor model expressing EGFR-mutated forms such as EGFRvIII.
EGFR-targeted therapy has become a valuable asset in the pallet of HNSCC treatment. However, as stated above, not all patients will benefit from combined radiotherapy with cetuximab. To optimize individual treatment assays, preselection of patients will increasingly become a prerequisite. Imaging of EGFR, for example, by labeling EGF, could also verify EGFR expression of a tumor (31,32) but not necessarily provide information about the accumulation of anti-EGFR drugs in these tumors. Therefore, EGFR-targeted drugs such as cetuximab, panitumumab, or tyrosine kinase inhibitors were labeled for imaging to determine the concentrations of these drugs in tumors (30,33). Clinical trials have reported the use of radiolabeled erlotinib to identify non–small cell lung cancer patients with an EGFR mutation status who will benefit from erlotinib therapy (34). Cetuximab, as well as cetuximab-F(ab′)2 as demonstrated in this study, binds to EGFR with high affinity, rendering cetuximab an optimal targeting agent and therapeutic agent for HNSCC. HNSSC exhibits heterogeneous EGFR expression that will be modulated during treatment. Cetuximab-F(ab′)2 as an early imaging tool can visualize and monitor the tumor binding of the therapeutic noninvasively and can therefore steer patient selection for anti–EGFR-targeted therapy and possibly therapy alterations.
CONCLUSION
The present study shows that cetuximab F(ab′)2 fragments can be used to image the heterogeneous EGFR expression in FaDu xenografts. Micro-SPECT imaging was optimal at 24 h after injection, though images showed adequate uptake as early as 4 h after injection. In contrast to the current clinical procedures of immunohistochemical staining, the tracer targets only EGFR accessible for agents administered systemically. Radionuclide imaging of EGFR expression can thus indicate the availability of the targetable receptor and the potential effectiveness of EGFR inhibitors. Because of its rapid pharmacokinetics, 111In-cetuximab-F(ab′)2 could serve as a predictor of tumor susceptibility for EGFR-targeted therapies such as cetuximab and steer individualized treatment decisions.
DISCLOSURE
The costs of publication of this article were defrayed in part by the payment of page charges. Therefore, and solely to indicate this fact, this article is hereby marked “advertisement” in accordance with 18 USC section 1734. This study was financially supported by a research grant of the Dutch Cancer Society (2010-4688). No other potential conflict of interest relevant to this article was reported.
Acknowledgments
We thank Bianca Lemmers-de Weem, Kitty Lemmens-Hermans, Iris Lamers-Elemans, Henk Arnts, Jasper Lok, and Annemarie Eek (Radboud University Nijmegen Medical Centre) for their technical assistance.
Footnotes
Published online Oct. 17, 2013.
- © 2013 by the Society of Nuclear Medicine and Molecular Imaging, Inc.
REFERENCES
- Received for publication March 27, 2013.
- Accepted for publication June 26, 2013.


Jump to section
Related Articles
Cited By...
- Fluorescence Lifetime-Based Tumor Contrast Enhancement Using an EGFR Antibody-Labeled Near-Infrared Fluorophore
- Affibody-Based PET Imaging to Guide EGFR-Targeted Cancer Therapy in Head and Neck Squamous Cell Cancer Models
- Advancing biomedical imaging
- PET Imaging in Head and Neck Cancer Patients to Monitor Treatment Response: A Future Role for EGFR-Targeted Imaging
- 111In-Cetuximab-F(ab')2 SPECT and 18F-FDG PET for Prediction and Response Monitoring of Combined-Modality Treatment of Human Head and Neck Carcinomas in a Mouse Model
- Quantitative In Vivo Immunohistochemistry of Epidermal Growth Factor Receptor Using a Receptor Concentration Imaging Approach
- Early Response Monitoring with 18F-FDG PET and Cetuximab-F(ab')2-SPECT After Radiotherapy of Human Head and Neck Squamous Cell Carcinomas in a Mouse Model