


Abstract
On the one hand, the translocator protein (TSPO) radioligand N,N-diethyl-2-(2-(4-(2-18F-fluoroethoxy)phenyl)-5,7-dimethylpyrazolo[1,5-a]pyrimidin-3-yl)acetamide (18F-DPA-714) has been suggested to serve as an alternative radiotracer to image human glioma, and on the other hand the alkylphosphocholine erufosine (ErPC3) has been reported to induce apoptosis in otherwise highly apoptosis-resistant glioma cell lines. The induction of apoptosis by ErPC3 requires TSPO, a mitochondrial membrane protein highly expressed in malignant gliomas. In this preclinical study, we monitored the effect of ErPC3 treatment in vivo using 18F-DPA-714 PET. Methods: In vitro studies investigated the antitumor effect of ErPC3 in 9L rat gliosarcoma cells. In vivo, glioma-bearing rats were imaged with 18F-DPA-714 for the time of treatment. Results: A significant decrease in 9L cell proliferation and viability and a significant increase in apoptosis and caspase-3 activation were demonstrated on ErPC3 treatment in cell culture. In the rat model, ErPC3 administration resulted in significant changes in 18F-DPA-714 tumor uptake over the course of the treatment. Immunohistochemistry revealed reduced tumor volume and increased cell death in ErPC3-treated animals accompanied by infiltration of the tumor core by CD11b-positive microglia/macrophages and glial fibrillary acidic protein–positive astrocytes. Conclusion: Our findings demonstrate a potent antitumor effect of ErPC3 in vitro, in vivo, and ex vivo. PET imaging of TSPO expression using 18F-DPA-714 allows effective monitoring and quantification of disease progression and response to ErPC3 therapy in intracranial 9L gliomas.
The 18-kDa translocator protein (TSPO) is a mitochondrial membrane protein implicated in cholesterol transport, cell proliferation, and apoptosis (1). TSPO is mainly located in the adrenal glands, kidneys, lungs, and heart. It has a low expression level in the central nervous system. However, TSPO expression is dramatically increased after glial cell activation and has become a well-characterized marker for neuroinflammation (2,3). TSPO overexpression has also been described in several human tumors, including breast, prostate, colon, and brain (4). Its overexpression is correlated with an aggressive tumor phenotype, increased cancer cell proliferation, and highly malignant tumor grades (5,6). In glioma, the overexpression of TSPO is associated with tumor cell proliferation, invasion, and migration (7,8).
PET is the preferred modality to noninvasively image and quantify TSPO expression in the brain and has been extensively performed in the past using the isoquinoline derivative 11C-PK11195 in patients and animal models (9). Recently, newly developed TSPO radioligands with improved in vivo specificity for TSPO have been described. In particular, 18F-DPA-714 (N,N-diethyl-2-(2-(4-(2-18F-fluoroethoxy)phenyl)-5,7-dimethylpyrazolo[1,5-a]pyrimidin-3-yl)acetamide (10)) has shown clear and quantitative PET imaging of TSPO expression in several animal models (11). Our group and others have successfully shown highly specific TSPO imaging using 18F-DPA-714 in rat models of brain cancer and demonstrated its potential as a promising imaging marker for glioma (12,13). In addition, several studies have reported a correlation between TSPO protein levels measured using Western blot and TSPO radioligand binding (3H-PK11195, 18F-DPA-714, 18F-PBR06) in rat models of glioma and multiple sclerosis (11,13–15).
Erucylphosphocholine (ErPC) is an alkylphosphocholine, part of a new class of synthetic lipophilic ether lipids that have shown promising antineoplastic activity in vitro and in vivo (16). ErPC demonstrated antitumor activity in several human and rat glioma cell lines (17,18) and induced apoptosis in the chemoresistant glioblastoma cell lines (15). Erucylphosphohomocholine (ErPC3; Erufosine [Genzyme]) is a congener of ErPC with higher water solubility and is able to cross the blood–brain barrier (19,20). Similarly to ErPC, ErPC3 exhibits potent antitumor activities in the micromolar range (21) and induces apoptosis in otherwise highly apoptosis-resistant glioblastoma cell lines (15). The mechanism of the cytotoxic and apoptotic actions of ErPC3 in several different cancer cell types has been linked to plasma membrane damage and direct or indirect disruption of Akt signaling (22). It has been suggested that ErPC3 could act directly on the mitochondria (23) because ErPC- and ErPC3-induced apoptosis require the presence of TSPO (24).
The present investigation focuses on characterizing the antineoplastic activity of ErPC3 in glioblastoma. Given the reported ability of 18F-DPA-714 to accurately reflect TSPO density in normal or diseased brain (11,13), we investigated its performance to noninvasively and quantitatively assess treatment efficacy of ErPC3 in vivo in an orthotopic 9L glioma model. In addition, histologic and immunohistochemical analyses were used to evaluate the changes in tumor volume, intratumoral level of TSPO expression, and presence of TSPO-positive microglia/macrophages and astrocytes in ErPC3- and mock-treated animals.
MATERIALS AND METHODS
Assessment of Cell Viability, Proliferation, and Apoptosis
Rat 9L gliosarcoma cells were grown in Dulbecco modified Eagle medium (Sigma-Aldrich) containing 10% fetal bovine serum (Roche Diagnostics) and 1% antibiotics (penicillin/streptomycin; Life Technologies). Cultures were maintained at 37°C in humidified air containing 5% CO2.
Cell survival was assessed using the methyl-thiazoldiphenyl-tetrazolium bromide (MTT) assay (Sigma-Aldrich). 9L cells were plated at a density of 2.5 × 10³ cells per well in 96-well microplates and incubated for 24, 48, 72, and 92 h with increasing concentrations of ErPC3 (0, 10, 25, 50, and 100 μM). ErPC3 was generously provided by Genzyme Pharmaceuticals. For in vitro studies, ErPC3 was dissolved in 70% ethanol and added to the cell culture medium at the desired final concentration. The ErPC3-containing medium was then removed and cells incubated for 1 h at 37°C with MTT in phosphate-buffered saline (5 mg/mL). After removal of the MTT solution, dimethyl sulfoxide (Sigma-Aldrich) was added for 15 min before absorbance values were determined using a Mithras Microplate Reader LB 940 (Berthold Technologies) at a 560-nm wavelength (reference wavelength, 650 nm). DNA synthesis was measured 24 h after the addition of ErPC3 by bromodeoxyuridine incorporation using the bromodeoxyuridine enzyme-linked immunosorbent assay (ELISA) kit (Roche Molecular Biochemicals) according to the manufacturer’s instruction.
The Cell Death Detection ELISA Kit (Roche Molecular Biochemicals) was used to determine apoptosis (DNA fragmentation) in 9L cells treated with ErPC3 at concentrations of 0, 25, 50, and 100 μM. Cells (5.0 × 10⁵) were plated in 6-well plates. Twenty-four hours after the addition of ErPC3, the cells were trypsinized, collected from the wells, and centrifuged (1,500g, 5 min, 4°C). Cell pellets were then resuspended in lysis buffer and treated according to the manufacturer’s instruction. Absorption of the samples was measured at a wavelength of 405 nm (reference wavelength, 490 nm) using the Mithras Microplate Reader LB 940.
Western Blot
Western blots were performed as previously described (12) using the following primary antibodies: rabbit antirat TSPO antibody NP155 (provided by Dr. Makoto Higuchi, NIRS; 1/10,000 dilution), mouse antitubulin (Sigma-Aldrich; 1/20,000), rabbit anticaspase3 primary antibody (Cell Signaling Technology; 1/500), and appropriate secondary horseradish peroxidase–coupled antibodies (Santa Cruz Biotechnology; 1/2,000). More details are provided in the supplemental information (supplemental materials are available at http://jnm.snmjournals.org).
Animal Model
All experiments were performed under an animal use and care protocol approved by the local animal ethics committee and conducted in accordance with the European Union regulations on animal research. 9L gliosarcoma cells were stereotactically implanted in the brain of adult male Fischer rats (mean body weight, 301 ± 16 g; n = 19) as previously described (12). Glioma development was monitored using 18F-DPA-714 PET. A baseline 18F-DPA-714 PET scan was obtained 11 d after tumor implantation, and follow-up 18F-DPA-714 PET scans were then acquired at 1 and 2 wk after therapeutic intervention. Rats received either ErPC3 (40 mg/kg of body weight, n = 10) or mock treatment (2% 1,2-propanediol diluted in saline, n = 9) at 48-h intervals up to 2 wk. For in vivo administrations, ErPC3 was prepared as described in the literature (20).
Radiochemistry
Ready-to-inject, radiochemically pure 18F-DPA-714 (>99%) was prepared from cyclotron-produced 18F-fluoride as previously reported (10) using a commercially available TRACERLab FX-FN synthesizer (GE Healthcare), a process that was formerly performed on a Zymate-XP robotic system (Zymark) (supplemental information) (25). The specific radioactivity of 18F-DPA-714 samples used for this study was 120 ± 92 GBq/μmol, with a range from 41 to 244 GBq/μmol.
PET Imaging and Data Analysis
Brain imaging was performed on a Focus 220 micro-PET scanner (Siemens Medical Solutions). Animals (n = 19) were imaged at 11, 19, and 25 d after stereotactic implantation of 9L cells corresponding to 0, 8, and 14 d after intraperitoneal treatment. Rats receiving intravenous injections of ErPC3 were imaged at days 11, 18, and 25 after tumor implantation corresponding to 0, 7, and 14 d after treatment. Animals were anesthetized with an isoflurane/O2 mixture (induction, 4%–5%; maintenance, 2%–2.5%). During imaging, the head of the animals was fixed in the flat skull position using a homemade stereotactic frame compatible with PET acquisition. Their body temperature was maintained normothermic using a heating blanket. The PET radiotracer 18F-DPA-714 was injected intravenously via a 24-gauge catheter placed on the tail vein. 18F-DPA-714 injected doses were 53 ± 13 MBq. PET acquisition started 30 min after the injection of 18F-DPA-714 and lasted 30 min (2 frames of 15-min acquisitions each). Finally, the emission sinograms for each acquisition frame were normalized and corrected for scatter, attenuation, and radioactivity decay. Image reconstruction was performed using Fourier rebinning and a 2-dimensional ordered-subset expectation maximization algorithm (16 subsets and 4 iterations).
PET image analysis was performed using VINCI, a fast graphical image analysis package (26) equipped with image coregistration tools, and the Anatomist BrainVISA software package (http://www.brainvisa.info). Quantitative volume-of-interest (VOI) analysis was performed on the summed image datasets. Briefly, a VOI was manually delineated on the tumor and, as a control region, a mirror reference VOI was symmetrically generated on normal brain tissue of the contralateral hemisphere as previously described (12).
Histology
After the last PET session, the rats were sacrificed and their brains rapidly excised and frozen in isopentane precooled in liquid nitrogen (−50°C) and then stored at −80°C until use. Frozen transversal brain sections (20-μm thick) of whole tumor specimen were cut at −20°C using a cryostat (Leica).
Brain sections were stained with hematoxylin and eosin according to the manufacturer’s instructions (Labonord). Hematoxylin and eosin staining was used to estimate tumor volumes with the CellProfiler image analysis software (www.cellprofiler.org) (27). Tumor areas in coronal sections (20-μm thick) were delineated in every slice, and the total tumor volume was calculated according to Equation 1, where yi is the cross-sectional area of the ith section through the morphometric region, xi is the distance orthogonal to the plane of section of the ith section, and n is the total number of sections. Brain tumor sections (48 ± 8 per animal) were used to calculate tumor volume. Eq. 1
Eq. 1
Immunohistochemistry staining was performed as previously described (supplemental information) (12). Sections were imaged using an AxioObserver Z1 microscope (Zeiss).
A terminal deoxynucleotidyl transferase-mediated dUTP nick-end labeling (TUNEL) assay was performed according to the manufacturer’s instructions (DeadEnd Fluorometric TUNEL system; Promega). Negative controls were prepared by omitting nucleotides from the reaction mixture. These sections were subsequently incubated with rabbit antirat TSPO (NP155, 1:1000) and 4′,6-diamidino-2-phenylindole as previously described. Specifically, the number of TUNEL-positive cells within the tumor area was assessed by estimating the percentage of labeled cells at 2 wk after treatment. Images were analyzed using the ImageJ software ((28); http://rsbweb.nih.gov/ij/). A region of interest (ROI) was manually defined for the areas showing positive TUNEL staining, and a second ROI was drawn based on the positive TSPO staining, which served as a surrogate marker for identifying the tumor area (12). The mean and SD of the ratio (TUNEL-positive areas/TSPO-positive tumor areas) were calculated, expressed in percentage, and used as the apoptotic index measured at 2 wk after treatment.
Autoradiography and competitive binding was used to assess specific binding for TSPO with an excess of unlabeled DPA-714 as previously described (supplemental information) (29). Autoradiograms were analyzed using the ImageJ software. ROIs were manually drawn on the tumor, and a control ROI was defined in the contralateral hemisphere. The mean greyscale value of each ROI in autoradiograms was expressed as the ratio of integrated density in arbitrary units per mm2.
Statistical Analysis
Comparisons of cell culture data, PET data, and body weight assessment between control and treated animals were performed using a 1-way variance analysis and Bonferroni multiple comparison tests for post hoc analysis (GraphPad Prism; GraphPad Software Inc.). Two-group comparison was evaluated by an unpaired t test.
RESULTS
ErPC3 Inhibits Proliferation, Reduces Cell Viability, and Induces Apoptosis in 9L TSPO-Expressing Glioma Cells
Western blot analysis revealed high levels of TSPO proteins in rat 9L and C6 cells, whereas little or no TSPO signal was visible in murine GL261 cells (Fig. 1A).
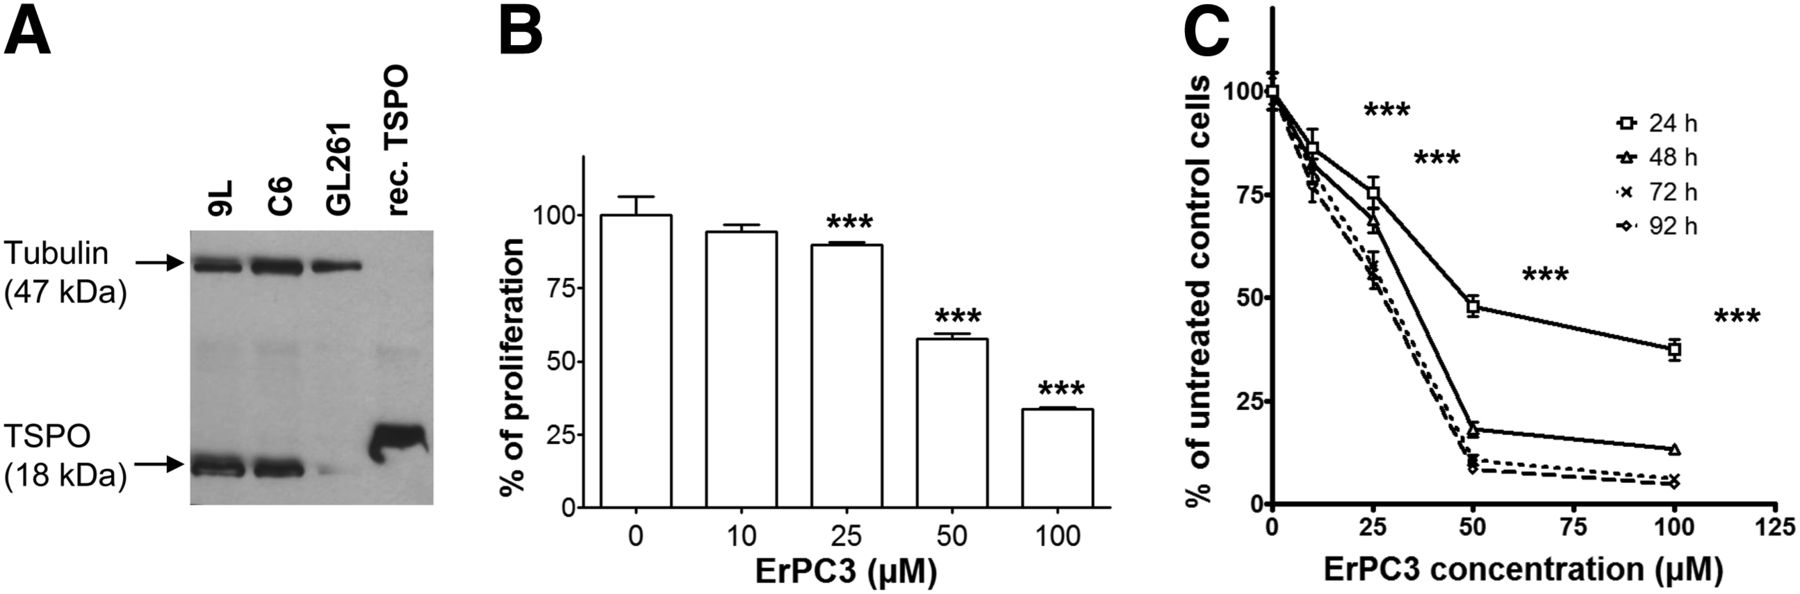
Expression levels of TSPO and effect of ErPC3 treatment on proliferation and viability of glioma cells in culture. (A) TSPO expression levels assessed by Western blot analysis of 9L, C6, and GL261 cells. β-tubulin was used as protein-loading index. TSPO recombinant protein has a molecular weight of 20.4 kDa, slightly larger than native TSPO. (B) Effect of ErPC3 on 9L cell proliferation as measured by bromodeoxyuridine incorporation. ***P < 0.001 for 25, 50, and 100 μM ErPC3 versus control. (C) Effect of ErPC3 on 9L cell viability using MTT assay. ***P < 0.001, ErPC3- versus control-treated cells, 24 h. Results are expressed as mean ± SD percentage of untreated controls.
Increasing inhibition of bromodeoxyuridine incorporation was observed in 9L cells after ErPC3 treatment at concentrations ranging from 10 to 100 μM (Fig. 1B, ***P < 0.001 control vs. 25, 50, and 100 μM ErPC3), whereas no effect on DNA synthesis was observed using a control solution. In addition, MTT assays showed a dose- and time-dependent toxicity on ErPC3-treated 9L cells (Fig. 1C) resulting in a significant reduction of cell viability already at 10 μM and 24 h of ErPC3 administration (P < 0.001).
To determine whether the decrease in proliferation was due to apoptosis, we investigated ErPC3-induced DNA fragmentation and cleavage of caspase-3. 9L cells displayed a 2.0- up to 10.8-fold increase in apoptotic levels (at 10 and 100 μM ErPC3, respectively; Fig. 2A). The augmentation of apoptotic levels was statistically significant (P < 0.001). Cleavage of caspase-3 was detected in ErPC3-treated cells as demonstrated by a decrease in the full-length protein and an increase in the level of cleaved caspase-3 (Fig. 2B).
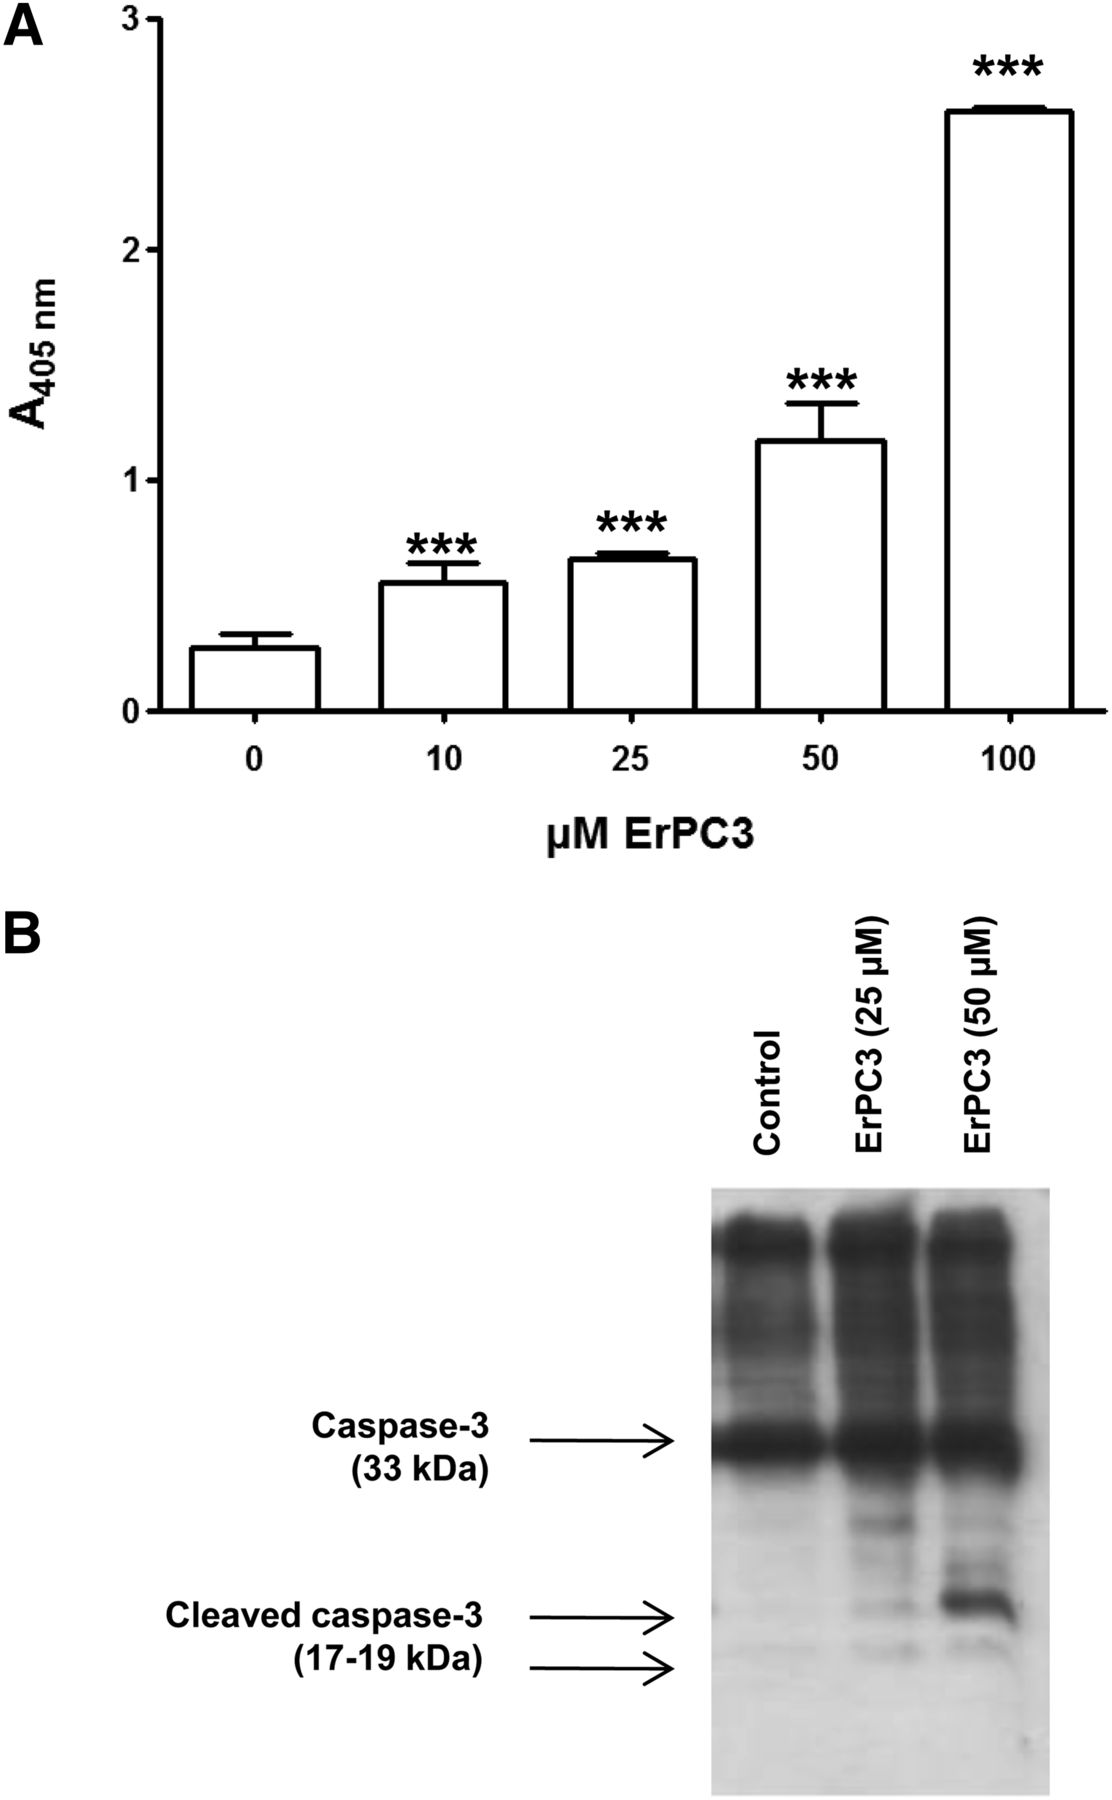
Effect of ErPC3 on apoptosis. (A) Absorbance at wavelength of 405 nm indicates level of apoptosis. Results are mean ± SD. ***P < 0.001, ErPC3 versus control treatment. (B) Western blot analysis of caspase-3 processing after 0, 25, and 50 μM ErPC3 for 24 h.
ErPC3 Treatment of Intracranial 9L Glioma in Rats
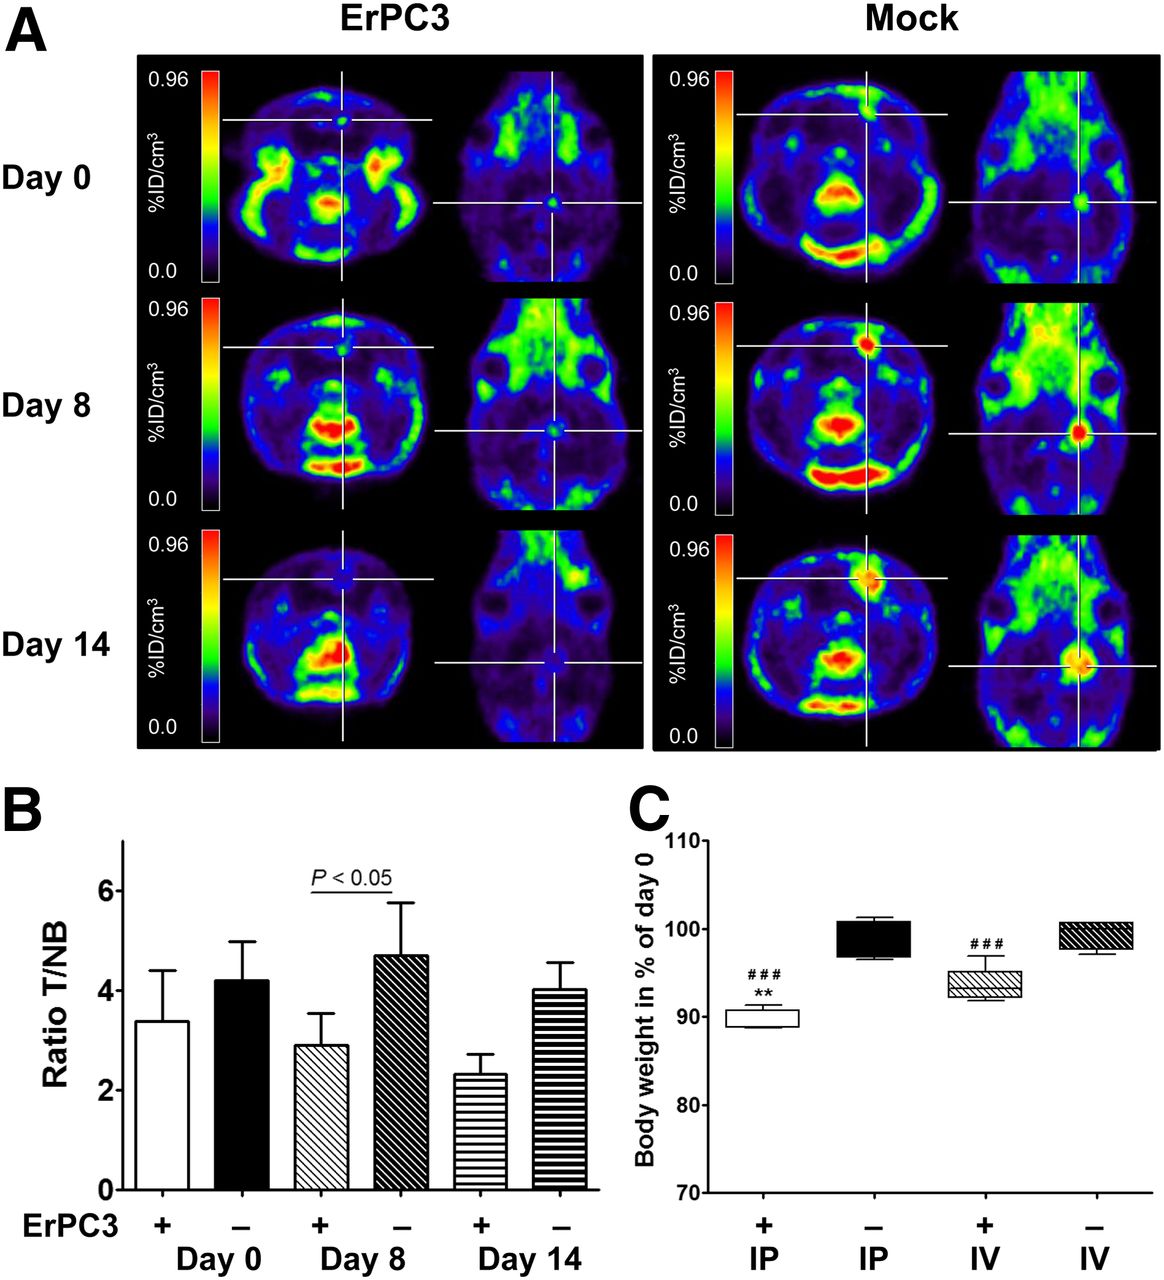
Baseline PET images showed 3- to 4-fold-higher 18F-DPA-714 uptake in the tumor than in the control region (P < 0.0001 for ErPC3- and control-treated animals; Fig. 3A). Analysis of the PET data showed a decrease of 18F-DPA-714 uptake within the tumor, with respect to pretreatment uptake, at 8 and 14 d after initiation of ErPC3 treatment. In ErPC3-treated animals, the mean standardized uptake value (SUV) within the tumor VOI was 1.04 ± 0.21 (SUV range, 0.75–1.25, baseline), 1.14 ± 0.11 (0.98–1.22, day 8 after therapy), and 1.00 ± 0.18 (0.82–1.17, day 14 after therapy). In control animals, the SUV of 18F-DPA-714 uptake was 1.37 ± 0.15 (SUV range, 1.22–1.54, baseline), 1.77 ± 0.44 (1.21–2.16, day 8), and 1.55 ± 0.19 (1.34–1.78, day 14). The differences between groups were significant at 8 d of therapy (P = 0.002).

Effect of ErPC3 in vivo. (A) ErPC3 treatment reduces 18F-DPA-714 tumor uptake: representative coregistered brain 18F-DPA-714 PET images in ErPC3- and mock-treated animals before and during ErPC3 treatment. (B) Graphs of mean ± SD of tumor-to-contralateral 18F-DPA-714 uptake ratios for ErPC3- and control-treated animals at day 0, 8, and 14 after intraperitoneal (IP) administration. T/NB ratios show significant difference (P < 0.05) between 2 groups at day 8 of ErPC3 administration. (C) One week of ErPC3 treatment reduces body weight significantly (###P < 0.001, compared with control group). Intraperitoneal injections of ErPC3 induce more severe loss in body weight than intravenous (IV) injections (**P < 0.01). %ID/cm3 = percentage injected dose per cubic centimeter.
Intraperitoneal ErPC3 treatment, compared with control treatment, showed statistically significant loss of body weight (P < 0.001). Animals that received ErPC3 intraperitoneally showed a mean loss in body weight of 10.6% ± 1.2% after 6 d of treatment. To investigate whether another administration route had less influence on body weight loss, we injected ErPC3 intravenously. Compared with controls, intravenously injected animals showed a significant mean reduction (6.4% ± 1.9%) of body weight (P < 0.001). Loss of body weight was significantly higher for animals that received ErPC3 intraperitoneally than for those that received the drug intravenously (P < 0.01; Fig. 3).
To account for changes in body weight and 18F-DPA-714 uptake in the tumor versus a control region, normal brain of the contralateral hemisphere, tumor–to–normal brain ratios (T/NB) were calculated (Fig. 3). Even though the statistical significance of the difference between the 2 groups was reduced (P < 0.05) at 8 d after intraperitoneal ErPC3 administration, the T/NB values were 2.9 ± 0.6 and 4.7 ± 1.0 for ErPC3-treated versus mock-treated animals, respectively. Similar results were obtained for animals that received ErPC3 intravenously, with T/NB values of 2.9 ± 0.5 for ErPC3-treated and 5.3 ± 1.4 for control animals (P < 0.01).
Effect of ErPC3 on 9L Tumor Size, 18F-DPA-714 Binding, Apoptosis, and Cell Infiltration
The mean tumor volumes estimated from sections of whole tumor specimens were 111 ± 75 mm3 after 14 d of treatment (n = 3) and 203 ± 146 mm3 for mock-treated animals (n = 4) (Figs. 4A and 4B). Although the mean tumor volume for the control group is almost double that of the ErPC3-treated group, this difference was not statistically significant due to high interanimal variability (P = 0.37).
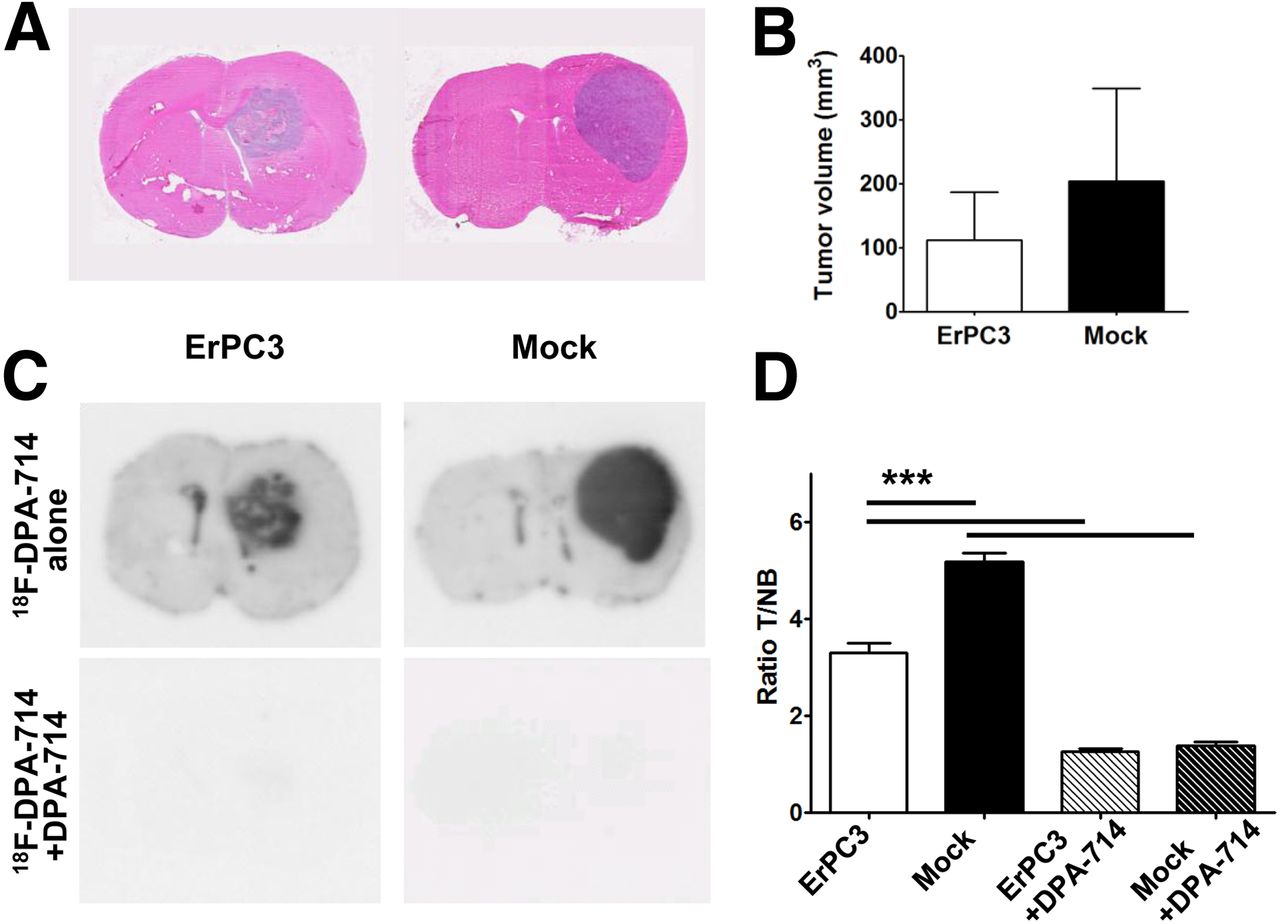
ErPC3 decreases tumor volume. (A) Hematoxylin and eosin staining of brain sections from ErPC3- and mock-treated animals. (B) Quantitative analysis using CellProfiler. Tumor volumes are smaller in ErPC3-treated than in control animals at day 14 after treatment, but this difference is not statistically significant (P = 0.37). (C) Autoradiography of tumor-bearing brain sections. 18F-DPA-714 binding is significantly reduced in ErPC3-treated versus control animals and in presence of nonlabeled DPA-714 (P < 0.0001).
Figure 4 demonstrates specificity of 18F-DPA-714 binding. Coincubation with a 5,000-fold excess of nonradiolabeled DPA-714 showed significantly reduced 18F-DPA-714 binding in ErPC3- and mock-treated animals, respectively (P < 0.0001). 18F-DPA-714 binding was also significantly lower in ErPC3- than in mock-treated animals (3.3 ± 0.4 vs. 5.2 ± 0.4, P < 0.001, Figs. 4C and 4D).
For the assessment of apoptosis, brain sections were double-stained for TUNEL and TSPO. In ErPC3-treated animals, a decrease in TSPO signal correlated with TUNEL-positive areas (Fig. 5A). The ratio of TUNEL-positive area to TSPO-positive area (TUNEL+/TSPO+) was significantly higher in ErPC3-treated (17.8 ± 8.8) than in mock-treated rats (0.5 ± 0.1; P < 0.0001) (Fig. 5B).

TUNEL staining in experimental gliomas. (A) Increased levels of TUNEL staining (green) in tumors of ErPC3-treated animals, compared with controls, is indicative of increased apoptosis. TSPO staining (red) shows lack of TSPO expression in some TUNEL-positive cells (combined image). (B) Quantitative evaluation of tumor area demonstrates increase in percentage of TUNEL-positive cells in ErPC3-treated animals, compared with mock-treated animals.
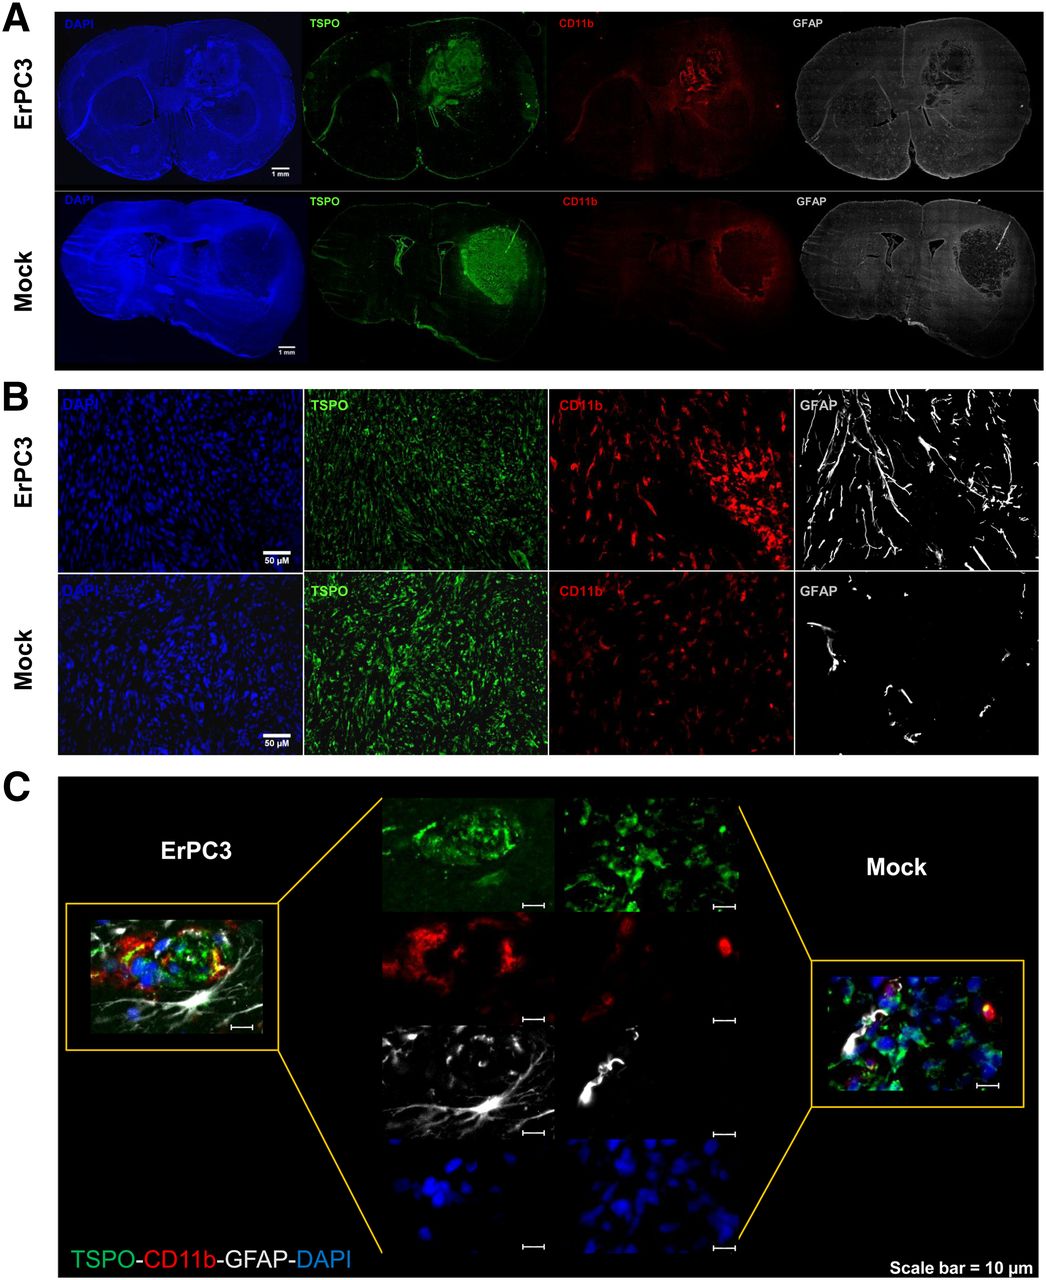
In the brain, high levels of TSPO are mainly found in activated microglia/macrophages, activated astrocytes, and glioma cells. Thus, the 18F-DPA-714 PET signal and the TSPO immunolabeling in the tumor may originate from a combination of these 3 cell types as previously demonstrated (12). To investigate the presence of activated microglia/macrophages and astrocytes, we performed multiple immunolabeling for TSPO, CD11b, and glial fibrillary acidic protein (GFAP) as markers of glioma, activated microglia/macrophages, and astrocytes, respectively. In mock-treated rats, CD11b and GFAP signals were mainly observed in the periphery of the tumor. An increase in CD11b-positive cells within the tumor core was observed after ErPC3 treatment (Figs. 6A and 6B). Similarly, numerous GFAP-positive cells were also seen in the tumor core (Figs. 6A and 6B) of ErPC3-treated animals. At higher magnification, the ErPC3-treated rat brain sections showed costaining of CD11b-positive and GFAP-positive cells with TSPO. Colocalization of the CD11b and TSPO signal was also found in tumors of control animals, but there was no colocalization of GFAP-positive cells with TSPO-positive stain (Fig. 6C).

Increased infiltration of microglia and astrocytes in ErPC3-treated tumors. (A) Immunohistochemical staining of TSPO (green), CD11b (red), and GFAP (white) of whole coronal brain sections from animals bearing intracranial 9L glioma. (B) More CD11b-positive and GFAP-positive cells are found within tumor core of ErPC3-treated animals than controls. (C) TSPO expression in CD11b-positive and GFAP-positive cells in tumor core of ErPC3-treated animals is hardly detectable in control animals. DAPI = 4′,6-diamidino-2-phenylindole.
DISCUSSION
In 2012, the mean survival rate from glioma at the time of diagnosis was 15 mo; new treatments are urgently required. ErPC3, an alkylphosphocholine derivative, has been reported to exert proapoptotic action on glioblastoma cells. In the present study, we investigated the activity of ErPC3 on rat 9L glioma, in vitro in cell cultures, and in vivo using molecular imaging.
In cell culture, ErPC3 reduced 9L cell proliferation and viability significantly. Induction of apoptosis was demonstrated by a significant increase in DNA degradation in 9L cells and caspase-3 activation. These results are in agreement with previously published reports demonstrating that ErPC3 has antineoplastic and apoptotic effects on glioblastoma cells (15,23,30).
The positive in vitro results encouraged us to further explore ErPC3 as treatment for rats bearing intracranial 9L gliomas. Erdlenbruch et al. investigated the in vitro and in vivo effect of ErPC (25 mg/kg) in subcutaneous and intracerebral grafts of C6 glioma (18). They noted a positive treatment response, but only in subcutaneous tumors, whereas the intracerebral tumors showed a poor response to therapy, which they explained by a limited access of ErPC to the central nervous system leading to low concentrations of the drug in the intracranial tumors. However, other studies reported drug concentrations higher than 200 nmol/g in rat and mouse brain tissue on ErPC and ErPC3 administration at 40 mg/kg (19,20), concentrations exceeding the threshold doses of ErPC (lethal concentration 50 [LC50]; concentration required to kill 50% of a population = 29–70 μM (17)) and ErPC3 (LC50 < 50 μM, this study) that induce cytotoxicity in glioma cell lines in vitro, suggesting that the concentration of ErPC3 reaching the intracranial 9L tumors is sufficient to induce tumor cell death.
An alternative explanation is that Erdlenbruch et al. (18) started the ErPC treatment 11 d before tumor implantation, thus exploring the capacity of ErPC to delay tumor growth without providing any indication on its direct therapeutic activity in established tumors. Here, TUNEL staining of brain sections and ex vivo measurements show increased cell death (Fig. 5) and a tendency toward a decrease in mean tumor volume (Fig. 4) on ErPC3 treatment. However, the difference in the mean tumor volumes between the ErPC3-treated and control groups was not statistically significant (P = 0.37). Still, we cannot exclude that this lack of statistical significance could be due to the large interanimal variability (coefficient of variation = 67% and 72%) or the small sample size (n = 3 and 4 for treated and control groups, respectively).
It is generally accepted that changes in tumor size correlate to treatment efficacy and survival benefit. Specifically, response to treatment is often based on the Response Evaluation Criteria In Solid Tumors, which consists of the measurement of the longest dimension in the lesion for all target lesions (31). Although these criteria are useful to standardize evaluation of treatment response across different clinical trials, they fail to capture cases when a therapeutic response is achieved without significant tumor shrinkage, particularly when targeted therapies are administered and a cytostatic treatment effect is achieved (32,33). To better account for these cases, the incorporation of functional and metabolic imaging evaluation parameters has been proposed (33). For example, functional and metabolic imaging using PET, in particular 18F-FDG, has extensively demonstrated its value for the evaluation of treatment response of targeted drugs and in the monitoring of early response to therapies (34). However, 18F-FDG brain tumor detection is limited by high background signal in the normal brain, resulting in low tumor-to-background ratios. Radiolabeled amino acids or nucleosides such as 3′-deoxy-3′-18F-fluorothymidine (18F-FLT) have also been used as predictive markers for glioma treatment response (35,36). However, the transport of thymidine analogs is restricted across the intact blood–brain barrier, limiting the use of 18F-FLT for early glioma development. As TSPO expression in glioma has been correlated to malignancy, proliferation, apoptosis, and survival, it was explored as a prognostic marker (6–8). Here, PET imaging of TSPO with 18F-DPA-714, a newly proposed marker for glioma detection with rapid blood–brain barrier penetration (10,12,13), was implemented and used for the assessment of treatment efficacy.
ErPC3 treatment induces a statistically significant reduction in the uptake of 18F-DPA-714 in tumors. ROI analysis of the PET images shows a significantly lower level of 18F-DPA-714 uptake within the tumor of drug-treated animals at day 8 (P = 0.002) after ErPC3 administration, compared with control animals. Accordingly, autoradiography and immunolabeling of brain sections show reduced 18F-DPA-714 binding and TSPO expression, respectively, within ErPC3-treated tumors (Figs. 4 and 6), consistent with the PET data from the same animals. Likewise, TUNEL-positive areas demonstrate a decrease in TSPO signal, suggesting downregulation or degradation of TSPO in response to ErPC3 treatment. In contrast, tumor volumes are not significantly reduced in ErP3-treated groups, compared with controls. Moreover, they are in a range most likely influenced by partial-volume effects, and thus no discrimination is feasible if the decrease in 18F-DPA-714 uptake is due to a reduction in tumor volume or TSPO density. However, 18F-DPA-714 binding studies and immunohistochemistry strongly support the idea of reduced TSPO tumor density after ErPC3 treatment. These results demonstrate the capacity of 18F-DPA-714 as a surrogate marker for quantification of the pharmacologic activity of ErPC3 and support previous results showing that the antitumoral activity of ErPC/ErPC3s requires the expression of TSPO (15,24). It is important to note that Western blot results demonstrated high TSPO levels in the rodent glioma cell line 9L and C6, whereas TSPO expression was undetectable in murine GL261 glioma cells. Although high levels of TSPO density have been extensively reported in malignant brain tumors and successfully correlated to tumor proliferation and grade, one should also consider the existence of TSPO-negative gliomas (37).
The differences observed between the treated and untreated groups relate to the higher degree of infiltration of CD11b-positive immune cells and GFAP-positive astrocytes in the tumors of ErPC3-treated animals with respect to control tumors (Fig. 6). The pattern of distribution of astrocytes and microglia/macrophages is highly evocative of migration of these cells to the tumor core, suggesting that inflammatory cells and astrocytes infiltrate the tumor region in response to ErPC3 treatment and tumor cell death.
The knockdown of TSPO in rat C6 glioma cells reduces significantly the induction of apoptosis and the activation of caspase-3 after treatment with ErPC3 (24). These observations have led to the hypothesis that there is a direct interaction between ErPC3 and TSPO, and our observation of a downregulation of TSPO expression after ErPC3 is in favor of this hypothesis. Furthermore, TSPO has been closely associated with the mitochondrial permeability transition pore. In fact, using cyclosporine A, recent reports have described the blockage of the mitochondrial permeability transition pore complex countering ErPC3-induced apoptosis and decreasing tumor-infiltrating microglia/macrophages (15,23,38). Therefore, interaction between ErPC3 and TSPO leading to the attraction of inflammatory cells is a plausible mechanism. However, whether TSPO is directly implicated in attracting microglia/macrophages and reactive astrocytes into the tumor remains the subject of further investigations.
The infiltration of TSPO-positive microglia/macrophages and reactive astrocytes into the tumor core suggests that the tumor microenvironment was significantly modified by ErPC3 treatment. It remains to be determined whether ErPC3 can elicit an apoptotic effect in these tumor stroma cell populations. However, it has been demonstrated that the toxicity of ErPC3 is selectively greater toward cancer cells than toward human or mouse bone marrow cells (21) and that ErPC3 could stimulate innate immunity by inducing human cord blood cells to form granulocytes/macrophage colonies (39).
Finally, a statistically significant loss in body weight was observed in the ErPC3-treated animals (P < 0.001). Systemic toxicity associated with ErPC3 has been reported in nude mice (20), with intraperitoneal administration leading to a transient, tolerable (less than 10%) weight loss after 14 d of treatment with 40 mg/kg of ErPC3, a dose similar to the one used in the present study. Another study (19) on the biodistribution of the congener drug ErPC in rats reported a decline in body weight after intravenous injection of the maximum-tolerated dose of 40 mg/kg. It is important to note that the above-mentioned studies were performed in healthy animals, whereas the present study was conducted in tumor-bearing, hence more fragile, animals. In any case, differences remained statistically significant after normalization by body weight, independently of the administration route (P < 0.05 for intraperitoneal, P < 0.01 for intravenous).
CONCLUSION
PET imaging of TSPO expression using 18F-DPA-714 allows effective monitoring and quantification of disease progression and response to ErPC3 therapy in intracranial 9L gliomas. The decrease in TSPO expression is positively correlated to treatment response, extensive cell death, and infiltration by macrophage/microglia and astrocytes after ErPC3 therapy. This first, to our knowledge, in vivo demonstration of the antitumor activity of ErPC3 calls for further exploration of alkylphosphocholines as therapeutic agents in glioma.
DISCLOSURE
The costs of publication of this article were defrayed in part by the payment of page charges. Therefore, and solely to indicate this fact, this article is hereby marked “advertisement” in accordance with 18 USC section 1734. This research was funded by the European Union's Sixth and Seventh Framework Programme under grant agreement LSHB-CT-2005-512146 (DiMI), LSHC-CT-2004-503569 (EMIL), HEALTH-F2-2011-278850 (INMiND), the Joint INCa/DAAD Translational Research Program on Cancer (08-006), and a PhD Scholarship of the Ecole Doctorale 436 Université Paris-Descartes. No other potential conflict of interest relevant to this article was reported.
Acknowledgments
We are grateful to Dr. Makoto Higuchi for kindly providing the anti-TSPO antibody NP155 and to Genzyme for providing Erufosine.
Footnotes
Published online Nov. 8, 2013.
- © 2013 by the Society of Nuclear Medicine and Molecular Imaging, Inc.
REFERENCES
- Received for publication December 20, 2012.
- Accepted for publication July 9, 2013.


