


Abstract
The κ-opioid receptors (KOR) are involved in mood disorders and addictive conditions. In vivo imaging studies of this receptor in humans have not been reported because of the lack of a selective ligand. We used a recently developed selective KOR agonist tracer, 11C-GR103545, and performed a study in rhesus monkeys to estimate the in vivo receptor concentration (Bmax) and dissociation equilibrium constant (Kd). Methods: Four rhesus monkeys underwent 12 scans with 11C-GR103545 on a PET scanner under baseline and self-blocking conditions. The injected mass was 0.042 ± 0.014 μg/kg for the baseline scans and ranged from 0.16 to 0.3 μg/kg for the self-blocking scans. The radiotracer was administered in a bolus-plus-infusion protocol, and cerebellum was used as the reference region in kinetic analysis. Binding potential (BPND) values were computed as [(CROI/CREF) − 1], where CROI and CREF are the mean of the radioactivity concentrations from 90 to 120 min after tracer administration in a given region of interest (ROI) and in the cerebellum. In 6 scans, arterial input functions and free fraction in plasma (fp) were measured. In addition, a 2-tissue-compartment model was used to compute the volume of distribution in the cerebellum (VT_REF), which was then used to estimate the free–to–nondisplaceable concentration ratio (fND) as fp/VT_REF. A Scatchard plot was used to estimate Bmax, and KdND = Kd/fND, the Kd value with respect to the cerebellar concentration. Individual data were first analyzed separately and then pooled together. When KdND was allowed to vary among ROIs, results were variable; therefore, KdND was constrained to be constant across ROIs, whereas Bmax was allowed to be ROI-dependent and animal-dependent. Results: A global estimate of 1.72 nM was obtained for KdND. Estimated Bmax ranged from 0.3 to 6.1 nM across ROIs and animals. The Kd estimate of 0.048 nM, obtained by correcting KdND by the factor fND, was in good agreement with the half maximal inhibitory concentration (IC50) of 0.018 nM determined from functional assays in rabbit vas deferens and inhibition constant (Ki) of 0.02 nM measured in radioligand competition assays using cloned human receptors. On the basis of these data, a suitable tracer dose of 0.02 μg/kg was selected for use in humans. Conclusion: The use of a bolus-plus-infusion protocol with the KOR agonist tracer 11C-GR103545 permitted the successful estimation of Bmax and KdND in vivo. On the basis of the estimated Kd value, a tracer dose of 1.4 μg (3.38 nmol) for an average body weight of 70 kg was chosen as the mass dose limit in human studies using this novel agonist radiotracer.
Opioid receptors (ORs) belong to the superfamily of G-protein–coupled receptors and are subdivided into 4 classes: δ (DOR), κ (KOR), μ (MOR), and the recently discovered nociceptin receptors. The KOR, the most abundant brain OR in humans, is strongly related to substance abuse (cocaine, heroin, alcohol, opiate drugs); therefore, KOR-targeted drugs have been investigated for the treatment of addictions (1). Evidence suggests that dynorphin, the endogenous neurotransmitter that binds to the KOR, is involved in the body’s natural addiction control mechanism (1). In addition, KORs are implicated in other brain disorders, including epilepsy (2,3) and Alzheimer disease (4), and have recently been shown to play a role in the modulation of the cardiovascular system.
Several compounds labeled with positron emitters have been used in vivo to study the ORs (5). For example, the MOR-selective ligand 11C-carfentanil (6) and the less selective opioid ligand 18F-cyclofoxy (7) have been used in humans with PET.
Only recently, the highly selective KOR ligand (±)-methyl 4-(2-(3,4-dichlorophenyl)acetyl)-3-(1-pyrrolidinylmethyl)piperazine-1-carboxylate, known as GR89696, was labeled with 11C and evaluated in mice (8). The (−)-isomer of the racemic GR89696 (GR103545) is more potent and was also labeled and studied (9). GR103545 is a KOR agonist with in vitro inhibition constant (Ki) for the KOR of 0.02 ± 0.01 nM and excellent selectivity over MOR (6 × 10²-fold) and DOR (2 × 10⁴-fold) (10). The half maximal inhibitory concentration (IC50) of GR103545 for the KOR, measured in functional assays using rabbit vas deferens, was reported to be 0.018 nM (0.04 and 6.0 nM, respectively, for the racemic mixture GR89696 and the less potent (+)-enantiomer) (11). In mice, the uptake of the active isomer 11C-GR103545 correlated well with the known distribution of KOR, whereas the (+)-isomer 11C-(+)-GR89696 showed a homogeneous brain uptake (9). A PET study in baboons with 11C-GR89696, 11C-GR103545, and 11C-(+)-GR89696 showed that 11C-GR103545 is a promising radioligand for imaging KOR, with a moderate rate of peripheral metabolism, a relatively high free fraction, and high specific binding signals (12).
This paper describes a study with 11C-GR103545 in rhesus monkeys to estimate in vivo the regional KOR concentration (Bmax) and the dissociation equilibrium constant (Kd). Although these values are of general interest for all PET ligands, they are of higher importance for 11C-GR103545 because knowledge of Kd and receptor occupancy level associated with side effects are critical to minimize the manifestation of adverse events, especially in human studies, due to the agonist nature of this tracer (12).
Two aspects of this work differentiate it from many other studies to measure Bmax and Kd (13). First, this study was performed with a bolus plus a constant infusion of the radiotracer, an approach normally used to produce equilibrium in all brain regions. However, here, it was expected from simulations based on bolus data that equilibrium could not be reached in all regions within the time frame of the study limited by 11C decay, and the goal was therefore to achieve equilibrium in the reference region (14). Second, it is conventional to occupy a large fraction of the receptors to estimate Bmax and Kd with low error. However, because of the agonist nature of GR103545, only a moderate level of occupancy was attempted, which was necessary to minimize side effects.
MATERIALS AND METHODS
Radiochemistry
High-specific-activity (SA) 11C-GR103545 was synthesized as described in Nabulsi et al. (15).
PET Imaging Experiments
Imaging Protocol
Twelve PET experiments were performed in 4 rhesus monkeys (2 male and 2 female; mean weight ± SD, 7.9 ± 2.5 kg). Two monkeys (A and B) underwent 2 scanning sessions, each consisting of a high-SA injection (baseline scan) in the morning, followed by a low-SA injection (self-blocking scan) in the afternoon, for a total of 4 scans each. Two monkeys (C and D) were scanned twice, once at baseline and once under the self-blocking condition. The mass range of GR103545 was 0.02–0.05 μg/kg for the baseline scans and 0.16–0.30 μg/kg for the self-blocking scans. On the basis of results in baboons (n = 12), no more than a 0.3 μg/kg dose of GR103545 was administered, in order to minimize side effects. The injected activity dose was 113 ± 78 MBq, and the specific activity at time of injection was 98 ± 45 MBq/nmol. A summary of the scan parameters is provided in Table 1.
Summary of Scan Parameters
PET experiments were performed according to a protocol approved by the Yale University Institutional Animal Care and Use Committee. Animals were sedated with a 10 mg/kg intramuscular dose of ketamine at least 2 h before the first radiotracer injection. Once sedation was obtained, endotracheal intubation was performed and the animals were placed on isoflurane (1.5%–3%). Once stable, the animals were moved into the scanner, and a pressurized infusion set was connected to the animal’s indwelling arterial access port for blood pressure monitoring and arterial blood sampling. Vital signs were monitored throughout PET scanning.
PET scans were acquired on a Focus 220 scanner (Siemens Medical System). For each experiment, a transmission scan was obtained before tracer injection, followed by a 120-min emission scan initiated at the start of tracer administration. After correction for attenuation, dead time, randoms, and scatters, list-mode data were reformatted into 33 frames and reconstructed with the Fourier-rebinning algorithm, followed by 2-dimensional filtered backprojection.
A bolus-plus-infusion protocol (16) was used for tracer administration with the goal of reaching equilibrium. The parameter Kbol, the ratio of bolus dose volume (mL) to infusion rate (mL/min), was set to 200 min for the baseline scans. In the self-blocking scans, Kbol was initially set to 150 min, and subsequently to 100 min, to decrease the relative contribution of the bolus component to reduce the peak concentration of GR103545. The value of Kbol was set higher for the baseline scans, for which binding levels are higher, to approach equilibrium more quickly.
The bolus component was administered over a time equal to Tbol, set to 2–5 min for the first scans, and increased to 15 min in later scans to reduce the peak concentration of GR103545. Thus, the bolus fraction of the total dose of 11C-GR103545 was Kbol/(Kbol + T), with T equaling 120 min, indicating the duration of the scan. The remaining portion of T/(Kbol + T) was infused at a constant rate. The values of Tbol and Kbol for each scan are reported in Table 1.
Plasma Input Function, Free Fraction, and Metabolite Measurements
Arterial blood samples were collected to determine the metabolite-corrected plasma input function in 6 of 12 scans (in animals A and D). In these scans, 20 blood samples were drawn and plasma radioactivity concentration was measured with a γ-counter (Wizard2; PerkinElmer). The tail portion of the total plasma concentration curve was fitted to a 3-exponential function. The free fraction in plasma (fp) was measured by ultrafiltration of a reference blood sample (to which was added a small amount of the radiotracer) taken before tracer injection. In addition, selected samples were analyzed to assess the unchanged parent fraction with high-performance liquid chromatography analysis. The parent fraction was calculated as the ratio of the sum of radioactivity in fractions containing the parent tracer to the total amount of radioactivity collected and was fitted to an integrated γ-function. This curve was also corrected for the time-varying extraction efficiency of radioactivity in acetonitrile and normalized to the extraction efficiency determined from the reference plasma sample. The final plasma input function was calculated as the product of the fitted total plasma curve, fitted high-performance liquid chromatography fraction curve, and fitted acetonitrile extraction curve.
Data Analysis
To define regions of interest (ROIs) in each scan, 2 summed PET images (0–10 and 10–30 min) were registered to the MR image of each animal (6-parameter affine registration) by maximizing the normalized mutual information of the images, and the registration that produced the higher normalized mutual information was chosen. Through a nonlinear transformation, the individual MR image was registered to a rhesus monkey brain template MR image on which ROIs had already been defined. By combining the 2 registrations, a PET-to-template transformation was obtained; ROIs were then transferred to the original PET space, and time–activity curves were computed. The ROIs were cerebellum, amygdala, caudate, cingulate and frontal cortex, globus pallidus, hippocampus, insula, occipital cortex, putamen, temporal cortex, and thalamus.
The cerebellum was used as the reference region (12), and values of binding potential (BPND) (17) were estimated using both equilibrium analysis (EA) and the simplified reference tissue model (SRTM). For EA, it was assumed that equilibrium was reached between 90 and 120 min, and BPND_EA was computed using the standard expression
Where arterial input function data were available, the distribution volume (VT) was estimated using the 2-tissue (2T)-compartment model, and BPND was computed as [(VT_ROI − VT_REF)/VT_REF] (VT_REF is the volume of distribution in the cerebellum). These values of BPND were compared with those derived from the EA and the SRTM methods.
For each pair of baseline and self-blocking scans obtained on the same day, the percentage occupancy of KOR due to GR103545 itself (RO%) was estimated with both EA and SRTM methods for each ROI as
To estimate Bmax and KdND, instead of using the linear Scatchard equation (18)
Bmax and KdND were also estimated with Equation 5, using the same CREF as in Equation 4 but with BPND values derived from SRTM. Whereas Equations 3 and 4 require equilibrium in both the reference region and target ROIs, Equation 5 is based only on the assumption of the reference region at equilibrium if SRTM properly extrapolates the equilibrium BPND value.
Five data-analysis approaches were used: 2 applied to each individual animal and 3 pooling across animals. Initially, individual estimates of Bmax and KdND for each animal and ROI were computed (individual analysis 1 [IND1]); KdND was then constrained to be constant across ROIs, obtaining, for each animal, 1 value of Bmax for every ROI and 1 global value of KdND (IND2). Subsequently, all data were analyzed simultaneously and estimates of Bmax and KdND were obtained for each ROI (pooled analysis 1 [POOL1]). KdND was then constrained to be constant across ROIs by computing 1 Bmax per ROI and 1 global value for KdND (POOL2). In the POOL3 approach, Bmax was allowed to vary for each ROI and animal, whereas KdND was again constrained to be constant.
In addition, in the 6 scans for which arterial measurements were available, a 2T-compartment model was used with the metabolite-corrected input function to fit the time–activity curves with a weighted-least-squares procedure in order to estimate the VT in all ROIs. The VT_REF was used as an estimate of the VND, and fND was computed for each scan as fp/VND. The final estimate of Kd was obtained as KdND × fND.
RESULTS
Radiochemistry
The previous method for the preparation of 11C-GR103545 was a multiple-step, low-yielding procedure that gave rise to a product with low and variable radiochemical yield and low specific activity (8,9,12). Therefore, a new radiosynthetic method was developed in our laboratory to produce 11C-GR103545 in high radiochemical yield and specific activity (15). 11C-GR103545 used in this study was prepared with the new radiosynthetic method.
Administration of Blocking Doses of GR103545
No changes in the vital signs were observed in any of the baseline scans with 11C-GR103545. In the self-blocking scans, reductions in heart rate (range, 10%–20%) and respiratory rate (range, 10%–16%) were seen, and recovery from anesthesia was slower than typical.
Calculation of BPND and Receptor Occupancy
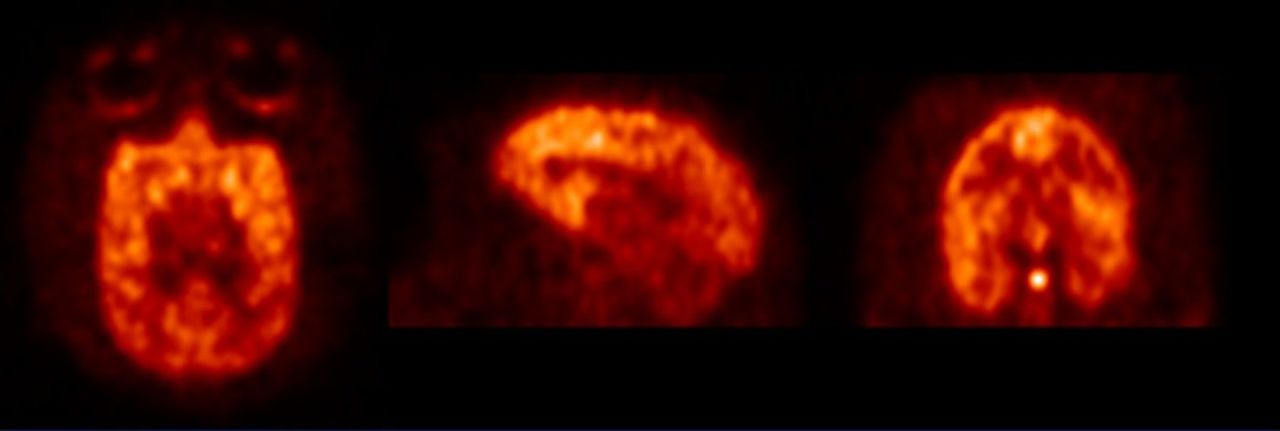
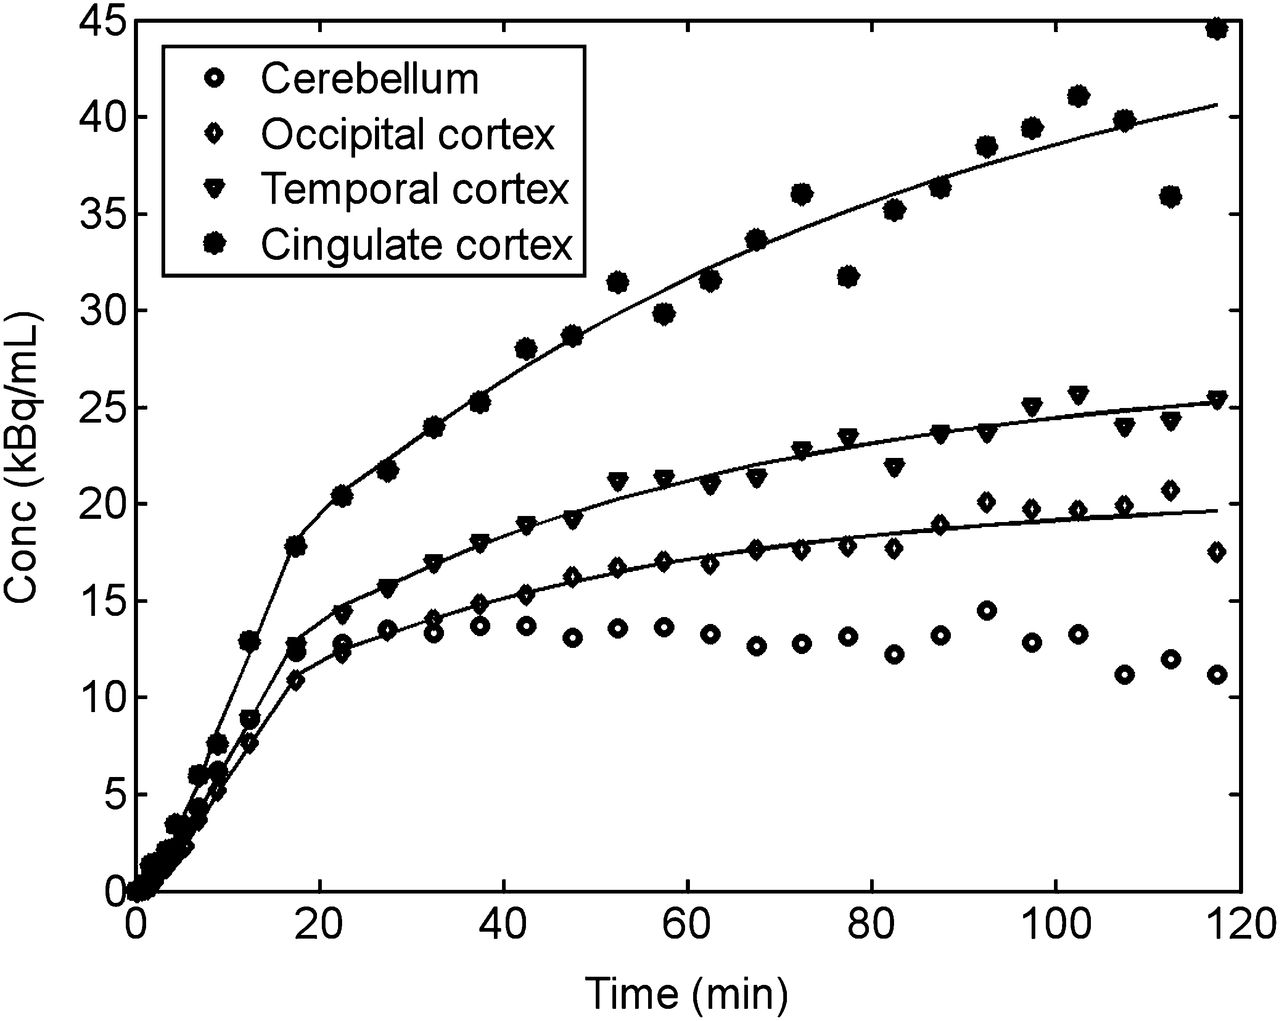
Figure 1 displays axial, sagittal, and coronal views of the uptake of 11C-GR103545 at 60–90 min after injection for an image of a baseline scan. Images were postsmoothed with a 3-dimensional gaussian filter with a full width at half maximum of 3 pixels. Figure 2 shows sample time–activity curves for the cerebellum and ROIs with low, medium, and high uptake (occipital, temporal, and cingulate cortex, respectively), from a typical baseline scan with the corresponding SRTM fits. The pattern in Figure 2 was typical, because equilibrium was generally reached in the cerebellum but not in the ROIs with higher uptake. Tables 2 and 3 list the mean percentage increase ± SD in the time–activity curve between 90 and 120 min for each ROI along with the mean binding potentials from EA and SRTM analysis (Table 2, mean across baseline scans, n = 6; Table 3, mean across blocking scans, n = 6). In 13 of 132 fits, BPND_SRTM values were considered outliers (defined as BPND_SRTM > 3); thus, these values were set to 3.

Axial, sagittal, and coronal (left, middle, and right, respectively) images showing uptake of 11C-GR103545 at 60–90 min after injection during a baseline scan.

Selected time–activity curves from a typical 11C-GR103545 baseline scan with corresponding SRTM fits.
Mean ± SD Across Baseline Scans (n = 6) of Percentage Increase of ROI Time–Activity Curves Between 90 and 120 Minutes* and BPND Values Calculated from EA (BPND_EA) and SRTM (BPND_SRTM) Analyses†
Mean ± SD Across Blocking Scans (n = 6) of Percentage Increase of ROI Time–Activity Curves Between 90 and 120 Minutes and BPND Values Calculated from EA (BPND_EA) and SRTM (BPND_SRTM) Analysis
SRTM fits were in general of good quality. The mean ± SD across scans and ROIs of R1, the ratio of the influx rate K1 between the target region and the cerebellum, and
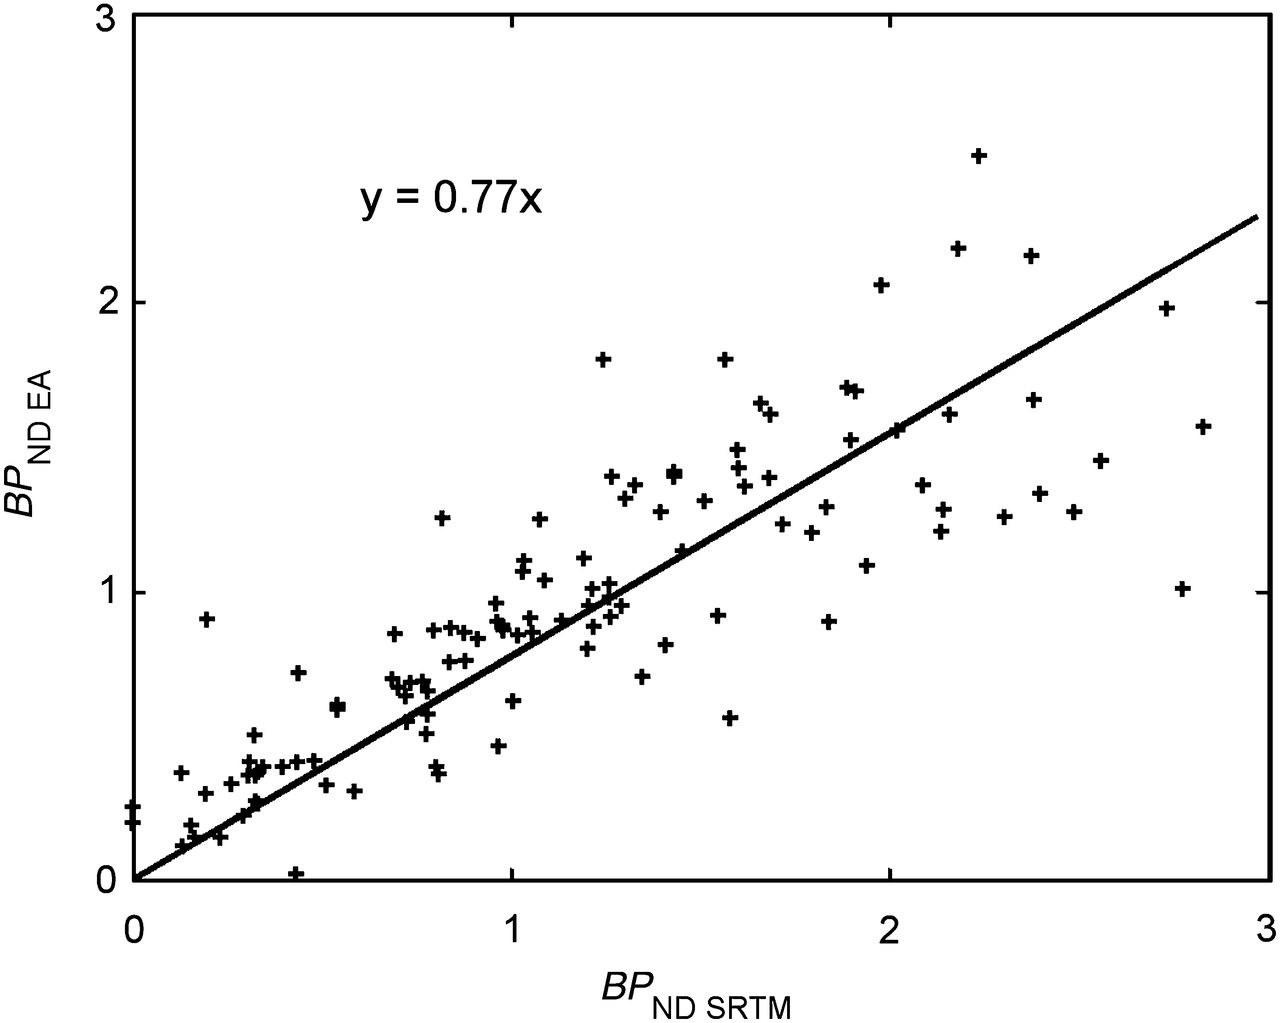
Relationship between BPND_SRTM (x-axis) and BPND_EA (y-axis). Correlation was good (r = 0.84) with line of regression of y = 0.77x (intercept was set to 0). Thus, in this study, EA underestimated BPND.
For the studies for which arterial data were available, BPND_EA and BPND_SRTM correlated well with BPND_2T (binding potential computed from the 2T compartmental model; r = 0.81 and 0.70, respectively) but systematically underestimated the BPND_2T values; the equations of the fitted lines, with intercept set to 0, were y = 0.49x for BPND_EA and y = 0.79x for BPND_SRTM, with x denoting BPND_2T. The underestimation of BPND_SRTM is likely due to the fact that the 1-tissue-compartment model does not adequately describe the cerebellum time–activity curves (data not shown).
The RO% values, as expected, were low because of the mass limit of 0.3 μg/kg for GR103545, with the highest RO% among all scans, averaged over ROIs after the exclusion of outliers, equal to 25% for EA and 29% for SRTM analysis.
Calculation of Bmax and Kdnd
The estimates of Bmax and KdND obtained using BPND_SRTM and Equation 5 were often unreliable (i.e., either extremely high or zero) or characterized by large standard errors; therefore, only estimates obtained from Equation 4 are presented in subsequent analyses.
When individual data were analyzed independently (IND1), the quality of fit in the Scatchard plots and of Bmax and KdND estimates was highly variable. Not surprisingly, results were dependent on baseline BPND: ROIs with high baseline BPND gave the best results in terms of physiologic plausibility of the estimates and of percentage SE ([%SE]; range, 10%–30%). Poorer estimates were obtained in low-binding ROIs because of the low level of receptor occupancy in this study. Some improvements were obtained when, for a given animal, KdND was constrained to be constant across ROIs (IND2). In this case, the estimates of KdND for the 2 animals with 4 scans each were similar (1.51 and 1.99 nM for animals A and B, respectively), and %SE values were low (34% and 23%, respectively). However, for the 2 animals with only 2 scans each, KdND estimates were poorer.
When data were pooled, Bmax and KdND estimates substantially improved in terms of physiologic plausibility—that is, no negative values and no unreasonably high values—and %SE improved as well, when 1 scan (the blocking scan of animal D) was excluded. That scan was anomalous, in that—although a high mass dose of 0.22 μg/kg was administered—a 0% mean receptor occupancy was obtained with EA. Considered an outlier, data from that scan were excluded from the pooled analysis.
In the pooled analyses, when both Bmax and KdND were allowed to be ROI-dependent but constant across animals (POOL1), reasonable results were obtained in all ROIs except the thalamus. Excluding the thalamus, which has a low baseline BPND, KdND was in the range of 0.7–8.2 nM (mean, 3.05 nM; median, 1.75 nM; SD, 75%) and Bmax in the range of 0.35–13.7 nM (mean, 3.76 nM; median, 2.06 nM) with large %SE (range, 50%–200% for both Bmax and KdND). When KdND was constrained to be constant across animals (POOL2), estimates were in good agreement with those from POOL1 (global KdND, 2.54 nM; Bmax, in the range of 0.8–4.9 nM, with the mean and median of 2.64 and 2.54 nM, respectively) but with much lower %SE (41% for KdND; range, 30%–40% for Bmax). Figure 4 shows examples of typical fits (caudate and putamen) for individual analysis (IND1) and for a pooled analysis (POOL1). For the putamen (Fig. 4B), the slopes of the individual fitted lines are similar whereas the (extrapolated) intercepts on the x-axis (Bmax) are different, suggesting the need for a constant KdND and different Bmax values for the different animals. When KdND was constrained to a common value while allowing Bmax to be ROI- and animal-dependent (POOL3), the global estimate of KdND (1.72 nM) was in good agreement with the 2 individual KdND values reported above (1.51 and 1.99 nM) and with the median value from POOL1 (1.75 nM) and in reasonable agreement with the global value from POOL2 (2.54 nM). In addition, %SE of KdND in POOL3 was 17%, much lower than the 41% in POOL2.

Examples of typical Scatchard plots for selected ROIs (caudate, left; putamen, right) based on individual and pooled analyses. Different symbols were used for each animal. Continuous and dashed lines represent global fitted line and fits of individual data, obtained with POOL1 and IND1, respectively.
Furthermore, standard statistical tests (Akaike information criterion and Schwarz criterion) selected method POOL3 as better than POOL2 and POOL1. The F test performed between POOL2 and POOL3 also selected POOL3 as the better approach (P < 10−4).
The values of Bmax estimated from POOL3 are reported in Table 4. In addition, the table lists the corresponding predicted BPND for each ROI computed as the ratio of the Bmax of the ROI to the global KdND of 1.72 nM.
Mean ± SD of Bmax Estimates Across Animals, Obtained from Pooled Analysis (POOL3) and Corresponding BPND Estimates, Computed as Ratio of Bmax to Global KdND of 1.72 nM
Figure 5 illustrates the relationship between in vitro and in vivo Bmax estimates, with the dashed and continuous lines representing the identity and fitted line y = mx, respectively (m is the slope of the fitted line). The in vitro estimates, as reported in the study of Slater and Cross (19), were computed from sections of monkey brain (Macaque fascicularis) with the autoradiographic method and the radioligand 3H-dynorphin. The correlation between these 2 sets of estimates was reasonable (r = 0.39), although the in vivo estimates were substantially lower than the in vitro values (slope = 0.20).

Relationship between in vitro and in vivo Bmax estimates: continuous and dashed lines represent, respectively, fitted line (y = 0.20x) and line of identity (y = x). ROIs for which both estimates were available are caudate, cingulate cortex, globus pallidus, insula, putamen, and thalamus.
Using the 2T compartmental model, estimates for the VT_REF were 8.6 ± 0.87 mL⋅cm−3 for animal B (n = 4 scans) and 14.7 ± 0.91 mL⋅cm−3 for animal D (n = 2 scans); fP values were 0.26 ± 0.01 and 0.39 ± 0.02 for animals B and D, respectively, and consistent with the expected increase in VT with increasing fP. Estimates of fND were quite similar across the 6 scans (0.028 ± 0.004). The mean value of fND was used to estimate Kd from Kd = KdND × fND = 1.72 × 0.028 = 0.048 nM. This value was in good agreement with the IC50 of 0.018 nM measured with functional assays using rabbit vas deferens (11) and the in vitro Ki value of 0.02 nM determined by radioligand competition assays using cloned human KOR (10).
DISCUSSION
GR103545 is a ligand with a high selectivity for KOR, and reports in the literature demonstrated the potential of 11C-GR103545 for PET imaging in the nonhuman primate brain (10,12). In the present study, 11C-GR103545 was used to estimate the in vivo regional KOR concentration (Bmax) and the dissociation equilibrium constant (Kd) using a bolus-plus-infusion tracer administration protocol. Regional BPND values were derived using both EA and SRTM methods. Estimates of BPND_EA and BPND_SRTM were well correlated, with BPND_EA consistently lower than BPND_SRTM because of the increasing trend of tracer uptake in most ROIs in the 90- to 120-min time window. The lack of simultaneous equilibrium in all ROIs was expected, because preliminary simulations showed that the range of 11C-GR103545 kinetics in rhesus monkeys was too wide for equilibrium to be achieved in all ROIs within the same time window. For values of Kbol such that equilibrium was reached in the reference region, equilibrium was not reached in the high-binding regions, which had an increasing trend in the last frames of the PET scan. For higher values of Kbol such that equilibrium was achieved in the high-binding regions, equilibrium was not reached in the reference region, which showed a decreasing trend.
The EA method provided estimates of KdND and Bmax that were more reliable than those derived from SRTM. The quality of fit in the Scatchard plots was variable, with the ROIs with high BPND yielding the best results. The reason for this sometimes unsatisfactory fit quality was the limit on the injected mass (0.3 μg/kg): higher masses were not administered, because they were not expected to be well tolerated by the animals. As a consequence, RO% values were low, with the highest mean RO% among all scans equal to 25% for EA and 29% for SRTM. Our data were therefore all located in the first portion of the Scatchard plots, which produced larger errors than would have been found if a wider range of occupancies could have been achieved.
Several analysis methods were applied to these data. In the best approach (POOL3) to derive global estimates of KdND and Bmax, KdND was constrained to a common global value whereas Bmax was allowed to be ROI- and animal-dependent. A global estimate of 1.72 nM was obtained for KdND, with Bmax ranging from 0.3 to 6.1 nM depending on the ROI and animal. The subsequent Kd estimate of 0.048 nM, obtained by correcting KdND by fND, was in good agreement with the inhibitory concentration of 50% or Ki value measured in vitro. As for Bmax, there was a good correlation between the in vivo and in vitro estimates, although the in vivo values were substantially lower (roughly 20% of the in vitro estimates). This underestimation is partly a consequence of the underestimation of BPND and B′ by the EA method. It can be shown that under the hypothesis of BPND underestimation by a factor independent of its true value (BPND_TRUE = k × BPND_EA, k > 1), Bmax values from the Scatchard plot are underestimated by the same factor k, whereas KdNDEA = KdNDTRUE. In addition, the in vitro values were estimated with audioradiography using 3H-dynorphin (19): although all dynorphins primarily exert their effects on the KOR, these peptides have some affinity for DOR, MOR, and NMDA-type glutamate receptor as well (20), possibly causing the estimated Bmax values to be positively biased. Another factor that might contribute to the underestimation of in vivo Bmax is the effect of the anesthetic agents ketamine and isoflurane. Ketamine appears to bind to ORs (21), even though its KOR-modulated (agonist) effect on behavior in rats was detectable only at a high dose (20 mg/kg, intraperitoneally) and shortly (10 min) after dosing (21,22). In our study, ketamine was used only at the beginning of the experiment to immobilize the animals, and isoflurane was used thereafter to maintain anesthesia. By the time of the blocking scan, it was generally 6–7 h after ketamine administration, or approximately 3 plasma half-lives (∼2 h for intramuscular dosing). Therefore, it seems unlikely that ketamine would occupy the KOR and cause an underestimation of Bmax, although this possibility cannot be completely ruled out because of the lack of in vivo studies to assess KOR occupancy by ketamine at the dose used in our study. As for the effect of isoflurane, there have been conflicting reports on its interaction with the ORs in general and KOR in particular. However, the overwhelming evidence appears to indicate it as a nonspecific anesthetic agent, as opposed to having a specific effect on KOR (or other ORs). Hence, given the factors cited here, our hypothesis is that the true values of regional Bmax are higher than those reported in this study and lower than those obtained from autoradiography studies (19).
GR103545 is a potent KOR agonist, and a low injected mass is critical to limit the pharmacologic effect of the ligand, especially in applications in humans. Even with the limit of 0.3 μg/kg, there were evident side effects, including reduction in heart and respiratory rates and increased postscan recovery time. We have developed a new radiosynthetic method (15) that provides 11C-GR103545 with specific activity 7 times higher on average than the previous radiosynthetic method (12). Thus, for human scans, this new method will permit a substantial reduction in the injected mass of GR103545 while maintaining an acceptable radioactivity level of 11C-GR103545, essential for the quality of PET images.
Data from the present study permit the estimation of an appropriate mass dose for human studies to maintain trace dose levels. For this calculation, the cerebellum bolus-plus-infusion time–activity curves were converted from Bq/mL to nM using the SA of the radiotracer for each scan. These bolus-plus-infusion time–activity curves were then mathematically converted to what would have been obtained from a bolus injection, given knowledge of the infusion protocol used, specifically Kbol. The time–activity curves were then normalized by dividing by the injected dose of GR103545 per body weight (μg/kg) and averaging across animals, and a predicted mass concentration in the cerebellum (CCER) could then be obtained by multiplying the resulting curve by a selected injected mass (μg/kg).
Receptor occupancy was then calculated as
On the basis of these computations, a dose of 0.02 μg/kg was selected as appropriate in human studies. With the current specific activity of 11C-GR103545 obtained from our new radiosynthetic method, this mass dose should allow the injection of 11C-GR103545 in radioactivity doses sufficient to provide PET images of acceptable statistical quality. For example, assuming an average body weight of 70 kg for a human subject, this mass dose limit will allow the injection of 1.4 μg, or 3.38 nmol of mass, translating into 406 MBq (11 mCi) of radioactivity dose based on the average specific activity (120 MBq/nmol) at the time of injection in the baseline scans.
CONCLUSION
We have successfully used the KOR agonist 11C-GR103545 to estimate the tracer’s in vivo Kd and regional KOR Bmax in rhesus monkeys. The in vivo Kd estimate allows the selection of an appropriate tracer mass dose limit, which is important in order to optimize the imaging quality while minimizing the potential side effect of this agonist radiotracer in human studies. In our ongoing PET studies in humans, the limit of 0.02 μg/kg derived from this study is being used to obtain acceptable images without causing any observable physiologic effects, thus validating the result that this mass dose fulfills the tracer dose requirement.
DISCLOSURE
The costs of publication of this article were defrayed in part by the payment of page charges. Therefore, and solely to indicate this fact, this article is hereby marked “advertisement” in accordance with 18 USC section 1734. This study was funded by the Yale-Pfizer Bioimaging Alliance. This publication was also made possible by CTSA grant UL1 RR024139 from the National Center for Research Resources (NCRR) and the National Center for Advancing Translational Science (NCATS), components of the National Institutes of Health (NIH). Its contents are solely the responsibility of the authors and do not necessarily represent the official view of NIH. No other potential conflict of interest relevant to this article was reported.
Acknowledgments
We acknowledge the staff at the Yale PET Center, especially Krista Fowles and the NHP team.
Footnotes
Published online Feb. 19, 2013.
- © 2013 by the Society of Nuclear Medicine and Molecular Imaging, Inc.
REFERENCES
- Received for publication August 14, 2012.
- Accepted for publication November 5, 2012.


Jump to section
Related Articles
Cited By...
- Mapping Kappa Opioid Receptor Binding in Titi Monkeys with 11C-GR103545 PET
- Development and In Vivo Evaluation of a {kappa}-Opioid Receptor Agonist as a PET Radiotracer with Superior Imaging Characteristics
- Novel 18F-Labeled {kappa}-Opioid Receptor Antagonist as PET Radiotracer: Synthesis and In Vivo Evaluation of 18F-LY2459989 in Nonhuman Primates
- Test-Retest Reproducibility of Binding Parameters in Humans with 11C-LY2795050, an Antagonist PET Radiotracer for the {kappa} Opioid Receptor
- An Improved Antagonist Radiotracer for the {kappa}-Opioid Receptor: Synthesis and Characterization of 11C-LY2459989