


Abstract
11C-LY2795050 is a new antagonist PET radioligand for the κ opioid receptor (KOR). In this study, we assessed the reproducibility of the binding parameters of 11C-LY2795050 in healthy human subjects. Methods: Sixteen healthy subjects (11 men and 5 women) underwent 2 separate 90-min PET scans with arterial input function and plasma free fraction (fP) measurements. The 2-tissue-compartment model and multilinear analysis-1 were applied to calculate 5 outcome measures in 14 brain regions: distribution volume (VT), VT normalized by fP (VT/fP), and 3 binding potentials (nondisplaceable binding potential, binding potential relative to total plasma concentration, and binding potential relative to free plasma concentration: BPND, BPP, BPF, respectively). Since KOR is distributed ubiquitously throughout the brain, there are no suitable reference regions. We used a fixed fraction of individual cerebellar VT value (VT,CER) as the nondisplaceable VT (VND) (VND = VT,CER/1.17). The relative and absolute test–retest variability and intraclass correlation coefficient were evaluated for the outcome measures of 11C-LY2795050. Results: The test–retest variability of 11C-LY2795050 for VT was no more than 10% in any region and was 12% in the amygdala. For binding potential (BPND and BPP), the test–retest variability was good in regions of moderate and high KOR density (BPND > 0.4) and poor in regions of low density. Correction by fP (VT/fP or BPF) did not improve the test–retest performance. Conclusion: Our results suggest that quantification of 11C-LY2795050 imaging is reproducible and reliable in regions with moderate and high KOR density. Therefore, we conclude that this first antagonist radiotracer is highly useful for PET studies of KOR.
The κ opioid receptor (KOR) is 1 of at least 3 subtypes of opioid receptor. KOR is known to be involved in various disorders, including anxiety (1), substance abuse (2), major depression (3,4), epilepsy (5), and Alzheimer disease (6). Several lines of work provide support for KOR antagonists as potential therapeutic agents for depression (7) and alcohol dependence (8).
The PET radioligand 11C-LY2795050 is a recently developed antagonist radiotracer (9) that binds selectively to KOR. This new tracer has been examined in both nonhuman primates (10,11) and human subjects (12). Our previous analysis of human imaging data found that a 150-mg oral dose of naltrexone blocked approximately 90% of KORs across all brain regions, suggesting the absence of a suitable reference region for 11C-LY2795050 in the human brain and that the lowest intersubject variability in 3 versions of binding potential (nondisplaceable binding potential, binding potential relative to total plasma concentration, and binding potential relative to free plasma concentration: BPND, BPP, BPF, respectively) was observed when the nondisplaceable VT (VND) was estimated as a fixed fraction of cerebellar VT (VT,CER) (VND = VT,CER/1.17). The uptake pattern of 11C-LY2795050 agreed well with the known KOR distribution, and 11C-LY2795050 was confirmed to be suitable for imaging KOR in vivo. The primary aim of the present study was to assess the test–retest variability (TRV) of 11C-LY2795050 binding parameters derived from kinetic modeling in the human brain.
MATERIALS AND METHODS
Human Subjects
Sixteen healthy subjects (19–42 y old; 11 men and 5 women; body weight, 79 ± 11 kg) were enrolled in a test–retest study. The study was approved by the Yale University Human Investigation Committee and the Yale–New Haven Hospital Radiation Safety Committee and was in accordance with the federal guidelines and regulations of the United States for the protection of human research subjects contained in Title 45 part 46 of the Code of Federal Regulations. All subjects provided written informed consent. As part of the subject evaluation, MR images were acquired on all subjects to eliminate those with anatomic abnormalities and for PET image registration. MR imaging was performed using a 3-dimensional magnetization-prepared rapid gradient-echo pulse sequence with an echo time of 2.78 ms, repetition time of 2,500 ms, inversion time of 1,100 ms, and flip angle of 7 on a 3-T whole-body scanner (Trio; Siemens Medical Systems) with a circularly polarized head coil. The dimensions and pixel size of the MR images were 256 × 256 × 176 matrix and 0.98 × 0.98 × 1.0 mm3, respectively.
Radiotracer Synthesis
11C-LY2795050 was synthesized as previously described (9). The radiochemical purity of 11C-LY2795050 in the final product solution was more than 98%.
Test–Retest Study
Each subject underwent two 90-min PET scans with 11C-LY2795050 on the same day. The time difference between the 2 scans was 4.6 ± 1.1 h. The PET scans were acquired on a High Resolution Research Tomograph (HRRT) (Siemens Medical Solutions), which acquires 207 slices (1.2-mm slice separation) with a reconstructed image resolution of about 3 mm. Before tracer administration, a 6-min transmission scan was conducted for attenuation correction. Each scan was acquired in list mode after intravenous administration of 11C-LY2795050 over 1 min by an automatic pump (Harvard PHD 22/2000; Harvard Apparatus). Dynamic scan data were reconstructed in 27 frames (6 × 0.5 min, 3 × 1 min, 2 × 2 min, and 16 × 5 min) with correction for attenuation, normalization, scatter, randoms, and dead time using the MOLAR algorithm (motion-compensation ordered-subsets expectation maximization list-mode algorithm for resolution-recovery reconstruction) (13,14). Motion correction was included in the reconstruction algorithm based on measurements from the Polaris Vicra sensor (NDI Systems) with reflectors mounted on a swim cap worn by the subject. The metabolite-corrected arterial input function and the plasma free fraction (fP) were measured. The analysis procedures were previously reported (12).
Image Registration and Definition of Regions of Interest
Regions of interest were taken from the Automated Anatomic Labeling for SPM2 (15) in Montreal Neurologic Institute space (16). The template regions of interest were applied to the PET data. Details on the registration between MR and PET images were reported previously (12). Using the combined transformations from template-to-PET space, we generated time–activity curves for 14 regions of interest: amygdala, caudate, centrum semiovale, cerebellum, anterior cingulate cortex, posterior cingulate cortex, frontal cortex, globus pallidus, hippocampus, insula, occipital cortex, putamen, temporal cortex, and thalamus.
Quantitative Analysis
In our previous study (12), the 2-tissue-compartment (2TC) model and multilinear analysis-1 (MA1) method (17) were both deemed appropriate for analysis and quantification of 11C-LY2795050 binding parameters in the human brain. Hence, in this study we applied 2TC and MA1 (t* = 30 min) to the regional time–activity curves using the arterial plasma time–activity curve as input function. Five outcome measures were calculated: VT, VT normalized by fP (VT/fP), BPND, BPP, and BPF (18). VND is required for calculation of binding potential. In our previous analysis with a naltrexone-blocking study in humans, the lowest intersubject variability was observed when VND was estimated as VT,CER. We thus calculated VND from individual VT,CER to estimate binding potential. All modeling was performed with in-house programs written in IDL 8.0 (ITT Visual Information Solutions). For parameter estimation, data points were weighted on the basis of noise equivalent counts in each frame. Percentage SE was estimated from the theoretic parameter covariance matrix.
Statistical Analyses
The reproducibility of the outcome measures was assessed by computation of relative TRV, absolute TRV (aTRV), and intraclass correlation coefficient (ICC). TRV was calculated as follows: Mean TRV is an index of trends in the parameter of interest between the 2 scans, and the SD of TRV is an index of the variability of the percentage difference between the 2 measurements. aTRV combines these 2 effects into a single value. To evaluate within-subject variability relative to between-subject variability, ICC was computed using the following equation:
 where BSMSS indicates the between-subject mean sum of squares and WSMSS indicates the within-subject mean sum of squares.
RESULTS
Injection and Scan Parameters
Injection and scan parameters are listed in Table 1. The injected dose and injected mass did not significantly differ between the test and retest scans (P > 0.05, paired t test).
Subject Information and PET Scan Parameters
Plasma Analysis
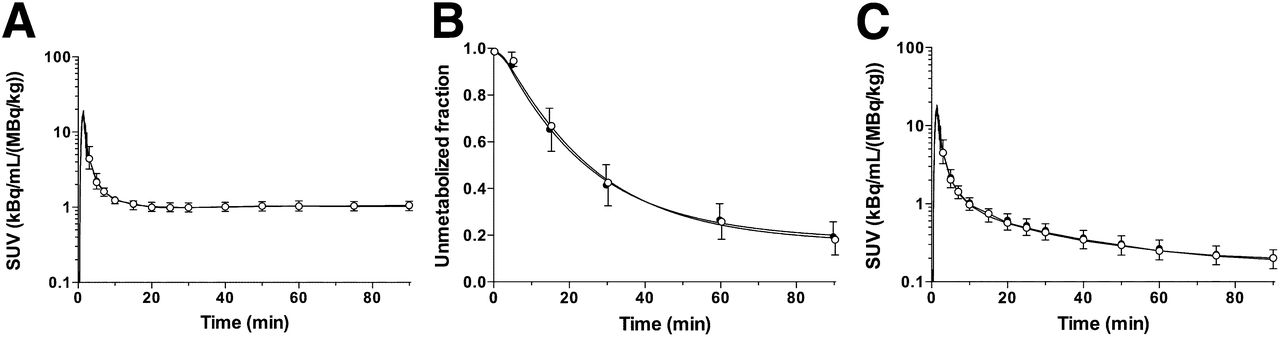
Figure 1 displays the total plasma curves, parent fractions, and metabolite-corrected plasma curves for the test and retest scans. There were no significant differences in the parent fractions between the test and retest scans (Fig. 1B). The parent fraction was 42% ± 9% and 19% ± 6% at 30 and 90 min after injection, respectively (n = 32). The fP of 11C-LY2795050 was 0.0094 ± 0.0014 (n = 32). The TRV of fP was 5% ± 12%, with no significant change between the test and retest scans (P = 0.11, paired t test).

Mean ± SD of total plasma activity (A), parent fraction in plasma (B), and metabolite-corrected plasma activity (C) over time after injection of 11C-LY2795050 in test (closed circles, n = 16) and retest (open circles, n = 16) scans. A and C are displayed in SUV units (concentration/[injected dose/body weight]).
Uptake Images
Figure 2 shows template MR images and summed PET images averaged across all subjects and scans. A similar uptake pattern for 11C-LY2795050 was observed in the test and retest scans. High uptake was seen in the amygdala, anterior cingulate cortex, insula, and globus pallidus.
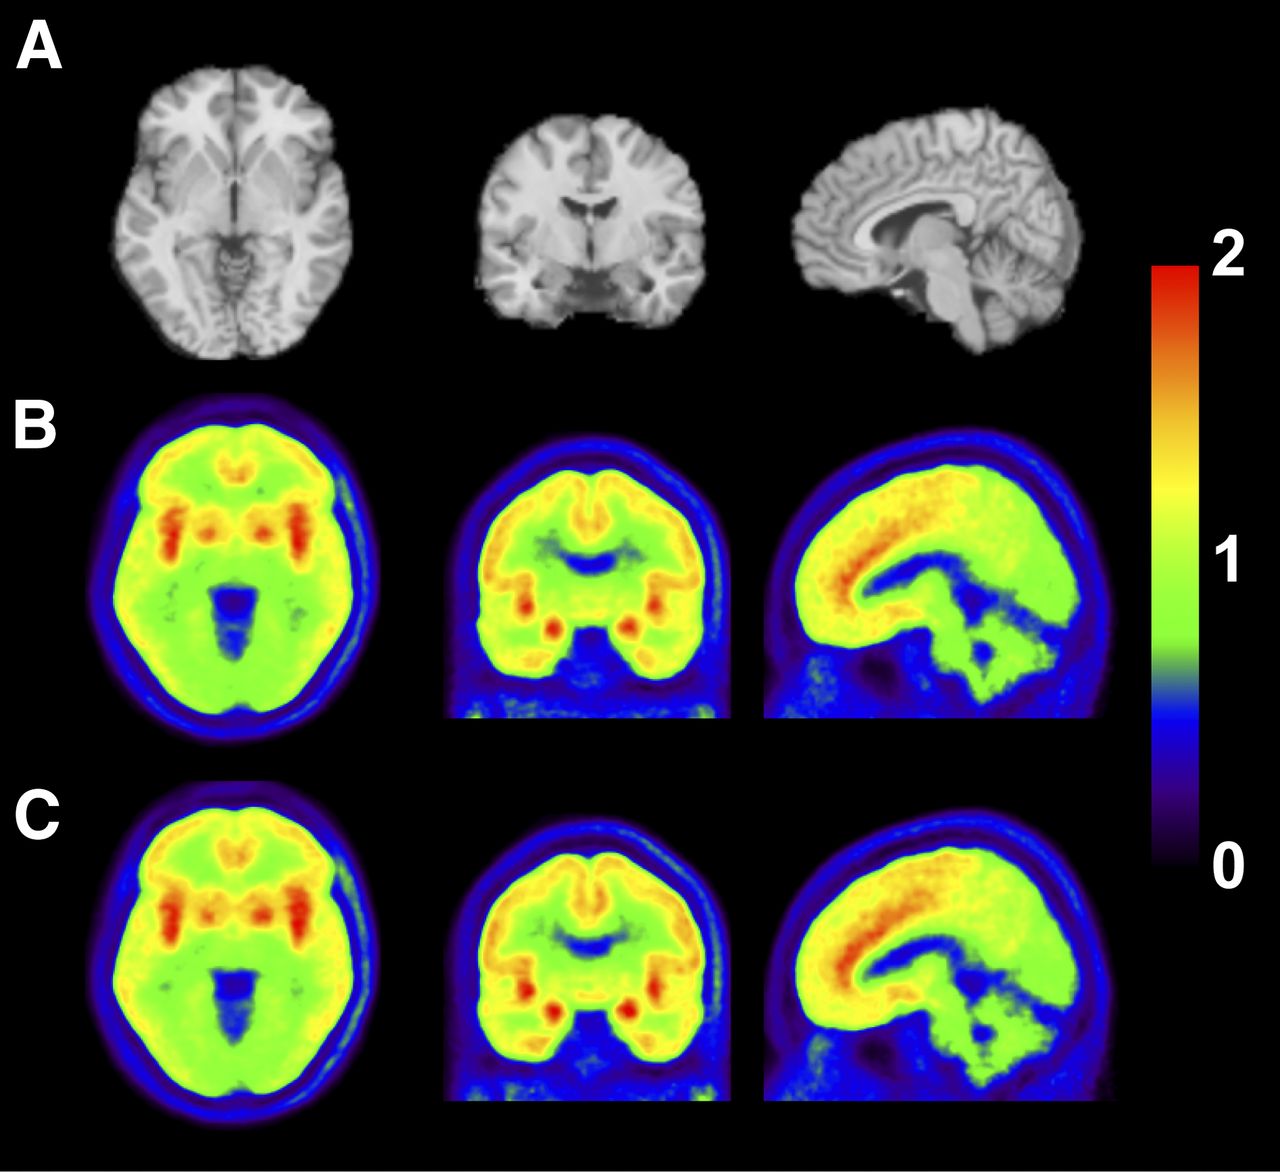
MR images and coregistered PET images summed from 30 to 90 min after injection of 11C-LY2795050: MR images (A), test scan (B), and retest scan (C). PET images are displayed in SUV units. SUV images were averaged across all subjects.
TRV and Reproducibility of Binding Parameters
Regional time–activity curves for representative brain regions under test and retest conditions are shown in Figures 3A and 3B, respectively. The 2TC and MA1 (t* = 30 min) models provided good fits to the regional time–activity curves. MA1 provided reliable VT estimates, with the relative SE (SE/estimated parameter) being less than 10% in most regions and scans, except for the amygdala in 2 scans (10% and 13%). The 2TC VT estimates were somewhat less stable, with relative SE being more than 10% or k4 less than 0.001 min−1 in 2.5% of the fits (amygdala [n = 4], insula [n = 1], globus pallidus [n = 1], putamen [n = 1], caudate [n = 3], and centrum semiovale [n = 1]). Excluding these unreliable VT estimates, VT values from MA1 and 2TC were nearly identical (VT,MA1 = 1.00 VT,2TC − 0.02, R2 = 0.99). The MA1 VT estimates were used for assessing TRV.

Time–activity curves from 1 subject for 6 selected regions after injection of 11C-LY2795050 under test (A) and retest (B) conditions. Fits with MA1 (t* = 30 min) and 2TC models are displayed as solid and dotted lines, respectively.
Table 2 shows the outcome measures of interest estimated with MA1 under test and retest conditions. Intersubject variability was 9%–16% for VT, 16%–21% for VT/fP, 14%–46% for BPND, 8%–41% for BPP, and 15%–46% for BPF. Given the relatively small magnitude of BPND (0.33–1.5) and BPP (0.52–2.42), higher intersubject variability is to be expected. For the higher-binding regions (e.g., BPND > 0.5), the variability in BPND and BPP values was less than 30% and less than or equal to 20%, respectively.
Binding Parameters Derived from MA1 Method
Tables 3 and 4 list the test–retest statistics for VT and binding potential, respectively. For the VT estimates, the global mean of TRV and aTRV across all regions was 1% and 7%, respectively. ICC values for the VT estimates were generally good (>0.6) except for the amygdala (0.41), thalamus (0.54), and centrum semiovale (0.57). The use of fP to normalize VT led to poorer reproducibility, with global means of TRV and aTRV at −4% and 14%, respectively. In the regions with moderate to high KOR density (BPND > 0.4), with the exception of the amygdala and hippocampus the TRV had a mean close to zero (no trend between test and retest scans) and an SD of 3%, and the aTRV of the BPND estimates was lower than 10%. ICC values for the BPND estimates were greater than 0.8 in all regions except the amygdala (0.56). The global mean of aTRV for BPF (21%) was significantly higher than that for BPND (13%) or BPP (15%).
Test–Retest Reproducibility of Volume of Distribution
Test–Retest Reproducibility of Binding Potential
DISCUSSION
In this paper, we have presented the TRV and reproducibility of regional binding parameters derived from the KOR antagonist tracer 11C-LY2795050 in the human brain.
In accordance with our previous analysis, the 2TC and MA1 models showed similarly good fits to regional time–activity curves and provided almost identical VT values. However, VT estimates with the 2TC model were unstable in some regions. Hence, the MA1 estimates were used for test–retest reproducibility assessment.
The small variability in the injected mass of 11C-LY2795050 was due to the mass limit of 10 μg, which was reached in most scans because of the narrow range of tracer specific activity (Table 1). Receptor occupancy by the carrier mass was calculated from the equation 100 × F/(F + KD), where F is the mean value (from 60 to 90 min after injection) of the protein-unbound and metabolite-corrected plasma concentration. Using the in vitro (0.72 nmol/L (9)) and in vivo (0.028 nmol/L (12)) KD values, we calculated the occupancy by carrier mass in all scans as being less than 0.2% and less than 3%, respectively. In our previous study on rhesus monkeys (11), the LY2795050 effective dose for 50% at KOR was estimated as 15.6 μg/kg. With this effective dose, the occupancy by LY2795050 was less than 1.5% in all scans. In either way, the injected tracer occupied less than 5% of the targeted receptor and fulfilled the tracer dose criterion.
fP was used to calculate normalized VT (VT/fP) and BPF. If fP is measured accurately and VT varies linearly with fP, the use of fP for normalization will reduce the TRV or aTRV. However, fP was too low (<1%) to be measured accurately for this tracer. Moreover, in comparing VT and binding potential with or without correction by fP (VT and VT/fP, and BPP and BPF), we found that the absolute TRV was higher and ICC lower for the estimates with fP correction than for the estimates without fP correction in all regions, because fP is higher in the test scan than the retest scan. Among the 3 binding potentials, BPF showed the highest aTRV, which was twice that for BPND. Normalization of VT by fP or binding potential calculated with fP led to worse test–retest reproducibility and reliability, possibly because of small errors in fP measurements.
The test–retest performance of 11C-LY2795050 in VT estimates was excellent across all regions, with mean TRV being close to 0% and aTRV being less than 10%, except for the amygdala and centrum semiovale (aTRV of 12% and 10%, respectively) (Table 3). Similarly, in regions with moderate and high KOR densities, the TRV of BPND and BPP estimates was also good. However, in regions with low KOR density (posterior cingulate cortex, thalamus, centrum semiovale), not surprisingly, the variability of BPND and BPP was higher than that of VT. On the basis of these TRV values, the use of binding potential would likely be limited to regions with moderate to high KOR density. In this study, we calculated binding potential with a fixed fraction of individual cerebellar VT as VND. An important assumption here is that the fraction does not change between the test and retest scans. Obviously, the use of a fixed fraction of cerebellar VT as VND will also need validation in different patient populations by blocking experiments and in subjects under drug challenge conditions. The use of VT instead of binding potential is most appropriate, and preferred, if this assumption of a fixed fraction of cerebellar VT as VND is no longer valid, depending on disease or experimental conditions.
The aTRV in the highest-binding region, amygdala, was more than 10% in all outcome measures although it was lower in other high-binding regions. The likely reason is that its small size led to a noisy time–activity curve.
The development of selective KOR imaging agents has been pursued for a long time (19). Although several radiotracers have been developed over the years, thus far only the KOR agonist 11C-GR103545 has been investigated extensively in vivo in nonhuman primates (20,21) and humans (22) and found to be a suitable radiotracer for KOR imaging and quantification. As part of a comprehensive evaluation in humans, the test–retest performance of 11C-GR103545 was assessed using methods similar to those described above for 11C-LY2795050 (22). The mean aTRV of VT estimate was about 15% for 11C-GR103545, compared with less than 10% for 11C-LY2795050. This difference in the test–retest reproducibility of VT estimates most likely derives from the kinetic behavior of these 2 tracers: 11C-LY2795050 has fast kinetics, whereas the kinetics of 11C- GR103545 are protracted.
To our knowledge, 11C-GR103545 has been the first KOR agonist radiotracer advanced to imaging applications in humans and 11C-LY2795050 the first KOR antagonist tracer evaluated in humans—with both investigations taking place in our laboratory. As a result of these investigations, we now have a pair of agonist and antagonist radiotracers available for in vivo investigation of KOR.
The opioid receptors belong to the superfamily of G-protein–coupled receptors, and G-protein–coupled receptors are considered to have two states: a high affinity for agonists and a low-affinity state. Agonists bind only to the high-affinity state, whereas antagonists do not distinguish the low- and high-affinity states and bind to both. Hence, the availability of a pair of agonist (11C-GR103545) and antagonist (11C-LY2795050) KOR tracers for use in humans will provide unique opportunities to assess the potential changes not only in total receptor expression but also in receptor state under disease conditions, as seen in the studies of dopamine D2/D3 receptors with the agonist tracers 11C-(+)-PHNO (11C-(+)-4-propyl-9-hydroxynaphthoxazine), 11C-NPA ((−)-N-11Cpropylnorapomorphine), or 11C-MNPA ([O-methyl-11C]2-methoxy-N-propylnorapomorphine) and the antagonist tracer 11C-raclopride (23–30).
Given the excellent reproducibility of VT estimates derived from PET imaging of KOR with 11C-LY2795050 in the human brain and the involvement of KOR in several neuropsychiatric disorders, 11C-LY2795050 is currently being used at our center in multiple clinical imaging studies to investigate the role of KOR in depression, posttraumatic stress disorder (31), cocaine addiction, and alcoholism.
CONCLUSION
In this study, we evaluated the reproducibility of binding parameters with 11C-LY2795050 in humans and found that this novel KOR antagonist radiotracer provides excellent test–retest reproducibility, with absolute TRV of no more than 10% in any brain region except the amygdala. The results from the present study strongly support the use of 11C-LY2795050 as a PET radiotracer to image and quantitate KOR in humans with high reliability.
DISCLOSURE
The costs of publication of this article were defrayed in part by the payment of page charges. Therefore, and solely to indicate this fact, this article is hereby marked “advertisement” in accordance with 18 USC section 1734. This study was supported by Eli Lilly and Co. and by a research grant from NIMH (1 R01 MH091537). This publication was also made possible by CTSA grant UL1 RR024139 from the National Center for Research Resources (NCRR) and the National Center for Advancing Translational Sciences (NCATS), components of the National Institutes of Health (NIH). No potential conflict of interest relevant to this article was reported. The contents of this article are solely the responsibility of the authors and do not necessarily represent the official view of NIH.
Acknowledgments
We appreciate the excellent technical assistance of the staff at the Yale University PET Center.
Footnotes
Published online Jan. 15, 2015.
- © 2015 by the Society of Nuclear Medicine and Molecular Imaging, Inc.
REFERENCES
- Received for publication October 3, 2014.
- Accepted for publication November 20, 2014.


Jump to section
Related Articles
Cited By...
- First-in-Human Assessment of 11C-LSN3172176, an M1 Muscarinic Acetylcholine Receptor PET Radiotracer
- Kinetic Modeling and Test-Retest Reproducibility of 11C-EKAP and 11C-FEKAP, Novel Agonist Radiotracers for PET Imaging of the {kappa}-Opioid Receptor in Humans
- Impact of Pharmacological Manipulation of the {kappa}-Opioid Receptor System on Self-grooming and Anhedonic-like Behaviors in Male Mice
- Novel 18F-Labeled {kappa}-Opioid Receptor Antagonist as PET Radiotracer: Synthesis and In Vivo Evaluation of 18F-LY2459989 in Nonhuman Primates
- Receptor Occupancy of the {kappa}-Opioid Antagonist LY2456302 Measured with Positron Emission Tomography and the Novel Radiotracer 11C-LY2795050