
Main menu

  • Home
  • Content
    • Current
    • Ahead of print
    • Past Issues
    • JNM Supplement
    • SNMMI Annual Meeting Abstracts
    • Continuing Education
    • JNM Podcasts
  • Subscriptions
    • Subscribers
    • Institutional and Non-member
    • Rates
    • Journal Claims
    • Corporate & Special Sales
  • Authors
    • Submit to JNM
    • Information for Authors
    • Assignment of Copyright
    • AQARA requirements
  • Info
    • Reviewers
    • Permissions
    • Advertisers
  • About
    • About Us
    • Editorial Board
    • Contact Information
  • More
    • Alerts
    • Feedback
    • Help
    • SNMMI Journals
  • SNMMI
    • JNM
    • JNMT
    • SNMMI Journals
    • SNMMI

User menu

  • Subscribe
  • My alerts
  • Log in
  • My Cart

Search

  • Advanced search
Journal of Nuclear Medicine
  • SNMMI
    • JNM
    • JNMT
    • SNMMI Journals
    • SNMMI
  • Subscribe
  • My alerts
  • Log in
  • My Cart
Journal of Nuclear Medicine

Advanced Search

  • Home
  • Content
    • Current
    • Ahead of print
    • Past Issues
    • JNM Supplement
    • SNMMI Annual Meeting Abstracts
    • Continuing Education
    • JNM Podcasts
  • Subscriptions
    • Subscribers
    • Institutional and Non-member
    • Rates
    • Journal Claims
    • Corporate & Special Sales
  • Authors
    • Submit to JNM
    • Information for Authors
    • Assignment of Copyright
    • AQARA requirements
  • Info
    • Reviewers
    • Permissions
    • Advertisers
  • About
    • About Us
    • Editorial Board
    • Contact Information
  • More
    • Alerts
    • Feedback
    • Help
    • SNMMI Journals
  • View or Listen to JNM Podcast
  • Visit JNM on Facebook
  • Join JNM on LinkedIn
  • Follow JNM on Twitter
  • Subscribe to our RSS feeds
Research ArticleClinical Investigations

18F-FLT PET During Radiotherapy or Chemoradiotherapy in Head and Neck Squamous Cell Carcinoma Is an Early Predictor of Outcome

Bianca A.W. Hoeben, Esther G.C. Troost, Paul N. Span, Carla M.L. van Herpen, Johan Bussink, Wim J.G. Oyen and Johannes H.A.M. Kaanders
Journal of Nuclear Medicine April 2013, 54 (4) 532-540; DOI: https://doi.org/10.2967/jnumed.112.105999
Bianca A.W. Hoeben
1Department of Radiation Oncology, Radboud University Nijmegen Medical Centre, Nijmegen, The Netherlands
  • Find this author on Google Scholar
  • Find this author on PubMed
  • Search for this author on this site
Esther G.C. Troost
1Department of Radiation Oncology, Radboud University Nijmegen Medical Centre, Nijmegen, The Netherlands
  • Find this author on Google Scholar
  • Find this author on PubMed
  • Search for this author on this site
Paul N. Span
1Department of Radiation Oncology, Radboud University Nijmegen Medical Centre, Nijmegen, The Netherlands
  • Find this author on Google Scholar
  • Find this author on PubMed
  • Search for this author on this site
Carla M.L. van Herpen
2Department of Medical Oncology, Radboud University Nijmegen Medical Centre, Nijmegen, The Netherlands; and
  • Find this author on Google Scholar
  • Find this author on PubMed
  • Search for this author on this site
Johan Bussink
1Department of Radiation Oncology, Radboud University Nijmegen Medical Centre, Nijmegen, The Netherlands
  • Find this author on Google Scholar
  • Find this author on PubMed
  • Search for this author on this site
Wim J.G. Oyen
3Department of Nuclear Medicine, Radboud University Nijmegen Medical Centre, Nijmegen, The Netherlands
  • Find this author on Google Scholar
  • Find this author on PubMed
  • Search for this author on this site
Johannes H.A.M. Kaanders
1Department of Radiation Oncology, Radboud University Nijmegen Medical Centre, Nijmegen, The Netherlands
  • Find this author on Google Scholar
  • Find this author on PubMed
  • Search for this author on this site
  • Article
  • Figures & Data
  • Supplemental
  • Info & Metrics
  • PDF
Loading

Article Figures & Data

Figures

  • Tables
  • Additional Files
  • FIGURE 1.
    • Download figure
    • Open in new tab
    • Download powerpoint
    FIGURE 1.

    Box plots of SUVmax(9) (A), GTVVIS (B), GTVSBR (C), and GTV50% (D) on consecutive 18F-FLT PET/CT scans. Bottom and top of each box are lower and upper quartiles. Black band near middle of box is median. Extremes of lower and higher whiskers represent range of minimum and maximum values. *P ≤ 0.001, Wilcoxon signed-rank test.
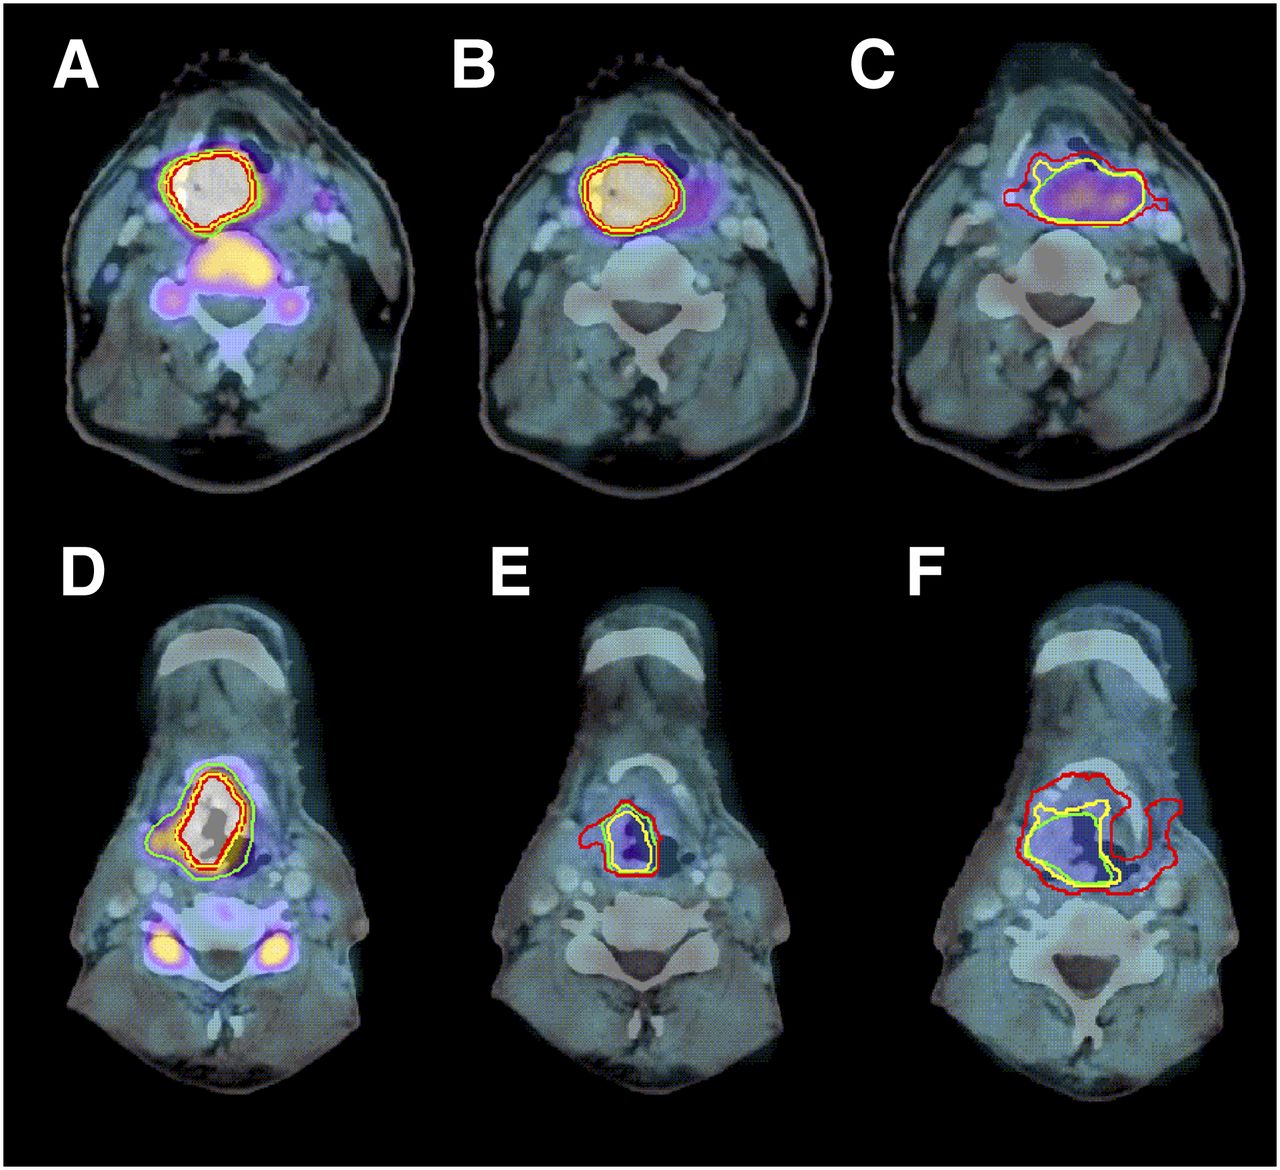
  • FIGURE 2.
    • Download figure
    • Open in new tab
    • Download powerpoint
    FIGURE 2.

    18F-FLT PET/CT before therapy (A and D), in second week of therapy (B and E), and in fourth week of therapy (C and F). First example (A–C) shows slow decrease in 18F-FLT uptake (cT4N2bM0 supraglottic laryngeal carcinoma treated with chemoradiotherapy; local recurrence after 7 mo; later distant metastases) and second one (D–F) fast decrease (cT3N1M0 supraglottic laryngeal carcinoma treated with radiotherapy only; no tumor-related event after 32 mo of follow-up). For GTVVIS (green), 3-dimensional volume change was +8% between A and B, −35% between A and C, −60% between D and E, and −66% between D and F. For GTVSBR (yellow), 3-dimensional volume change was +7% between A and B, +4% between A and C, −44% between D and E, and +22% between D and F. For GTV50% (red), 3-dimensional volume change was +11% between A and B, +102% between A and C; +30% between D and E, and +247% between D and F. SUVmax(9) changed by −35% between A and B, −70% between A and C, −58% between D and E, and −69% between D and F.
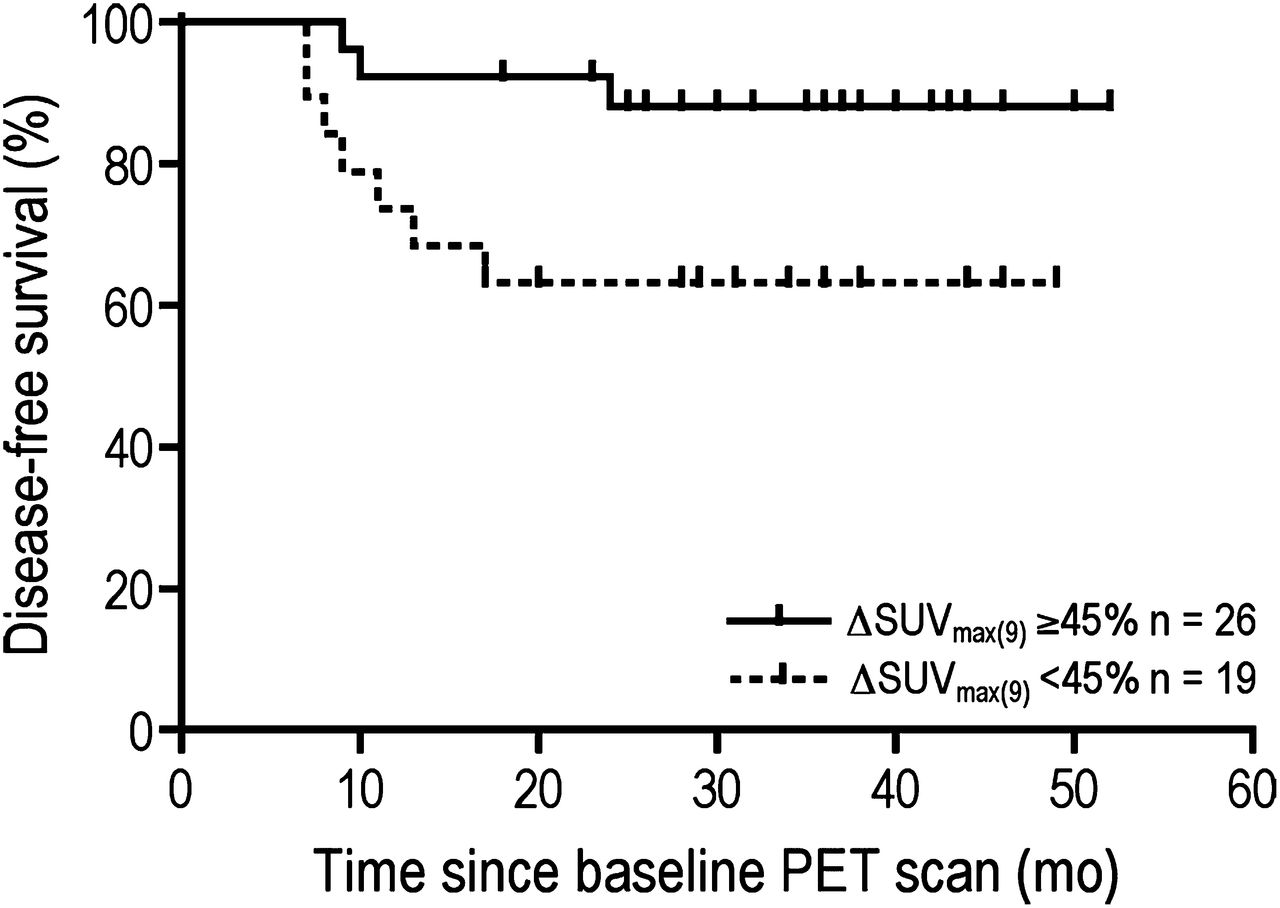
  • FIGURE 3.
    • Download figure
    • Open in new tab
    • Download powerpoint
    FIGURE 3.

    SUVmax(9) above or below 45% decrease between scans 1 and 2 for entire group of patients. P = 0.035.
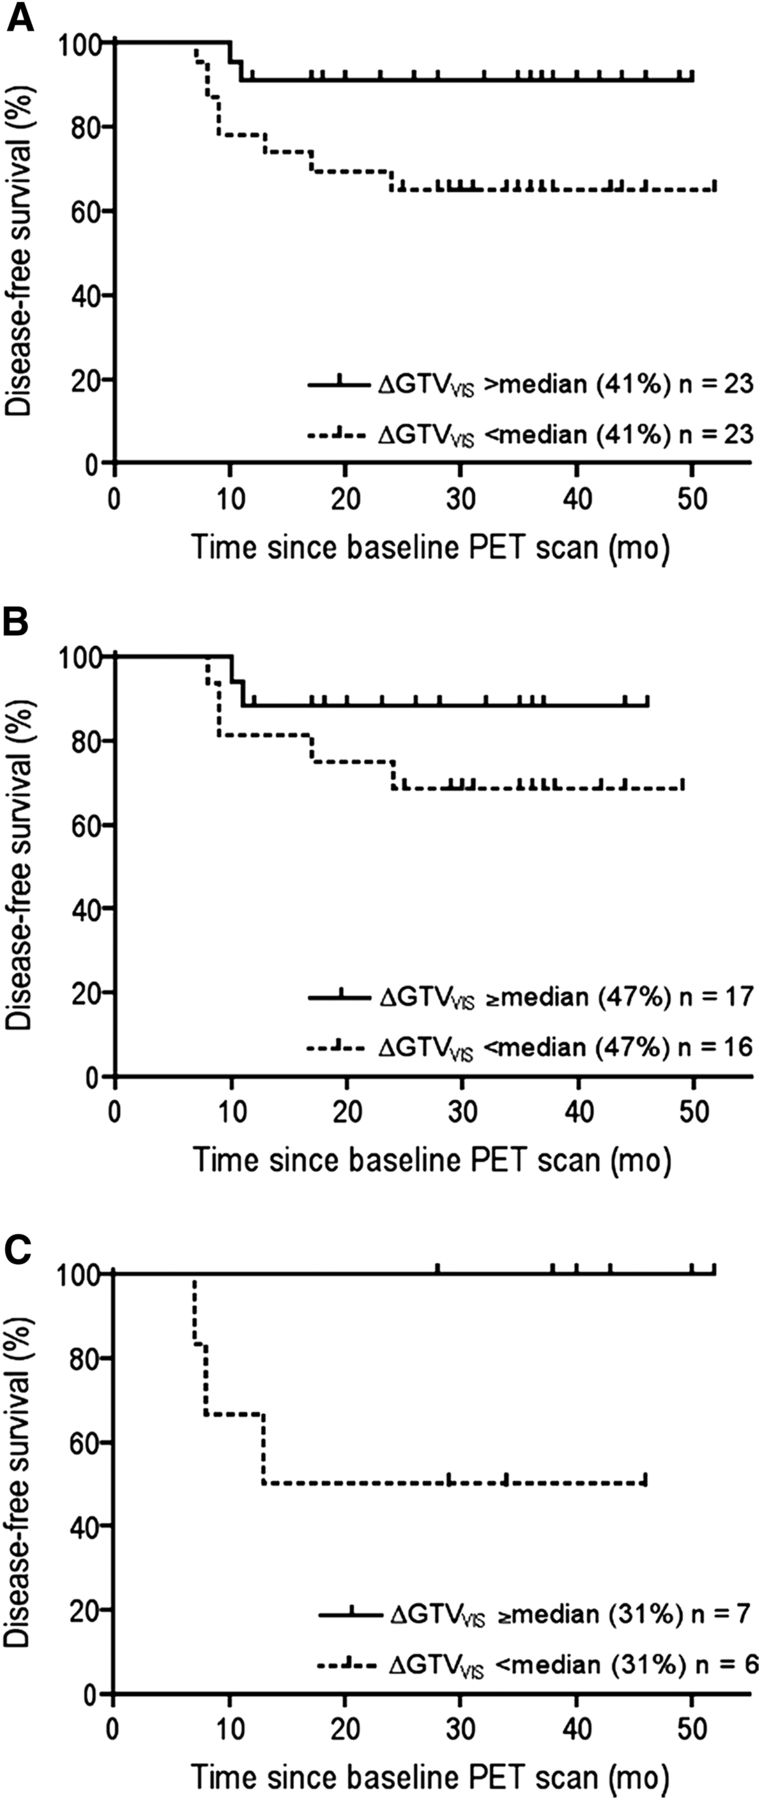
  • FIGURE 4.
    • Download figure
    • Open in new tab
    • Download powerpoint
    FIGURE 4.

    GTVVIS decrease above or below median between scans 1 and 2 for all patients (A), radiotherapy group (B), and chemoradiotherapy group (C). P = 0.037, 0.203, and 0.039, respectively.

Tables

  • Figures
  • Additional Files
    • View popup
    TABLE 1

    Patient Characteristics and Events

    CharacteristicData
    Age at baseline PET (y)
     Mean60
     Range39–75
    Sex (n = 48)
     Female10 (21)
     Male38 (79)
    Smoking (n = 48)
     Active33 (69)
     Former12 (25)
     Unknown3 (6)
    Alcohol use (n = 48)
     Active35 (73)
     Former4 (8)
     Never4 (8)
     Unknown5 (10)
    T stage (n = 50)
     11 (2)
     225 (50)
     317 (34)
     47 (14)
    N stage (n = 50)
     022 (44)
     16 (12)
     2a—
     2b11(22)
     2c11 (22)
    International Union Against Cancer stage (n = 50)
     II12 (24)
     III13 (26)
     IVA25 (50)
    Histologic grade (n = 50)
     14 (8)
     226 (52)
     311 (22)
     Unknown9 (18)
    Primary tumor site (n = 50)
     Oral cavity1 (2)
     Oropharynx27 (54)
     Larynx14 (28)
     Hypopharynx8 (16)
    Treatment (n = 48)
     Radiotherapy33 (69)
     Chemoradiotherapy15 (31)
    No. of events tumor-related (n = 48)
     Locoregional recurrence7 (15)
     Distant metastases*4 (8)
     Tumor-related death7 (15)
    No. of events not tumor-related (n = 48)
     Death due to another cause6 (13)
     Second primary tumor after start of study†8 (17)
    • ↵* Distant metastases (pulmonal, skeletal, cerebral, and cutaneous) were detected after 7, 9, and 11 mo.

    • ↵† Second primary tumors were located in head and neck area, lungs, esophagus, rectum, bladder, and skin.

    • Data are numbers of patients, with percentages in parentheses, except for age, which is years.

    • View popup
    TABLE 2

    Outcome as Function of (Changes in) PET/CT Parameters

    P
    ParameterBest group by cutoff level3-y LRC3-y DFS3-y OS
    All patients
     SUVmax(9) 1SUVmax(9) ≥ 6.1*0.170.120.52
     GTVCT 1GTVCT < 6.5 cm3100 (80–100) vs. 76 (60–92): 0.044†0.270.13
     GTVVIS 1GTVVIS < 6.5 cm3100 (75–100) vs. 79 (65–93): 0.0920.200.26
     Δ SUVmax(9) 1–2Decrease ≥ 45%‡92 (80–100) vs. 72 (51–93): 0.06688 (75–100) vs. 63 (41–85): 0.035†0.23
     Δ GTVVIS 1–2Decrease ≥ 41%*0.2191 (80–100) vs. 65 (46–84): 0.037†0.86
     Δ GTVVIS 1–3Decrease ≥ 78%*100 (78–100) vs. 68 (41–94): 0.021†100 (78–100) vs. 56 (30–83): 0.005†80 (54–100) vs. 48 (6–89): 0.084
    Radiotherapy
     SUVmax(9) 1SUVmax(9) < 6.6‡95 (85–100) vs. 70 (41–99): 0.07590 (77–100) vs. 59 (31–87): 0.044†0.59
     GTVCT 1GTVCT < 6.5 cm3100 (79–100) vs. 73 (50–96): 0.048†0.260.25
     GTVVIS 1GTVVIS < 6.5 cm30.110.200.44
     Δ SUVmax(9) 1–2Decrease ≥ 45%0.480.200.65
     Δ GTVVIS 1–2Decrease ≥ 47%*0.950.200.27
     Δ GTVVIS 1–3Decrease > 77%*100 (72–100) vs. 66 (34–98): 0.05100 (72–100) vs. 53 (23–83): 0.013†0.12
    Chemoradiotherapy
     SUVmax(9) 1SUVmax(9) ≥ 6.6*100 (63–100) vs. 57 (20–94): 0.044†100 (63–100) vs. 57 (20–94): 0.044†100 (63–100) vs. 57 (8–100): 0.080
     GTVCT 1GTVCT < 6.5 cm30.630.630.66
     GTVVIS 1GTVVIS < 6.5 cm30.630.630.66
     Δ SUVmax(9) 1–2Decrease ≥ 45%100 (54–100) vs. 57 (20–94): 0.081100 (54–100) vs. 57 (20–94): 0.081100 (54–100) vs. 57 (8–100): 0.10
     Δ GTVVIS 1–2Decrease ≥ 31%*100 (59–100) vs. 50 (10–90): 0.039†100 (59–100) vs. 50 (10–90): 0.039†100 (59–100) vs. 56 (7–100): 0.079
     Δ GTVVIS 1–3Not tested§Not tested§Not tested§Not tested§
    • ↵* Dichotomization by median value.

    • ↵† P < 0.05.

    • ↵‡ Dichotomization value found through receiver-operating-characteristic analysis.

    • ↵§ Too few subjects for testing (n = 7).

    • GTVCT = visually delineated gross tumor volume on CT; Δ = difference between baseline scans (1) and subsequent scans (2 or 3).

    • Numbers after PET/CT parameters refer to first, second, or third scan. For survival data with P ≤ 0.1, 3-y survival data per group are given (%), with 95% CI in parentheses; for survival differences with P > 0.1, only P value is given.

Additional Files

  • Figures
  • Tables
  • Supplemental Data

    Files in this Data Supplement:

    • Supplemental Data
PreviousNext
Back to top

In this issue

Journal of Nuclear Medicine: 54 (4)
Journal of Nuclear Medicine
Vol. 54, Issue 4
April 1, 2013
  • Table of Contents
  • Table of Contents (PDF)
  • About the Cover
  • Index by author
Print
Download PDF
Article Alerts
Sign In to Email Alerts with your Email Address
Email Article

Thank you for your interest in spreading the word on Journal of Nuclear Medicine.

NOTE: We only request your email address so that the person you are recommending the page to knows that you wanted them to see it, and that it is not junk mail. We do not capture any email address.

Enter multiple addresses on separate lines or separate them with commas.
18F-FLT PET During Radiotherapy or Chemoradiotherapy in Head and Neck Squamous Cell Carcinoma Is an Early Predictor of Outcome
(Your Name) has sent you a message from Journal of Nuclear Medicine
(Your Name) thought you would like to see the Journal of Nuclear Medicine web site.
Citation Tools
18F-FLT PET During Radiotherapy or Chemoradiotherapy in Head and Neck Squamous Cell Carcinoma Is an Early Predictor of Outcome
Bianca A.W. Hoeben, Esther G.C. Troost, Paul N. Span, Carla M.L. van Herpen, Johan Bussink, Wim J.G. Oyen, Johannes H.A.M. Kaanders
Journal of Nuclear Medicine Apr 2013, 54 (4) 532-540; DOI: 10.2967/jnumed.112.105999

Citation Manager Formats

  • BibTeX
  • Bookends
  • EasyBib
  • EndNote (tagged)
  • EndNote 8 (xml)
  • Medlars
  • Mendeley
  • Papers
  • RefWorks Tagged
  • Ref Manager
  • RIS
  • Zotero
Share
18F-FLT PET During Radiotherapy or Chemoradiotherapy in Head and Neck Squamous Cell Carcinoma Is an Early Predictor of Outcome
Bianca A.W. Hoeben, Esther G.C. Troost, Paul N. Span, Carla M.L. van Herpen, Johan Bussink, Wim J.G. Oyen, Johannes H.A.M. Kaanders
Journal of Nuclear Medicine Apr 2013, 54 (4) 532-540; DOI: 10.2967/jnumed.112.105999
Twitter logo Facebook logo LinkedIn logo Mendeley logo
  • Tweet Widget
  • Facebook Like
  • Google Plus One
Bookmark this article

Jump to section

  • Article
    • Abstract
    • MATERIALS AND METHODS
    • RESULTS
    • DISCUSSION
    • CONCLUSION
    • DISCLOSURE
    • Acknowledgments
    • Footnotes
    • REFERENCES
  • Figures & Data
  • Supplemental
  • Info & Metrics
  • PDF

Related Articles

  • This Month in JNM
  • PubMed
  • Google Scholar

Cited By...

  • FLT PET/CT imaging of metastatic prostate cancer patients treated with pTVG-HP DNA vaccine and pembrolizumab
  • Imaging-Based Treatment Adaptation in Radiation Oncology
  • Molecular Imaging to Plan Radiotherapy and Evaluate Its Efficacy
  • PET Imaging in Head and Neck Cancer Patients to Monitor Treatment Response: A Future Role for EGFR-Targeted Imaging
  • 111In-Cetuximab-F(ab')2 SPECT and 18F-FDG PET for Prediction and Response Monitoring of Combined-Modality Treatment of Human Head and Neck Carcinomas in a Mouse Model
  • Early Response Monitoring with 18F-FDG PET and Cetuximab-F(ab')2-SPECT After Radiotherapy of Human Head and Neck Squamous Cell Carcinomas in a Mouse Model
  • PET Imaging During Radiotherapy of Head and Neck Cancer
  • Google Scholar

More in this TOC Section

  • Feasibility of Ultra-Low-Activity 18F-FDG PET/CT Imaging Using a Long–Axial-Field-of-View PET/CT System
  • Cardiac Presynaptic Sympathetic Nervous Function Evaluated by Cardiac PET in Patients with Chronotropic Incompetence Without Heart Failure
  • Validation and Evaluation of a Vendor-Provided Head Motion Correction Algorithm on the uMI Panorama PET/CT System
Show more Clinical Investigations

Similar Articles

Keywords

  • 18F-fluorothymidine PET
  • head and neck cancer
  • early response monitoring
SNMMI

© 2025 SNMMI

Powered by HighWire