


Abstract
We report the first, to our knowledge, findings describing the relationships between both static and dynamic analysis parameters of 3′-deoxy-3′-18F-fluorothymidine (18F-FLT) PET and the expression of the proliferation marker Ki-67, and the protein expression and enzymatic activity of thymidine kinase-1 (TK1) in surgically resected lung lesions. Methods: Static and dynamic analyses (4 rate constants and 2 compartments) of 18F-FLT PET images were performed in a cohort of 25 prospectively accrued, clinically suspected lung cancer patients before surgical resection (1 lesion was found to be benign after surgery). The maximal and overall averaged expression of Ki-67 and TK1 were determined by semiquantitative analysis of immunohistochemical staining. TK1 enzymatic activity was determined by in vitro assay of extracts prepared from flash-frozen samples of the same tumors. Results: Static 18F-FLT uptake (partial-volume–corrected maximum-pixel standardized uptake value from 60- to 90-min summed dynamic data) was significantly correlated with the overall (ρ = 0.57, P = 0.006) and maximal (ρ = 0.69, P < 0.001) immunohistochemical expressions of Ki-67 and TK1 (overall expression: ρ = 0.65, P = 0.001; maximal expression: ρ = 0.68, P < 0.001) but not with TK1 enzymatic activity (ρ = 0.34, P = 0.146). TK1 activity was significantly correlated with TK1 protein expression only when immunohistochemistry was scored for maximal expression (ρ = 0.52, P = 0.029). Dynamic analysis of 18F-FLT PET revealed correlations between the flux constant (KFLT) and both overall (ρ = 0.53, P = 0.014) and maximal (ρ = 0.50, P = 0.020) TK1 protein expression. KFLT was also associated with both overall (ρ = 0.59, P = 0.005) and maximal (ρ = 0.63, P = 0.002) Ki-67 expression. We observed no significant correlations between TK1 enzyme activity and KFLT. In addition, no significant relationships were found between TK1 expression, TK1 activity, or Ki-67 expression and any of the compartmental rate constants. Conclusion: The absence of observable correlations of the imaging parameters with TK1 activity suggests that 18F-FLT uptake and retention within cells may be complicated by a variety of still undetermined factors in addition to TK1 enzymatic activity.
- positron emission tomography (PET)
- 18F-FLT
- 3′-deoxy-3′-fluorothymidine
- thymidine kinase 1
- tumor proliferation
- lung tumors
PET is currently the only technology capable of assessing tumor proliferation noninvasively, quantitatively, and reproducibly with the goals of improving the determination of tumor prognosis and monitoring tumor response to therapy. PET requires a radiotracer that accumulates in tumors in proportion to their proliferation rate, leading to the development and validation of the radiopharmaceutical 3′-deoxy-3′-18F-fluorothymidine (18F-FLT) (1–3) and capitalizing on the initial evaluation of FLT as a therapeutic agent (4). 18F-FLT and thymidine are both substrates for cytosolic thymidine kinase-1 (TK1) (5), which monophosphorylates these compounds. TK1 catalyzes the initial metabolic step of thymidine triphosphate synthesis via the thymidine salvage pathway. 18F-FLT monophosphate is presumed not to cross back across the cell membrane (4), causing it to become metabolically trapped and accumulate in cells as if it were incorporated into DNA, although only trace amounts of 18F-FLT can be recovered from DNA extracts (6,7).
TK1 catalytic activity is closely tied to cell proliferation rate in normal cells via a complex interaction of transcriptional and posttranslational controls (8,9), which can equivocate interpretation of TK1 messenger RNA and protein expression values and greatly complicate the in vitro assay of TK1 activity in crude extracts of cells and tissues (10). Consequently, there are several reports attempting to relate 18F-FLT uptake to TK1 messenger RNA or protein expression—values that are taken to be surrogates for the actual TK1 enzyme activity at the time of measurement, although uncoupling of TK1 messenger RNA and protein expression in human cancer cells has been documented (11). One group has attempted to more closely link TK1 protein expression data with TK1 activity by measuring adenosine triphosphate (ATP) content and calculating a TK1 × ATP product that correlates more strongly with 18F-FLT uptake than TK1 expression alone (12).
Human cell culture studies performed at our institution have demonstrated that when growth-arrested A549 lung cancer cells are allowed to resume growth in fresh medium, their FLT uptake increases steadily over the next 6 h and correlates with both the percentage of cells in S phase and the catalytic activity of cytosolic TK1 (2,13,14). Cell culture and animal studies have been extended to include the comparison of presurgical 18F-FLT uptake during PET with proliferation in the resected lesions from human patients. 18F-FLT accumulates in proportion to overall tumor proliferation in resected human lung lesions (15) and several other human tumor types (16). Far less evidence is available concerning ex vivo TK1 protein expression in human tumors excised after 18F-FLT PET (17). To our knowledge, the present study is the first to examine the relationship between the catalytic activity of the TK1 enzyme of human solid tumors ex vivo and their in vivo 18F-FLT uptake during PET. As 18F-FLT is now undergoing clinical validation in large Investigational New Drug–based imaging trials, it becomes important to fully understand the biologic mechanisms that underpin its uptake in tumors and not merely assume that 18F-FLT uptake in solid tumors is solely driven by proliferation-associated TK1 activity. In the present study, we evaluate the relationship between preoperative 18F-FLT static and dynamic uptake measured by PET and TK1 protein expression and enzymatic activity in a series of 25 lung lesions. These data are compared with individual lesion proliferation rates assessed by Ki-67 immunohistochemistry.
MATERIALS AND METHODS
Patient Selection
All patients had biopsy-proven or clinically suspected, surgically resectable non–small cell lung cancer (NSCLC) with no previous therapy for their NSCLC. Lesions had to be greater than 1 cm in average diameter to permit partial-volume correction to account for the finite reconstructed resolution of the PET scanner (15,18). Patients were required to be at least 18 y old, weigh under 400 pounds, be cancer-free for the previous 5 y, not have insulin-dependent diabetes (for tumor staging with 18F-FDG PET), not be pregnant or breastfeeding, and able to give informed consent and to lie still for the duration of the study. The patient sex and characteristics of the lung lesions in this study are summarized in Table 1.
Baseline Demographic and Tumor Characteristics of Patient Study Group (n = 25)
In total, lung lesions from 25 patients (A–Y) were prospectively studied (Table 2). One enrolled patient (patient S) was physically too large to undergo 18F-FLT PET. Excessive motion in the early stages of the dynamic imaging for 1 patient rendered it impossible to conduct a kinetic analysis of the data. However, because the motion was limited to the early parts of the scan we were able to use the data for static analyses, which use the data summed over the 60- to 90-min time range (patient I). No immunohistochemical studies could be performed for 2 patients: patient C was determined after surgery to have a benign inflammatory lesion (we have included the standardized uptake value [SUV] and kinetic modeling data from this patient), and no paraffin-embedded tissue block was available for patient Y. Finally, flash-frozen tissue specimens for in vitro assay of TK1 enzymatic activity were available only for 20 of the 25 original enrollees. All patients were initially enrolled from the Thoracic Surgery Clinics at the University of Washington Medical Center and affiliated hospitals between March 2000 and November 2007. CT of the chest and 18F-FDG PET staging were used to determine the location of the lesion relative to the lung apex and carina. Thus, a short PET transmission scan could then be used to center the dynamic 18F-FLT scan on the lesion. This study was conducted under protocols approved by the University of Washington Human Subjects Division and Radiation Safety Committee.
Patient Groups and Datasets
Surgery and Pathology
Twenty-four lesions were surgically resected after 18F-FLT PET and surgical staging. All lesions received pathologic and immunohistochemical evaluation by an experienced clinical pathologist.
18F-FLT Synthesis
18F-FLT was prepared for human use in accordance with approval by and previously reported methods of the University of Washington Radioactive Drug Research Committee (19,20).
18F-FLT PET
All PET studies were performed on the same Advance PET tomograph (GE Healthcare). These studies were acquired in 2-dimensional imaging mode, with scatter septae in place. Real-time random correction using counts obtained with a delayed coincidence window and deconvolution-based scatter corrections supplied by the manufacturer were applied. The raw data were reconstructed using filtered backprojection available on the Advance PET system using the following parameters: 12-mm Hanning filter, 55-cm image diameter, and 128 × 128 array size. Images were acquired dynamically for 90–120 min over a single 15.2-cm field of view, producing 35 image planes with 4.25-mm slice spacing. The dynamic images were summed over the 60- to 90-min time bins, and these sums were used for static imaging analyses. Before the initiation of the dynamic scan and 18F-FLT injection, a 20- to 30-min transmission scan (attenuation map) was obtained over the selected field of view. 18F-FLT was administered intravenously over 1 min through a first arm catheter at a dose of 2.59 MBq of 18F-FLT per kilogram of patient weight (not exceeding 185 MBq total dose). The 18F-FLT injection was started at the same time as the dynamic scan initiation. This was not the case for 3 patients who had an additional 1-min preinjection scan, accounted for in our analyses. A second intravenous catheter, placed in the opposite arm from the injection site, was used to obtain venous samples for metabolite analysis as previously described (21).
Quantitative Imaging Analysis
To quantitate 18F-FLT uptake, a region of interest was placed over the 60- to 90-min summed images. From this, the maximum pixel uptake was found and its SUV calculated, resulting in a tumor maxSUV for each patient (15).
All maxSUV data were corrected for partial-volume effects (to account for tumor sizes relative to the reconstructed resolution of the PET scanner) with the appropriate recovery coefficients, as previously described by our group (15).
Kinetic Analysis
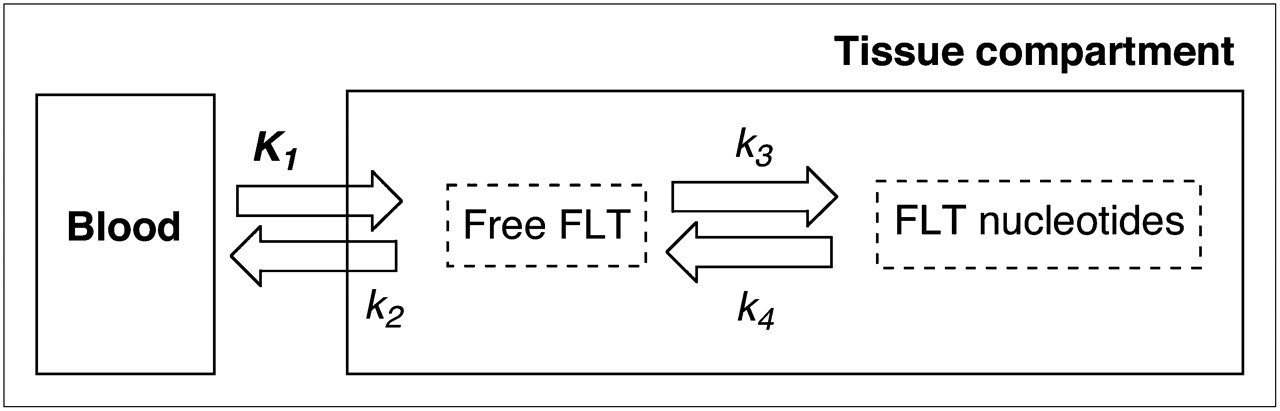
The kinetic analysis of the 18F-FLT PET data was conducted using a 2-tissue-compartment 4-rate parameter model (Fig. 1) as previously described (21,22). In brief, volumes of interest slightly larger than the tumor were placed on the 60- to 90-min summed 18F-FLT PET images. Of the tumor pixels present in the volume of interest, only those pixels that were at least 50% of the maximum tumor pixel intensity were selected by image processing to eliminate user-induced variability in the volume of interest. These volumes of interest were then transferred onto the dynamic data and used for the kinetic analyses.

Schematic representation of kinetic model using 2 exchangeable tissue compartments and 4 kinetic rate constants describing directional flux of 18F-FLT.
All parameters and flux constant (KFLT) values have been reported in Table 3. KFLT was not partial-volume–corrected because it represents a net movement over time of 18F-FLT through tissue compartments, with all time frames equally affected by partial-volume effect, and these are accounted for by the method defining the region of interest (full width at half maximum).
Kinetic Parameters (n = 23)
Immunohistochemical Staining and Scoring
Immunohistochemical staining and scoring of stained slides have previously been described in detail by our group (23). The identical methodology was implemented in the present study.
TK1 Activity Assay
In vitro assay of TK1 enzyme activity was essentially as previously described (10), with minor modifications using recombinant human TK1 as an interassay control as detailed below. It was designed specifically to mirror the conditions in which the 18F-FLT PET studies were performed—that is, additions of [3H-methyl]-thymidine and ATP were minimized to allow endogenous levels of TK1 regulators to impact the assay in the same way they impacted the imaging study. As such, the TK1 assay results represent an overview of TK1 regulation at the time of imaging rather than the total amount of tumor extract TK1 activity that can be stimulated by the addition of optimal concentrations of thymidine and ATP. Recombinant human TK1 (12.5 μmol/min/mg; Jubi Kinase) was stabilized by incubation (60 min, 4°C) with 2.5 mM ATP/MgCl2, bovine serum albumin (2.0 mg/mL), and 10% (v/v) glycerol, then placed in aliquots at a final concentration of 0.38 μg of TK1/mL and stored at −80°C. These aliquots (15 μL; never previously thawed), assayed in the presence of 0.1 mM nonradioactive thymidine, reproducibly yielded an activity of 4.07 ± 0.75 pmol/min/μg of protein (n = 35) in this assay and were used as a standard to monitor interassay variability. Interassay variability due to breakdown of the [3H-methyl]-thymidine label was corrected by adjusting the final TK1 activity for each tumor to the ratio of the mean activity of the recombinant human TK1 interassay standard run in the same assay to the mean of all recombinant human TK1 interassay standards (n = 35).
Statistical Analysis
Because the staining markers were not necessarily normally distributed between patients and samples, or were ordinal in nature, nonparametric Spearman rank correlation coefficients were used to determine the degree of correlation between measurements of staining markers (TK1 and Ki-67), tumor 18F-FLT partial-volume–corrected maxSUV (PVC maxSUV), TK1 enzyme assay, and modeling data. A 2-sided 0.050 test level determined statistical significance for all analyses. All analyses were conducted using SAS software (version 9.1; SAS Institute Inc.).
RESULTS
Before evaluating the relationship between 18F-FLT uptake and TK1 expression or activity, we verified that our patient population demonstrated the expected correlation between 18F-FLT uptake and proliferation. We observed significant correlations between the PVC maxSUV and both overall (ρ = 0.57, P = 0.006) and maximal (ρ = 0.69, P < 0.001) Ki-67 staining (Fig. 2). More interestingly, PVC maxSUV correlated with both overall (ρ = 0.65, P = 0.001) and maximal (ρ = 0.68, P < 0.001) TK1 staining (Fig. 3). However, immunohistochemical detection of TK1 protein expression may not accurately reflect the enzymatic activity of TK1 in the tumor because of the rigorous posttranslational control of TK1 during the cell cycle. We therefore measured TK1 enzymatic activity in the flash-frozen resected lesions and compared these values to TK1 and Ki-67 expression as well as the presurgical PET parameters of the patients. The TK1 enzyme activity measured in 20 tumors covered a greater than 19-fold range (0.0014–0.0270 pmol/min/μg of protein), yielding a mean ± SD of 0.0093 ± 0.0073 pmol/min/μg of protein. We found no correlation when TK1 activity (Fig. 4A) was compared with TK1 protein expression measured by immunohistochemistry using the overall staining immunohistochemical scoring system (ρ = 0.41, P = 0.091). However, enzymatic activity did correlate with protein expression when immunohistochemistry was scored by regions of maximum staining (ρ = 0.52, P = 0.029). Furthermore, TK1 expression was significantly correlated with that of Ki-67 (Fig. 4B) when comparing both overall staining (ρ = 0.89, P < 0.001) and regions of maximum staining (ρ = 0.83, P < 0.001). We also compared TK1 activity to Ki-67 scoring and observed no significant correlation either when using overall staining (ρ = 0.29, P = 0.249) or when using regions of maximum staining (ρ = 0.33, P = 0.180, data not shown). In addition, no significant correlation was found between PVC maxSUV and TK1 enzymatic activity (ρ = 0.34, P = 0.146, n = 20, data not shown).
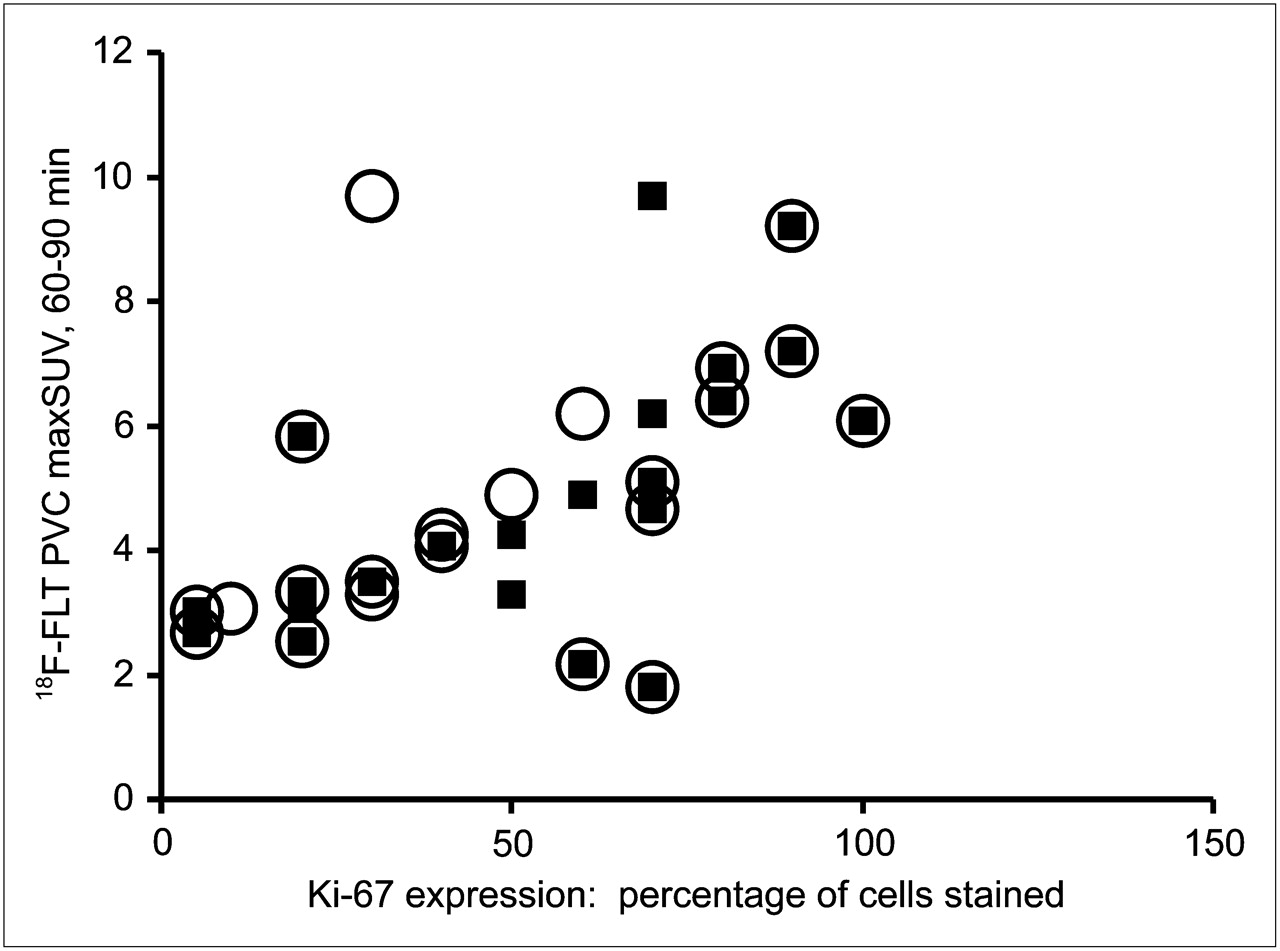
Relationship between PVC 18F-FLT maxSUV measured from 60 to 90 min (18F-FLT PVC maxSUV) and Ki-67 score of lung lesions. ○ = 18F-FLT PVC maxSUV vs. Ki-67 overall score (n = 22, ρ = 0.57, P = 0.006); ▪ = 18F-FLT PVC maxSUV vs. Ki-67 highest-proliferating-area score (n = 22, ρ = 0.69, P < 0.001).
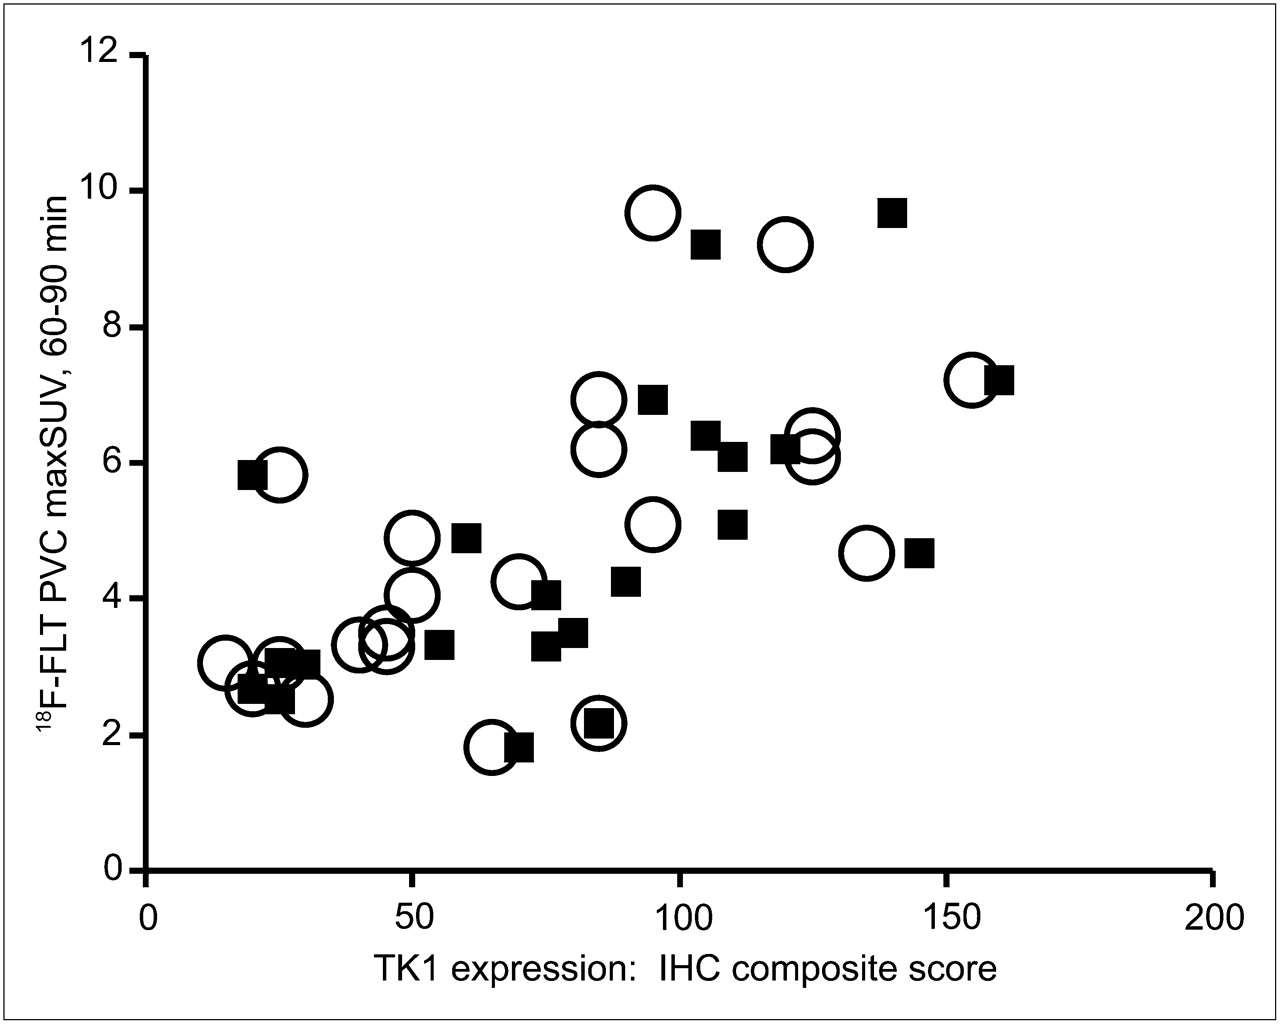
Relationship between PVC 18F-FLT maxSUV measured from 60 to 90 min (18F-FLT PVC maxSUV) and TK1 score of lung lesions. ○ = 18F-FLT PVC maxSUV vs. TK1 overall score (n = 22, ρ = 0.65, P = 0.001); ▪ = 18F-FLT PVC maxSUV vs. TK1 highest-proliferating-area score (n = 22, ρ = 0.68, P < 0.001). IHC = immunohistochemical.
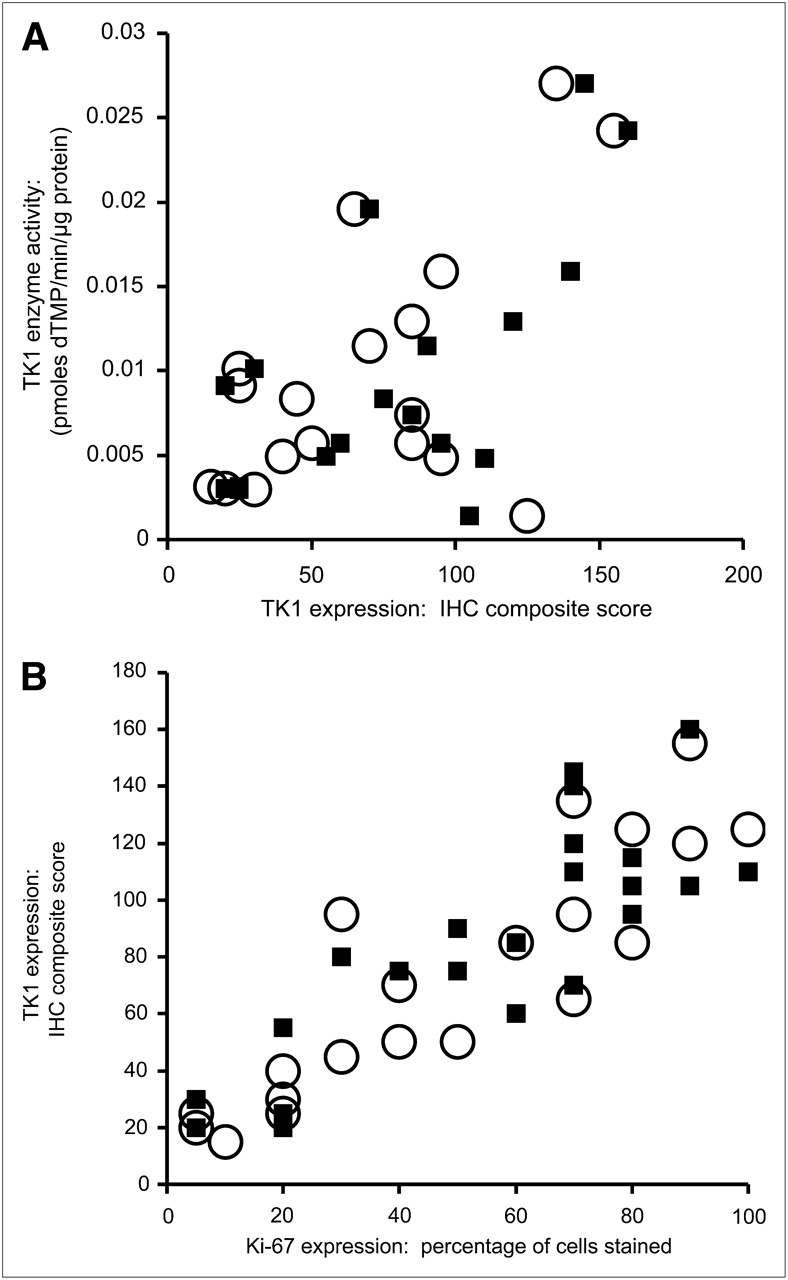
(A) Comparison of TK1 enzyme activity and TK1 protein expression. ○ = scoring of TK1 immunohistochemistry by overall averaging (n = 18, ρ = 0.41, P = 0.091); ▪ = scoring of TK1 immunohistochemistry by region of maximum staining (n = 18, ρ = 0.52, P = 0.029). (B) Comparison of TK1 protein expression and Ki-67 protein expression. ○ = scoring of immunohistochemistry for both proteins by overall averaging (n = 23, ρ = 0.89, P < 0.001); ▪ = scoring of immunohistochemistry for both proteins by region of maximum staining (n = 23, ρ = 0.83, P < 0.001). dTMP = deoxythymidine monophosphate; IHC = immunohistochemical.
We next performed a similar analysis for dynamic 18F-FLT data. We have previously reported the kinetic parameter definitions for the 2-compartment, 4-rate-constant model used in the current study (21,22). The mean and SD (n = 23) for all parameters are reported in Table 3. TK1 activity was not significantly correlated with any kinetic parameter measured in this study (Table 4), notably k3 (the rate constant for trapping 18F-FLT within the cell; ρ = 0.33, P = 0.160), which is widely assumed to represent TK1 enzyme activity trapping phosphorylated 18F-FLT within the cell. Normalizing k3 to the tissue distribution volume (Vd) also failed to reveal any correlation with TK1 activity. Expression of the TK1 protein measured by immunohistochemistry also did not correlate with k3 (overall scoring, ρ = 0.37, P = 0.103) or k3/Vd (overall scoring, ρ = 0.06, P = 0.801). However, a positive correlation between TK1 protein expression and KFLT was observed whether the immunohistochemical staining was scored overall (ρ = 0.53, P = 0.014) or by regions of maximal staining (ρ = 0.50, P = 0.020) (Fig. 5A). We also looked for relationships between kinetic parameters and proliferation. However, we did not observe any significant correlation between Ki-67 scoring and k3 or k3/Vd (Table 5), although expression of the Ki-67 antigen correlated positively with KFLT (overall scoring, ρ = 0.59, P = 0.005; region of maximum staining scoring, ρ = 0.63, P = 0.002) (Fig. 5B). We did not observe any significant correlations between TK1 activity or TK1 or Ki-67 expression versus tumor stage, size, or differentiation (data not shown).
TK1 Activity and TK1 Expression Scores Versus Kinetic Parameters: Summary of Correlative and Statistical Values

(A) Comparison of TK1 protein expression and KFLT. ○ = scoring of TK1 immunohistochemistry by overall averaging (n = 21, ρ = 0.53, P = 0.014); ▪ = scoring of TK1 immunohistochemistry by area of maximum staining (n = 21, ρ = 0.50, P = 0.020). (B) Comparison of Ki-67 protein expression and KFLT. ○ = scoring of Ki-67 immunohistochemistry by overall averaging (n = 21, ρ = 0.59, P = 0.005); ▪ = scoring of Ki-67 immunohistochemistry by region of maximum staining (n = 21, ρ = 0.63, P = 0.002). IHC = immunohistochemical.
Ki-67 Expression Scores Versus Kinetic Parameters: Summary of Correlative and Statistical Values
DISCUSSION
The present study in NSCLC patients further validates 18F-FLT as a proliferation tracer, finding correlations between expression of the proliferation marker Ki-67 and both static PVC maxSUV and the modeling flux constant KFLT. These findings extend those of previous studies in cell culture and animals in which 18F-FLT uptake has been correlated with various indices of proliferation (16).
The various cell cycle–dependent measurements used in this study were significantly correlated with each other. The expression of Ki-67 was correlated with the overall expression of TK1, and maximal TK1 expression and TK1 enzyme activity were correlated with each other. The values and ranges for TK1 enzyme activity in the current study agree well with the most comprehensive previously published study of TK1 activity in human lung tumors (24). These previous studies found correlations between TK1 activity and differentiation state, tumor doubling time, and tumor recurrence (24,25). However, in our study we did not find a correlation between either TK1 expression or activity and tumor differentiation status (data not shown).
It had been our expectation that TK1 activity might yield a stronger correlation with PVC maxSUV, KFLT, or k3 than immunohistochemical staining for the TK1 protein because of the rigorous posttranslational regulation of TK1 during the cell cycle (8,9). However, the cell cycle–dependent regulation of TK1 may be lost as a result of cell transformation (26,27) or TK1 overexpression (28). Recent studies indicate that the status of the p53 promoter can induce a state of differential cell cycle control in which TK1 activity becomes uncoupled from tumor proliferation (14) while remaining essential for competent DNA repair (29). p53 function may be compromised in as many as 50% of all human cancers, thus raising the possibility that 18F-FLT uptake may be more closely associated with tumor DNA repair than with tumor proliferation. In a recent study of 17 human oral squamous cell carcinomas, no relationship could be found between the expression of the TK1 protein and either proliferation indices or 18F-FLT maxSUV (17).
We did not detect significant correlations between the TK1 enzyme activity of the primary lesions and any of our static or dynamic parameters derived from 18F-FLT PET of those lesions. We consider here the following 3 possible explanations for this observation: sampling errors in the highly heterogeneous NSCLC tumors (23) may have prevented the detection of correlations, associations between TK1 activity and other endpoints were missed because our in vitro TK1 assay conditions did not reflect the full complexity of the in vivo relationships, and 18F-FLT uptake and retention may be dependent on a variety of factors in addition to TK1 activity. Evidence continues to accumulate indicating that the dependence of k3 on TK1 activity is not as simple as previously thought. Both the net flux of 18F-FLT into the cell (KFLT) and the rate of 18F-FLT trapping within the cell (k3) are dependent on the initial transport of 18F-FLT across the capillary wall and tumor cell membrane (K1). Therefore K1 can be a limiting factor causing k3 to correlate strongly with transport (30,31). Optimal transport of 18F-FLT into the cell is dependent on the activity of nucleoside transporters (NTs) as well as the serum concentrations of endogenous thymidine competing with 18F-FLT for binding to both the NTs and the catalytic site of the TK1 protein. Lung tumors express increased NTs with respect to normal lung, but this expression appears to be highly heterogeneous (32,33). All NTs characterized to date transport thymidine much better than they do 18F-FLT; therefore, when the low concentrations of serum 18F-FLT achieved in human 18F-FLT PET studies are considered in the context of the thymidine concentrations reported in human serum (34), it is possible that 18F-FLT uptake may be limited by transport. Although 18F-FLT is not a substrate for phosphorolysis by thymidine phosphorylase, the endogenous thymidine competing with 18F-FLT is, so thymidine phosphorylase activity, which has been shown to be elevated in a variety of tumor types including NSCLC (35), may also indirectly affect 18F-FLT uptake, as reported in rats undergoing 18F-FLT PET (36). Similarly, depletion of endogenous blood thymidine levels by coadministration of 5-fluoro-2′-deoxyuridine has been demonstrated to greatly enhance 18F-FLT uptake of human tumors xenografted into mice (37). These findings illustrate that a kinetic rate constant (e.g., k3) does not necessarily represent a discrete step in subcellular tracer movement and processing, which can be correlated with a single catalytic activity; each rate constant is potentially dependent on multiple catalytic activities and their respective substrate affinities for 18F-FLT relative to endogenous thymidine. Paproski et al. (38) found that in 5 of 6 human cancer cell lines tested, 18F-FLT uptake correlated strongly with the expression of the equilibrative transporter, hENT1. These authors have more recently demonstrated decreased 18F-FLT uptake and increased circulating thymidine in ENT1 knockout mice (ENT−/−), compared with ENT+/+ controls (39). In addition, metabolic trapping of 18F-FLT is presumed to be dependent on maintaining 18F-FLT in a phosphorylated state. Therefore, the relative activities of enzymes responsible for the catabolic dephosphorylation of phosphorylated 18F-FLT (as well as their respective affinities for endogenous phosphorylated thymidine vs. phosphorylated 18F-FLT) would also be expected to affect the values of all static and dynamic parameters (22). We have previously demonstrated the efflux of not only 18F-FLT but also trace amounts of 18F-FLT monophosphate (possibly via ATP-binding cassette transport pumps) from A549 human lung adenocarcinoma cells (3). In summary, our current findings, as well as data from several independent groups, suggest that tumor 18F-FLT uptake cannot be assumed to depend solely on tumor TK1 activity.
CONCLUSION
These findings suggest that 18F-FLT uptake may be influenced by factors in addition to TK1 activity, possibly including competition with endogenous thymidine, transport via NTs, degradative metabolism of phosphorylated metabolites, and rates of DNA repair.
DISCLOSURE STATEMENT
The costs of publication of this article were defrayed in part by the payment of page charges. Therefore, and solely to indicate this fact, this article is hereby marked “advertisement” in accordance with 18 USC section 1734.
Acknowledgments
We gratefully acknowledge Brigitte Munch-Petersen for valuable advice regarding in vitro assay of TK1 activity. This work was supported by NIH grants CA115559 and CA107264. No other potential conflict of interest relevant to this article was reported.
- © 2011 by Society of Nuclear Medicine
REFERENCES
- Received for publication February 22, 2011.
- Accepted for publication May 4, 2011.


Jump to section
Related Articles
Cited By...
- FLT PET/CT imaging of metastatic prostate cancer patients treated with pTVG-HP DNA vaccine and pembrolizumab
- Variability of Proliferation and Diffusion in Different Lung Cancer Models as Measured by 3'-Deoxy-3'-18F-Fluorothymidine PET and Diffusion-Weighted MR Imaging
- Prognostic and Therapeutic Impact of Argininosuccinate Synthetase 1 Control in Bladder Cancer as Monitored Longitudinally by PET Imaging
- PET Imaging of Proliferation with Pyrimidines
- Assessment of Cellular Proliferation in Tumors by PET Using 18F-ISO-1
- In Vivo Imaging of Cell Proliferation Enables the Detection of the Extent of Experimental Rheumatoid Arthritis by 3'-Deoxy-3'-18F-Fluorothymidine and Small-Animal PET
- Reply: Kinetic Analysis of 18F-FLT PET in Lung Tumors
- Kinetic Analysis of 18F-FLT PET in Lung Tumors