


Abstract
Silicon photomultiplier (SiPM; also called a Geiger-mode avalanche photodiode) is a promising semiconductor photosensor in PET and PET/MRI because it is intrinsically MRI-compatible and has internal gain and timing properties comparable to those of a photomultiplier tube. In this study, we have developed a small-animal PET system using SiPMs and lutetium gadolinium oxyorthosilicate (LGSO) crystals and performed physical evaluation and animal imaging studies to show the feasibility of this system. Methods: The SiPM PET system consists of 8 detectors, each of which comprises 2 × 6 SiPMs and 4 × 13 LGSO crystals. Each crystal has dimensions of 1.5 × 1.5 × 7 mm. The crystal face-to-face diameter and axial field of view are 6.0 cm and 6.5 mm, respectively. Bias voltage is applied to each SiPM using a finely controlled voltage supply because the gain of the SiPM strongly depends on the supply voltage. The physical characteristics were studied by measuring energy resolution, sensitivity, and spatial resolution. Various mouse and rat images were obtained to study the feasibility of the SiPM PET system in in vivo animal studies. Reconstructed PET images using a maximum-likelihood expectation maximization algorithm were coregistered with animal CT images. Results: All individual LGSO crystals within the detectors were clearly distinguishable in flood images obtained by irradiating the detector using a 22Na point source. The energy resolution for individual crystals was 25.8% ± 2.6% on average for 511-keV photopeaks. The spatial resolution measured with the 22Na point source in a warm background was 1.0 mm (2 mm off-center) and 1.4 mm (16 mm off-center) when the maximum-likelihood expectation maximization algorithm was applied. A myocardial 18F-FDG study in mice and a skeletal 18F study in rats demonstrated the fine spatial resolution of the scanner. The feasibility of the SiPM PET system was also confirmed in the tumor images of mice using 18F-FDG and 68Ga-RGD and in the brain images of rats using 18F-FDG. Conclusion: These results indicate that it is possible to develop a PET system using a promising semiconductor photosensor, which yielded reasonable PET performance in phantom and animal studies.
For γ-ray detection, most of the commercial PET systems use scintillation detectors in which the visible photons generated from scintillation crystals are detected by photosensors. The most common photosensor used in PET is a photomultiplier tube (PMT). This device has several advantages, including excellent gain (∼106) and stable operation against environmental effects, such as temperature. However, the bulkiness and sensitivity to an external magnetic field are the major disadvantages of the PMT in combined PET/MRI systems (1,2).
Compared with the PMT, the avalanche photodiode (APD) has a relatively compact size and is insensitive to magnetic fields. Because of these advantages, the APD is increasingly used in high-resolution PET detectors for small-animal or organ-specific imaging (3,4) and in the development of combined PET/MRI (5,6). Although the APD is a mature and established technique in PET detector development, low internal gain (102–103) and slow signal output are the known limitations of this device (2,7).
The silicon photomultiplier (SiPM; also called a Geiger-mode APD) is a promising alternative semiconductor photosensor in PET and PET/MRI because it is insensitive to magnetic fields, has internal gain and timing properties comparable to those of the PMT, and is a compact size (7,8). The SiPM is an array of APD microcells operated in the Geiger mode and connected in parallel to a common output. Thus, the output pulse amplitude of the SiPM is proportional to the number of light photons that are emitted by the scintillation crystal and interact with the microcells (9). Good linearity between the pulse amplitude and incident γ-ray energy can therefore be achieved if the number of light photons yielded from the crystal is proportional to the γ-ray energy and if the number of microcells is sufficiently large to avoid saturation of the device (10). In recent years, there has been a growing body of evidence on the feasibility of SiPM PET detectors for simultaneous PET/MRI (11), time-of-flight measurement (12), and depth-of-interaction determination (13). However, projects to implement the PET detection systems based on SiPM are still in an early stage.
In this study, a prototype SiPM PET system with a small ring diameter was developed and characterized to show the feasibility of SiPM for in vivo PET studies. The initial results of phantom and rodent studies will be presented in this report. To our knowledge, this is the first report on in vivo imaging with an SiPM-based PET system. The scope of this work was limited to exploring the possibility of SiPM PET, although we eventually plan to place our system in an MRI scanner.
MATERIALS AND METHODS
SiPM and Scintillation Crystal
The SSPM_0611B4MM_PCB solid-state photomultiplier (SSPM), an SiPM developed by Photonique SA that we have previously evaluated for its physical characteristics, including feasibility for simultaneous PET and MRI acquisition, was used in this study (11). The SSPM has a peak sensitivity at a wavelength of 440 nm, yielding a 25% single-photon detection efficiency. Efficient gain and the signal rise time given in the vendor specification are 0.6 × 10⁵ and 0.7 ns, respectively. The SSPM consists of 1,739 microcells with a fill factor of more than 70%. The active area of each cell is 50 × 50 μm. The sensitive area of each SSPM was 4.4 mm2. In our previous study, 1-to-1 coupling of this device and a lutetium yttrium oxyorthosilicate (LYSO) crystal yielded a 16% energy resolution and 1.3-ns coincidence timing resolution (11).
The scintillation crystal that we have used throughout this study is the lutetium gadolinium oxyorthosilicate (LGSO) crystal (Lu1.8Gd0.2SiO4: Ce; Hitachi Chemical Co., Ltd.). The LGSO crystal has shown outstanding performance in our previous investigations (14,15).
Evaluation of SiPM Characteristics
SiPMs use bias voltages (V) above the breakdown voltage (Vb) to achieve high gain, and the output charge of each microcell is proportional to V − Vb. In addition, Vb depends on the temperature (as the temperature rises, Vb increases). Therefore, the stability of the SiPM output signal depends mainly on the stability of the applied bias and temperature changes (8,9).
Experiments to test the operating stability and basic characteristics of SiPMs have been performed. A blue light–emitting diode (LED) was used to illuminate the SiPMs with a pulse duration of 25 ns and a frequency of 100 Hz through an optical filter. The SiPM, LED, and optical filter were placed in a light-tight box to prevent interference from environmental light. The pulse generator outputs used to produce the LED signals were also triggered to generate gate pulses with 400-ns width, during which the SiPM signal was integrated using a charge-to-digital converter (QDC) module.
For each of a total of 140 SiPMs, the stability of the output signal as a function of time was observed, and the bias voltage to generate the same QDC output level (2,000 QDC = 400 pC) was determined. The relationship between the bias voltage and its QDC output was also evaluated.
Detector Module
The PET detector module developed in this study consists of a 4 × 13 array of LGSO crystals and a 2 × 6 SiPM array. The SiPM array was built by soldering each single channel SiPM onto the printed circuit board. The dead space between the sensitive areas of SiPMs was 2 mm between each column of the SiPM array and 1 mm between each row. Each crystal, with a dimension of 1.5 × 1.5 × 7.0 mm, was optically separated using a grid of an enhanced spectral reflector polymer (3M) with a 0.065-mm thickness (14,16). The pitch between the crystals was 1.65 mm on average, resulting in a packing fraction of 85% for a detector module. Because the size of the front surface of the crystal did not match the sensitive area of the SiPM, and there was a dead space between the SiPMs due to the packaging, a 3-mm quartz was inserted between the LGSOs and the SiPMs for light sharing. The quartz thickness was optimized through the GEANT4 Monte Carlo simulation and experiments. In these optimization studies, 4 different quartz thicknesses were tested (2.0, 2.5, 3.0, and 3.5 mm), and the 3.0-mm thickness was selected as optimal because it yielded the most uniform distances between the crystal peaks in the flood image and light output from crystals. Optical grease (Bicron BC-630; Saint-Gobain Ceramics) with a refractive index of 1.463 was placed at the interfaces (SiPM/quartz and quartz/crystal).
Each block of LGSO/quartz/SiPM was housed using a custom-built polyoxymethylene case for stable coupling and positioning and was connected to a custom-made preamplifier board. Gap spacing between the detector modules (distance between the edges of LGSO crystal arrays) was 4.3 mm, resulting in the overall packing fraction of 71% for the detector system.
Readout Electronics
The readout electronics developed in this study consist of a preamplifier board, a position-encoding board, and a digitally controlled voltage supply board. The preamplifier board consists of 12 charge-sensitive preamplifiers, and each mounted SiPM was connected to an individual preamplifier (gain, ∼25 V/V). Each electrical component was optimized through the waveform analysis of the SiPM signal. On the position-encoding board, the 12 preamplifier outputs are encoded into the 4 channels using a set of 2 linear resistive charge-division circuits (Supplemental Fig. 1). In each linear charge-division circuit, the ratio of the column sum of each signal was used to calculate the x position in the crystal block. The y position was calculated by the ratio of the sum in each linear charge-division circuit. The sum of 4 position signals was used for event triggering. Figure 1A shows an assembly of the detector block and the preamplifier and position-encoding boards.

SiPM detector and prototype camera. (A) Assembly of LGSO/SiPM detector block and preamplifier and position-encoding boards. (B) Configuration of SiPM PET system.
The high sensitivity of the SiPM output amplitude to the applied bias voltage has demanded a finely adjustable and stable supply of operating voltage. Therefore, we have developed a digitally controlled voltage supply board with which we can provide the bias voltage to the SiPM with a fine precision of 0.01–0.1 V in 64 steps through the step-size variable resistor with electrically erasable programmable read-only memory (DS3906; Maxim Integrated Products). In addition, a temperature sensor (TCN75; Microchip Technology Inc.) was added in this module to continuously monitor the temperature change because the gain of the SiPM is also dependent on the temperature (gain and breakdown voltage variation, ∼1.5%/°C). The dedicated software was designed to store the relationship between the optimal bias voltage to generate the same QDC output and temperature in a lookup table and to make bias voltage adjustable if the temperature changed.
Prototype PET system
Figure 1B and Supplemental Figure 2 show the assembly and schematic of the prototype PET system consisting of 8 detectors. The crystal face-to-face diameter is 6.0 cm, and the distance provides the transaxial field of view (FOV) suitable for imaging mice. The axial FOV is 6.5 mm through 4 crystal rings (n) and 7 transaxial slices (2n − 1). Each crystal ring consists of 104 (13 × 8) crystal elements. The bias voltage determined during the “Evaluation of SiPM Characteristics” section for each SiPM was applied.
The output signals from position-encoding boards were measured using a nuclear instrumentation module (NIM; N486 [CAEN]), VERSAModule Eurocard (VME; V775 [CAEN]), and custom-built coincidence module implemented using a field-programmable gate array (FPGA; Spartan 3 [Xilinx]) (17).
Spatial Resolution and Sensitivity
All PET data in this study were acquired with an energy window of 400–600 keV and 2-ns coincidence window, except for the sensitivity measurement, in which the 3 different energy windows were applied (250–750, 350–650, and 400–600 keV).
Spatial resolution and sensitivity were measured using a 22Na point source embedded in a clear acrylic disk (Isotope Products Laboratories). To measure the intrinsic spatial resolution of a detector pair, the point source (nominal diameter, 0.25 mm; activity, 230 kBq) was placed at the center of a pair of detectors and moved in the transverse direction with a step size of 0.15 mm. At each location, 0.2 million coincidence counts were obtained. The coincidence counts between the individual pairs of exactly opposed crystals were plotted as a function of the source position. The count distribution of each crystal pair was fitted with a gaussian function to determine the full width at half maximum (18,19).
The same point source was used to measure the spatial resolution of reconstructed images. The point source was positioned at a 2-mm radial offset from the center of the second crystal ring and was moved in a radial direction to 16 mm with a 2-mm step size. The spatial resolution was measured as the radial and tangential full width at half maximum, which was estimated using linear interpolation (20,21).
Sensitivities were calculated as the ratio of the coincidence counting rate and the rate at which the γ-ray pairs are emitted from the point source. A 2.96-MBq 22Na point source was moved to the axial range of −2.475 to 2.475 mm with a 0.825-mm step size (half-length of the crystal pitch). The activity was corrected for the 22Na branching ratio of 0.906 (20).
Phantom Study
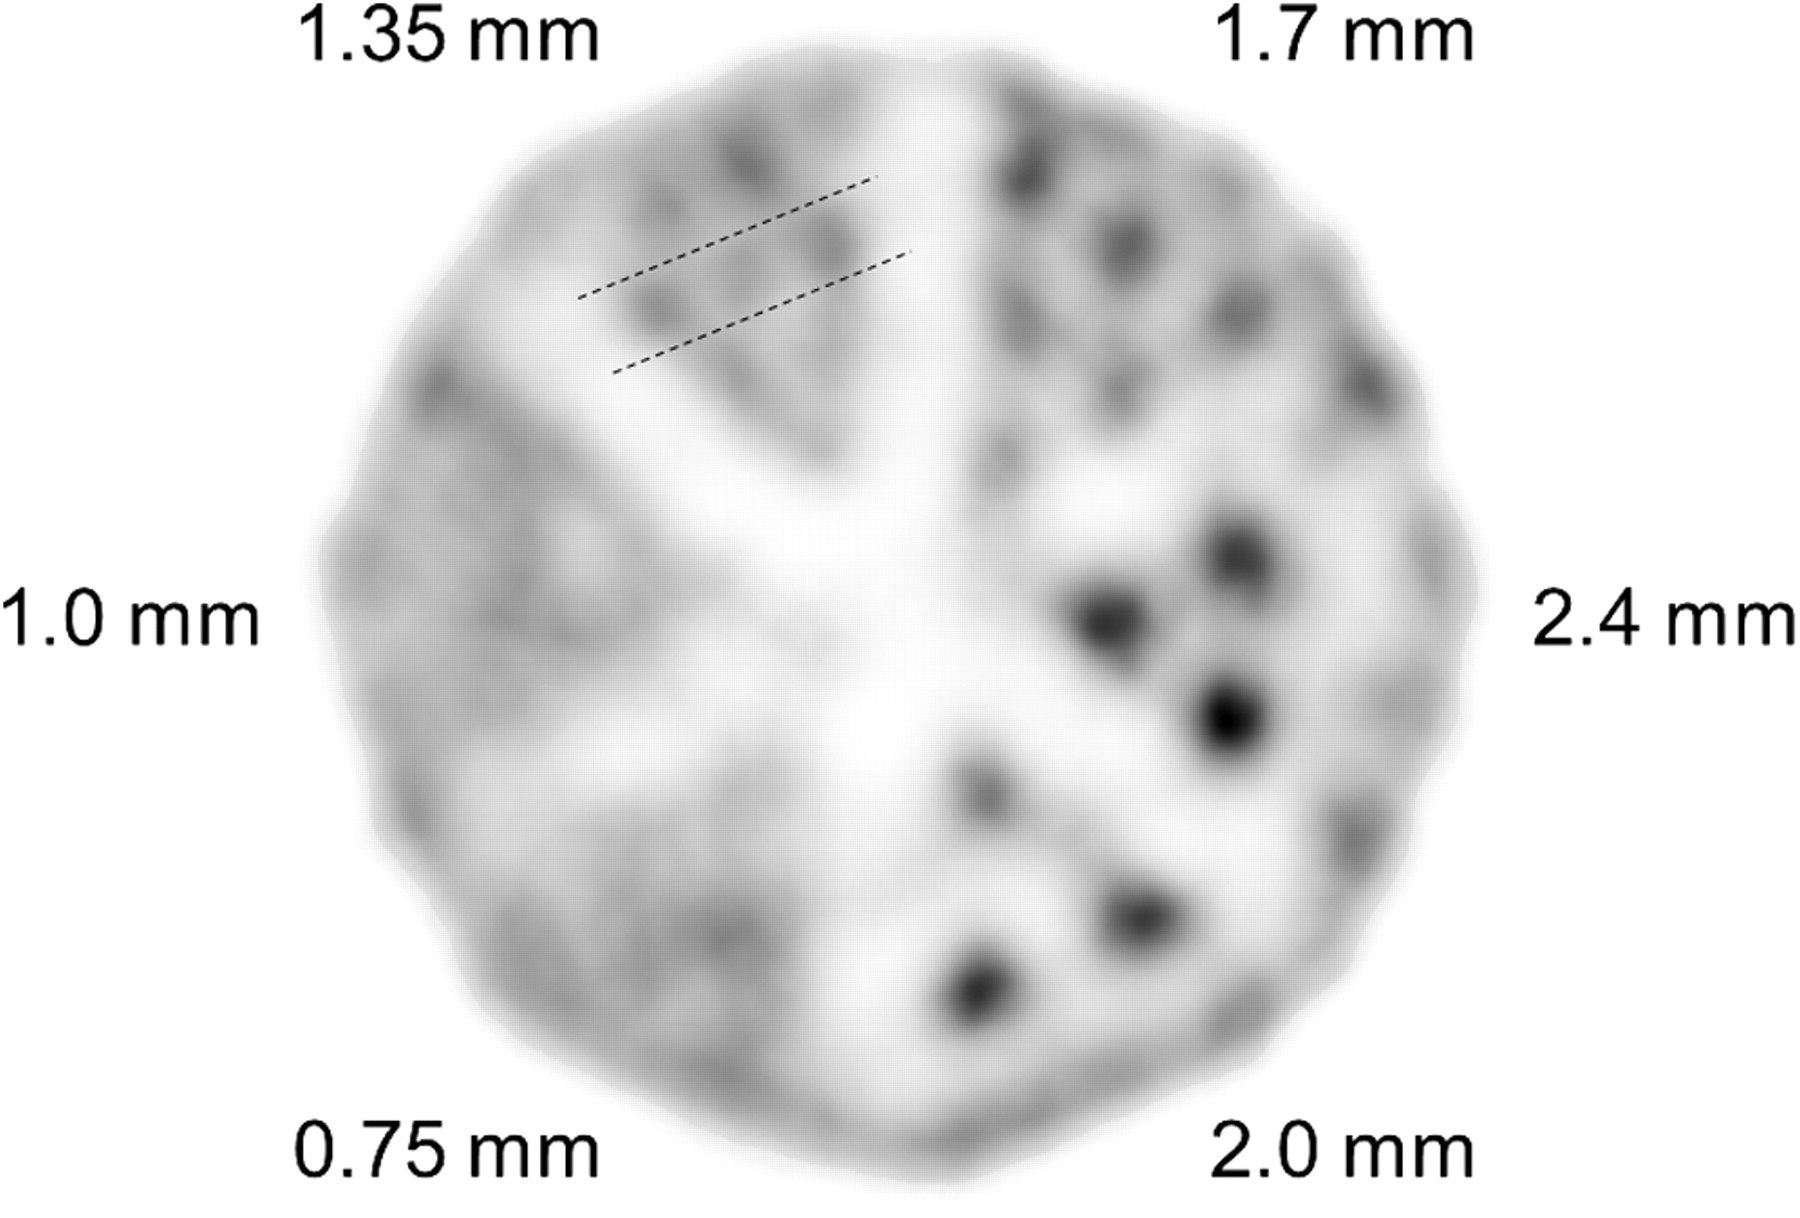
An Ultra-Micro Hot Spot Phantom (inner diameter, 2.8 cm; height, 2.8 cm; Data Spectrum Corp.) with hot hollow channels of different diameters (0.75, 1.0, 1.35, 1.7, 2.0, and 2.4 mm) arranged in 6 segments was scanned. The phantom was filled with 37 MBq (1 mCi) of 18F solution and scanned for 4 h. Uniform cylinder PET data were acquired using the same phantom without the insert. The same scan time and activity were used.
Animal Studies
To investigate the feasibility of the system for small-animal studies, mouse and rat studies were performed. All animal studies were approved by the Institutional Animal Care and Use Committee at Seoul National University. During the PET experiments, the animals were anesthetized by the continuous administration of isoflurane in oxygen.
An 18F-FDG scan was acquired of a 22.2-g BALB/c mouse bearing a murine colon carcinoma cell line (CT26) on the right shoulder. Thirty-three megabecquerels (880 μCi) of 18F-FDG were injected intravenously, and 50 min later a 35-min list-mode dataset was acquired. A myocardial 18F-FDG scan was also acquired of another 24.5-g BALB/c mouse for 63 min. The scan was started 46 min after intravenous injection of 16.3 MBq (440 μCi).
A bone PET image of a 391-g Sprague–Dawley rat was acquired for 48 min. The PET scan was started 37 min after the intravenous injection of 48.5 MBq (1.31 mCi) of 18F.
An 18F-FDG scan of a rat brain was also acquired. A 352-g Sprague–Dawley rat was positioned in the scanner with its brain centered in the FOV. 18F-FDG (36.6 MBq [990 μCi]) was injected intravenously, and 70 min later 60 min of a list-mode dataset was acquired.
Finally, a 68Ga-RGD (angiogenesis PET agent) scan of a 24.8-g BALB/c nude mouse bearing a malignant glioma cell line (U87MG) on the left shoulder was acquired for 51 min. The PET scan was started 15 min after the intravenous injection of 33.5 MBq (0.91 mCi) of 68Ga-RGD (22,23).
After the PET scan of each animal, the animal bed with the animal attached was manually transferred to an eXplore VISTA PET/CT scanner (GE Healthcare) (18) to acquire a CT scan. The PET and CT data were coregistered and superimposed manually using software for functional image registration (FIRE; Seoul National University) (24).
We compared the PET images acquired using our SiPM PET system and the eXplore VISTA. Fifty-seven minutes after the intravenous injection of 42.1 MBq (1.14 mCi) of 18F into a 321-g Sprague–Dawley rat, the head of the rat was scanned using the eXplore VISTA for 10 min. Immediately after the scan, a 60-min PET scan was acquired using the SiPM PET system. eXplore VISTA PET data were reconstructed using the 2-dimensional ordered-subsets expectation maximization algorithm.
Data Processing
For normalization correction, normalization scans were acquired using a cylindric phantom (inner diameter, 49 mm; height, 20 mm) filled with 18F covering the entire FOV. Compensation for different source thicknesses was applied to each line of response in the normalization data. The list-mode dataset was sorted into a 3-dimensional sinogram and then rebinned into 2-dimensional data using the single-slice rebinning algorithm.
All scanned PET data were reconstructed using maximum-likelihood expectation maximization with exact position information for each line-of-response element. An isotropic gaussian filter with a 0.5-mm full width at half maximum was applied to the reconstructed images, except for the spatial resolution measurement.
To avoid overestimation of the spatial resolution measurement, uniform background data acquired using a cylindric phantom were added to the point source data before reconstruction (25).
RESULTS
Evaluation of SiPM Characteristics
Most tested SiPMs (129/140) yielded stable QDC output values (Supplemental Fig. 3A). In Supplemental Figure 3A (an example of QDC output values from one of the stable SiPMs) the x-axis represents the event order that is proportional to the elapsed time because we applied light pulses with a constant pulse frequency. The total duration shown in Supplemental Figure 3A is 1,000 s. The distribution of the QDC output acquired from a stable SiPM had a typical gaussian shape. On the other hand, the remaining 11 SiPMs resulted in an inconsistent time-varying output (Supplemental Fig. 3B) and were excluded in the further construction of detectors.
Each SiPM required a different bias voltage to produce the same level of QDC output. In addition, this voltage had a relatively wide distribution (Supplemental Fig. 3C). Supplemental Figure 3D shows the relationship between the QDC output and the applied bias voltage obtained in a representative SiPM.
All these measurements were performed at room temperature (26°C).
Intrinsic Properties of Detector
Figure 2A shows the flood image, which was obtained by irradiating the LGSO/SiPM detector for 12 h using the 370-kBq 22Na point source located 10 cm away from the detector center. All crystals are clearly distinguishable. From the flood image, the crystal map was generated semiautomatically by searching the local peaks in the flood image and calculating the minimum distance from the peaks (15). In the flood image, corner crystals are darker than the center crystals, possibly because of crystal interference effects and a smaller solid angle of source irradiation.

Intrinsic properties of detector. (A) Flood map acquired using LGSO/SiPM detector. (B) Energy spectra of all 52 crystals in this detector.
Figure 2B shows, for each crystal element, an energy spectrum that was calculated by accumulating the events that reach the corresponding crystal position in the crystal map. In the energy spectrum of each crystal, the photopeak region was separated from the scattered events. The energy resolution for an individual crystal was 25.8% ± 2.6% on average for 511-keV photopeaks.
Spatial Resolution and Sensitivity
Figure 3A shows the sensitivities with various energy windows. The central plane had maximum sensitivity at each energy window (0.085%, 0.057%, and 0.040% for energy windows of 250–750, 350–650, and 400–600 keV, respectively).

Physical performance of SiPM PET system. (A) Sensitivity values measured at various axial offsets (•: 250–750 keV; ▪: 350–650 keV; ▴: 400–600 keV). (B) Spatial resolution values measured at various radial offsets (•: tangential; ▪: radial).
The intrinsic spatial resolution of a typical detector pair was 1.30 mm on average (range, 1.19–1.49 mm). Figure 3B shows reconstructed image spatial resolutions. The spatial resolution was estimated after subtracting the background from the maximum-likelihood expectation maximization reconstruction image with 32 iteration numbers and corrected for blurring by source diameter. The data show that 1.0-mm (2 mm off-center) and 1.4-mm (16 mm off-center) spatial resolutions (average of tangential and radial resolutions) can be obtained using our SiPM PET system.
Phantom and Animal Studies
Figure 4 shows a transaxial image (slice thickness, 0.825 mm) of the Ultra-Micro Hot Spot Phantom. Spots with diameters 1.7 mm or larger were distinguishable. Although the 1.35-mm hot spots were identifiable, the separation from the background was not clear. The profile through the 1.35-mm hot spots is shown in Supplemental Figure 4. A transaxial image of the uniform cylinder phantom is shown in Supplemental Figure 5.

Image of Ultra-Micro Hot Spot Phantom with 6 hollow channels. Lines indicate position of profile shown in Supplemental Figure 4.
Figure 5A shows the images of a mouse bearing a colon carcinoma scanned after injection of 18F-FDG (Supplemental Fig. 6 shows the coronal and sagittal fusion images). Higher 18F-FDG uptake in the tumor region than in the contralateral normal tissues was well visualized in these images. The region without activity was necrotic at the center of the tumor (tumor size, ∼1 cm). Figure 5B shows the 68Ga-RGD PET image of a mouse bearing a malignant glioma cell line (an angiogenic tumor) on the left shoulder, which reveals high uptake of 68Ga-RGD.

Tumor imaging in mice. (A) 18F-FDG PET study in mouse bearing colon carcinoma (arrow). (B) 68Ga-RGD PET study in mouse bearing malignant glioma cell line (arrow).
Short-axis 18F-FDG myocardial PET images acquired without electrocardiogram gating in a mouse are shown in Figure 6. 18F-FDG uptake in the left ventricular myocardium is resolved well in these images, demonstrating that this prototype camera has fine spatial resolution, which is confirmed by the profile image shown in Supplemental Figure 7. The truncation of images in Figure 6 is due to reorientation of the images to obtain short- and long-axis views.

Short-axis 18F-FDG myocardial PET images acquired without electrocardiogram gating in a mouse. Line on fourth plane indicates position of profile shown in Supplemental Figure 7.
Figure 7A shows the 18F bone PET image of a rat head region. The 18F activity is well localized in the skeletal structures, as shown in the fusion image. Figure 7B shows the results of a rat brain 18F-FDG PET study. The 18F-FDG uptake in the brain matches well with the brain areas shown on CT.

PET images of rats. (A) 18F bone PET study of rat head region. (B) 18F-FDG PET study of rat brain.
Supplemental Figure 8 shows the 18F bone PET images acquired in the same rat using our SiPM PET system and a PMT-based eXplore VISTA scanner, indicating that equivalent PET images can be obtained using these scanners.
DISCUSSION
There are several reasons that SiPM is gaining attention as a promising photosensor in nuclear medicine imaging devices (9). There is no doubt that the PMT is a current workhorse in these devices. However, the PMT is not suitable for making compact-size, MRI-compatible, or low-priced devices because of its relatively complex structures (7). Although these disadvantages of PMT can be overcome by use of the APD, it is hard to reduce the manufacturing costs of the APD, because the APD requires a nonstandard complementary metal–oxide–semiconductor production process (1). In contrast, there is adequate room for reducing the manufacturing costs of the SiPM because it can be produced in a standard complementary metal–oxide–semiconductor process, unlike the APD (7,26). The reduction in the SiPM price over the last several years would be evidence of this possibility. In addition to many technical advantages mentioned previously (high internal gain, fast response, small size, low power consumption, and magnetic tolerance), the potential low price of the SiPM would be the main motivation of the current active research on SiPM production and its application.
Clinical whole-body PET systems currently have an axial extent of only 15–20 cm, which is much shorter than the axial FOV that must be scanned in whole-body studies. This is the main reason why current clinical PET systems yield a sensitivity of less than 1% and require a scan time of at least 5 min for whole-body examinations. Although substantial gains in sensitivity and noise-equivalent counting rates are possible by extending the axial length of the PET system (27), an increase in the production cost of such a system is a practical limiting factor. Accordingly, if, in the future, the expensive PMT and APD can be replaced by a low-priced SiPM, it will be highly useful for elongating the axial length and increasing the sensitivity and noise-equivalent counting rates of PET. Improvements in the area of sensitivity, which is a current limitation of SiPM, will also lead to improvements in noise-equivalent counting rate through enhancement of the energy and timing resolution. Moreover, the increased sensitivity and noise-equivalent counting rate will dramatically reduce scanning time and radiopharmaceutical use.
In addition, the excellent timing properties of the SiPM would bring about good PET image quality. In a previous study, we showed a 1-ns coincidence timing resolution using LYSO/SiPM detector pairs (11). Moreover, there is increasing evidence that SiPM is feasible for time-of-flight measurement (8,28). A coincidence timing resolution of 240 ps can be achieved with LYSO and multipixel photon counter (MPPC, the SiPM provided by Hamamatsu Photonics) couplings under optimal conditions of bias voltage and temperature (12). Recently, investigators at Philips Corporate Technologies have introduced the concept of digital SiPM, which yielded a 153-ps timing resolution for LYSOs (29).
In the current LGSO/SiPM PET system, the energy resolution of the 511-keV photopeaks was 25.8% on average for 416 crystals, which is similar to the previously reported 26% (19) and 23% (30) energy resolutions for the first commercial LSO/PMT-based animal PET scanners (microPET P4 and R4, respectively; Siemens Medical Solutions). This energy resolution is worse than the 16% that was measured using a single SiPM coupled directly with the LYSO in our previous study (11). The degradation of energy resolution may be the result of optical cross-talk, which occurs mainly through the 3-mm quartz inserted between the crystal and SiPM arrays for light sharing, and the different photon detection efficiencies and amplification gains of SiPMs.
The axial FOV of this prototype is 6.5 mm through 4 crystal rings, resulting in the low sensitivity at the center (0.085% for an energy window of 250–750 keV). Although this length would not degrade the feasibility of SiPM PET as demonstrated in this proof-of-concept study, this length is not sufficient for routine animal scans. The rapid advances in the development of array-type SiPMs (i.e., MPPC S11064 [Hamamatsu Photonics] and SPM 3035G16 [SensL]) offer the possibility of devising larger-scale PET scanners with a sufficiently long axial FOV. We plan to use multiple rings of array-type SiPMs to extend the axial FOV and improve the sensitivity in our next version of the SiPM PET system, which will be developed for in vivo PET/MRI.
In this study, we used 7.0-mm-long LGSO crystals so as not to cause parallax errors for obliquely incident γ-rays, although we knew that the detection efficiency for 511-keV γ-rays obtained with this crystal length would not be high enough. To enhance sensitivity by elongating crystals, depth-of-interaction determination within crystals will be necessary to avoid the deterioration in spatial resolution uniformity (31). Several groups have shown that depth-of-interaction encoding with SiPM is feasible (13). Implementing the depth-of-interaction encoding methods suggested by our group (14,16,32) will also be possible using the SiPM arrays.
Fine image spatial resolution (1.0 mm at 2 mm off-center) measured from the maximum-likelihood expectation maximization-reconstructed images of the background added point source data that has been confirmed in small-animal studies. As shown in Supplemental Figure 8, 18F bone PET images of rat skull acquired using the SiPM PET system showed an equivalent level of image blurring and anatomic delineation of bone structures to the eXplore VISTA, which has a crystal surface area (1.45 × 1.45 mm2) similar to that of our system (1.5 × 1.5 mm2), although the SiPM PET system required a longer scan time due to the lower sensitivity (10 min for eXplore VISTA vs. 60 min for SiPM PET system). The nongated mouse myocardial PET images shown in Figure 6 also demonstrate the fine spatial resolution. The images are comparable to those obtained using commercial PMT-based animal PET, such as the eXplore VISTA (Fig. 6 in Wang et al. (18)) and Inveon (Siemens; Fig. 7 in Bao et al. (33)).
CONCLUSION
All individual LGSO crystals were clearly distinguishable in flood images, resulting in the energy resolution for individual crystals of 25.8% ± 2.6% on average for 511-keV photopeaks. A typical detector pair yielded an intrinsic resolution of 1.30 mm. The reconstructed image spatial resolution was 1.0 mm (2 mm off-center) with the maximum-likelihood expectation maximization reconstruction algorithm. A myocardial 18F-FDG study in mice and a skeletal 18F study in rats demonstrated the fine spatial resolution of the scanner. The results obtained in this study indicate that it is possible to develop a PET system using a promising semiconductor photosensor that yields reasonable PET performance in phantom and animal studies.
Acknowledgments
This work was supported by grants from the Atomic Energy R&D Program (2008-2003852 and 2010-0026012) and the WCU Program (R32-10142) through the KOSEF funded by the Korean Ministry of Education, Science and Technology. Preliminary results of this work, including the first point source image acquired using the SiPM PET system, were presented at the 56th annual meeting of the Society of Nuclear Medicine (34).
- © 2011 by Society of Nuclear Medicine
REFERENCES
- Received for publication May 31, 2010.
- Accepted for publication December 28, 2010.


