


Abstract
The most investigated semiconductor photosensor for MRI-compatible PET detectors is the avalanche photodiode (APD). However, the silicon photomultiplier (SiPM), also called the Geiger-mode APD, is gaining attention in the development of the next generation of PET/MRI systems because the SiPM has much better performance than the APD. We have developed an MRI-compatible PET system based on multichannel SiPM arrays to allow simultaneous PET/MRI. Methods: The SiPM PET scanner consists of 12 detector modules with a ring diameter of 13.6 cm and an axial extent of 3.2 cm. In each detector module, 4 multichannel SiPM arrays (with 4 × 4 channels arranged in a 2 × 2 array to yield 8 × 8 channels) were coupled with 20 × 18 Lu1.9Gd0.1SiO5:Ce crystals (each crystal is 1.5 × 1.5 × 7 mm) and mounted on a charge division network for multiplexing 64 signals into 4 position signals. Each detector module was enclosed in a shielding box to reduce interference between the PET and MRI scanners, and the temperature inside the box was monitored for correction of the temperature-dependent gain variation of the SiPM. The PET detector signal was routed to the outside of the MRI room and processed with a field programmable gate array–based data acquisition system. MRI compatibility tests and simultaneous PET/MRI acquisitions were performed inside a 3-T clinical MRI system with 4-cm loop receiver coils that were built into the SiPM PET scanner. Interference between the imaging systems was investigated, and phantom and mouse experiments were performed. Results: No radiofrequency interference on the PET signal or degradation in the energy spectrum and flood map was shown during simultaneous PET/MRI. The quality of the MRI scans acquired with and without the operating PET showed only slight degradation. The results of phantom and mouse experiments confirmed the feasibility of this system for simultaneous PET/MRI. Conclusion: Simultaneous PET/MRI was possible with a multichannel SiPM-based PET scanner, with no radiofrequency interference on PET signals or images and only slight degradation of the MRI scans.
A hybrid PET/MRI scanner has many potential advantages, including a reduced radiation dose, better soft-tissue contrast on MRI than CT, an almost unlimited combination of functional and molecular information, and possible motion correction of the PET image using MRI data (1–4). However, simultaneous PET/MRI with a conventional photomultiplier tube (PMT)–based PET camera is technically challenging, because the PMT is highly sensitive to the magnetic field. Almost every property of the PMT PET signal is distorted within the magnetic field. For example, the energy spectrum of the PET detector is quite diminished because of the loss of PMT signal output, and the peak position of the scintillation crystal cannot be distinguished in the flood maps of block detectors (1). Therefore, if relatively long optical fiber bundles are not used, the PMT PET camera should be placed a distance from the MRI machine (5). Consequently, a longer scan time is required, patient throughput is low, and the chance of patient movement increases with this type of PET/MRI scanner.
In contrast, semiconductor photosensors are not susceptible to electromagnetic interference because the electrical signal pathways in these devices are much shorter than in the PMT. The most investigated semiconductor photosensor for MRI-compatible PET detectors is the avalanche photodiode (APD). The feasibility of APD PET inserts for small-animal and human brain PET/MRI studies has been shown by several groups (6–9), and the first commercial APD PET/MRI scanner for whole-body imaging has recently been introduced.
Although the APD PET detector is a mature technology, it has known limitations, including a lower gain of signal amplification and inferior timing resolution compared with PMT. Alternatively, the silicon photomultiplier (SiPM)—also called the Geiger-mode APD, solid-state photomultiplier, multipixel photon counter (MPPC)—is gaining much attention as a promising photosensor for future PET/MRI systems, because it is insensitive to the magnetic field and has amplification gain and timing resolution equivalent to those of the PMT (10–12). Therefore, several groups, including us, have worked on the development of SiPM PET detectors and systems (13–19).
Recently, we have shown the feasibility of our first SiPM PET prototype for small-animal imaging (18). The first prototype system consisted of 8 SiPM detector modules composed of 4 × 13 Lu1.9Gd0.1SiO5:Ce (LGSO) crystals and 2 × 6 SiPMs, and it had a ring diameter of 6.0 cm and an axial field of view (FOV) of 0.65 cm. Although this system showed excellent 1.0-mm spatial resolution, its sensitivity (<0.1%) and energy resolution (26%) were not good enough for routine animal imaging studies. Therefore, to improve the performance of SiPM PET, we have created a second version of the system, which enables simultaneous PET/MRI acquisition. In this second scanner, we are using a multichannel SiPM (MPPC; Hamamatsu Photonics) to extend the ring diameter and the axial FOV to 13.6 and 3.2 cm, respectively.
We describe here the MRI-compatible SiPM PET scanner and present the initial results of simultaneous PET/MRI experiments on phantoms and a living animal to demonstrate the feasibility of our new system.
MATERIALS AND METHODS
PET Detector Module
The scintillation crystal used in the PET detector module was LGSO (Hitachi Chemical). We chose LGSO because it has a fast scintillation decay time (τ = 41 ns), good stopping power (μ = 0.85 cm−1 at 511 keV), and high light output. It has yielded outstanding performance in our previous investigations (18,20), and its MRI compatibility was confirmed (21). The LGSO array consists of 360 (20 × 18) crystals (Supplemental Fig. 1A; supplemental materials are available online only at http://jnm.snmjournals.org), each measuring 1.5 × 1.5 × 7.0 mm3. A grid of enhanced spectral reflector polymer (3M) with 0.065-mm thickness was used to construct the crystal array and optically isolate each crystal, yielding a crystal pitch of 1.62 mm.

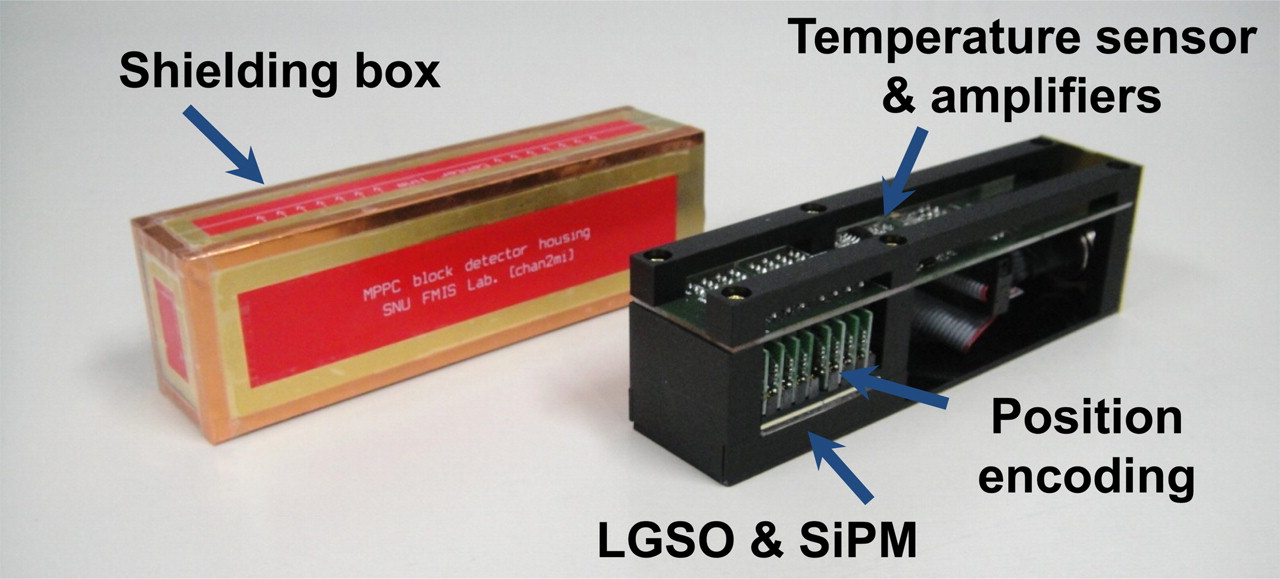
SiPM detector module and shielding box.
The SiPM used in this study was the MPPC array with 4 × 4 channels (S11064-050P; Hamamatsu Photonics) made up of individual SiPM chips with 3 × 3 mm active areas and mounted at high densities on surface-mounted devices. The specifications of S11064-050P are summarized in Table 1. We chose the S11064-050P because it has an appropriate spectral response (photon detection efficiency at the required wavelength) and number of pixels per channel in combination with LGSO crystals (Hamamatsu Photonics; datasheet of MPPC S11064 series). For each detector module, 4 S11064-050Ps were combined to yield 8 × 8 SiPM channels, as shown in Supplemental Figure 1B. Four S11064-050Ps for each module were carefully selected to yield the minimal variability in optimal operating bias voltages (bias voltage to yield an amplification gain of 7.5 × 10⁵, typically 71.4 V) across the 64 SiPM channels. Thus, the SD of optimal bias voltage for SiPM was less than 0.03 V in all detector modules.
Specification of SiPM (MPPC S11064-050P)
Soft polyvinyl chloride (Sunil) with 1.0-mm thickness was inserted between the 20 × 18 LGSO and 8 × 8 SiPM arrays for light spreading. Optical grease (BC-630; Saint-Gobain) with a refractive index of 1.46 was then applied to the interface between them.
Front-End Electronics
An average optimal bias voltage of 64 SiPMs was applied to each detector module. The 8 × 8 SiPM output channels were connected to the position encoding circuit, which consisted of a resistive charge division network (RCN) with a 64:4 multiplexing ratio and differential amplifiers (Fig. 1). Because we directly connected the SiPM chips to the RCN without the use of a preamplifier to make the detector module as compact as possible, each SiPM channel has a different input impedance. Therefore, the resistor values of the charge division circuit were determined to match the input impedance from each SiPM channel using PSpice software (OrCAD; Cadence) for simulation of SiPM and RCN.
For continuous monitoring of the temperature change in the detector module, a solid-state temperature sensor (TCN75; Microchip Technology) with a temperature accuracy of 0.5°C was placed next to the SiPM sensors. A dedicated temperature-monitoring program developed previously (18) was used to collect and record the temperature data every second via serial interface with TCN75. We used this measured information to compensate for the temperature-dependent gain variation of SiPM sensors, by scaling the analog-to-digital converter (ADC) output retrospectively.
MRI-Compatible PET Scanner
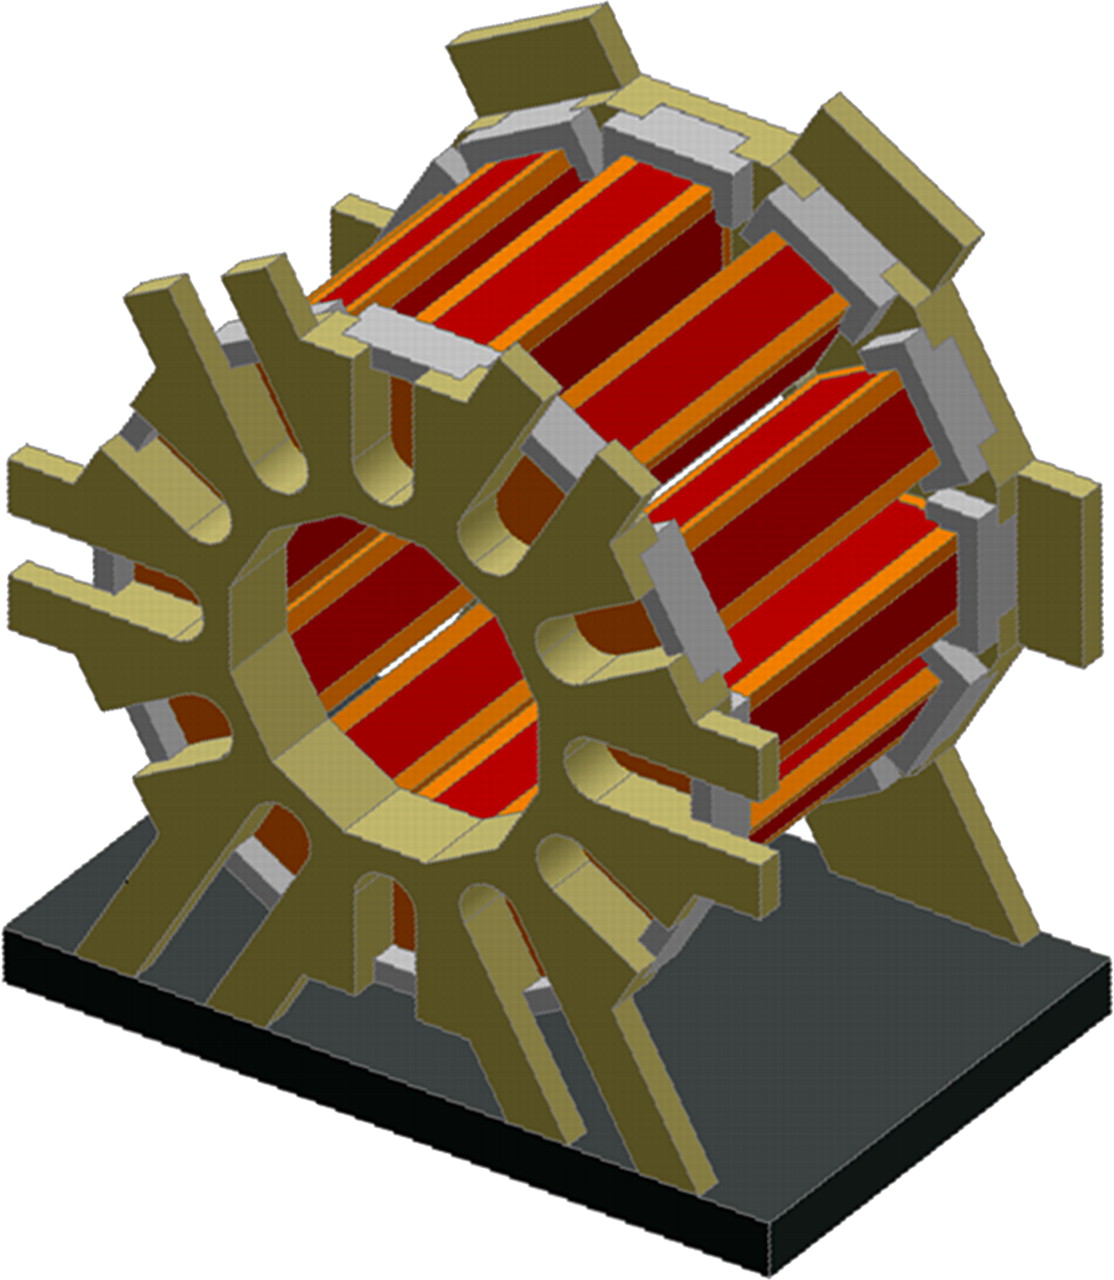
Each detector module was enclosed in a dual-layer copper shielding box (thickness of the each copper layer was 18 μm, determined by radiofrequency skin-depth calculation) to block the interference between the PET and MRI systems. The shielding boxes were connected to an electrical ground. We electrically isolated copper shielding boxes from each other to minimize the induction of eddy currents, which are generated to compensate for magnetic field changes on the surface of the shielding box (Fig. 1). As shown in Figure 2, 12 detector modules were arranged in a ring shape with a 13.6-cm distance between the front surfaces of the opposite detector modules (Table 2).

MRI-compatible SiPM PET scanner consisting of 12 detector modules.
Major Characteristics of MRI-Compatible SiPM PET
We used nonmagnetic foil-screened twisted-pair cables (10-pair cable; Woori Electronics) with connectors (CONN 20POS; Woori Electronics) to transfer the output of the differential amplifiers to the data acquisition system located outside the MRI room to minimize any interference by radiofrequency signals. To isolate the shielding ground, the isolation panel was used to route signals from inside the MRI room to outside it (Supplemental Fig. 2).
Data Acquisition
We applied an analog bipolar multiplexing method to process the data from 2 detector modules using a single data acquisition board. The data acquisition system is equipped with 6 single data acquisition boards, a master board, and a personal computer. Each single data acquisition board consists of 1 field programmable gate array (FPGA) and 5 free-running ADCs. Five ADCs on a single data acquisition board digitize position-dependent PET signals from a detector module at a 170-MHz sampling rate with a resolution of 12 bits. The digitized signals are processed with the FPGA (Xilinx Spartan 3A DSP; Xilinx). With an external trigger, the FPGA acquires 13 and 52 samples before and after the trigger, respectively. The first 13 samples are used for baseline correction, and the rest are used for energy and position calculations of each event. Because these calculations are processed by the FPGA with a pipeline structure, no extra dead time is caused by the calculation. Timing information is acquired using the arrival time of the external trigger signal to the FPGA. Finally, the FPGA sends out a data package of an event to the master board at a data rate of 350 Mb/s via a low-voltage differential signaling transmitter. The external trigger signal was generated using a constant fraction discriminator (N842; CAEN).
The FPGA-based master board (Virtex 5; Xilinx) receives the data from single data acquisition boards, and the FPGA logically processes the coincidence events with a coincidence window of 12 ns (22). The coincidence events are then transferred to the personal computer via gigabit ethernet.
PET Performance Evaluation
We conducted a preliminary performance evaluation of the PET system outside the MRI scanner at a room temperature of 25°C. The energy resolution for the individual crystals of a detector block was measured using a 22Na point source (activity, 9.25 kBq; diameter, 0.25 mm) that was placed at the center of 2 detector blocks. The coincidence time resolution of a detector block pair was also measured using a constant fraction discriminator (CFD 935; Ortec) and time-to-digital converter (TDC V775N; CAEN).
We used the same point source to measure the spatial resolution of reconstructed images. The spatial resolution was estimated as the radial, tangential, and axial full width at half maximum, which was estimated using linear interpolation (23). To measure the sensitivity, the 22Na point source with an activity of 98 kBq was placed at the center of the FOV and scanned. The activity of the point source was corrected for the branching ratio. Two energy windows were applied (250–750 and 350–650 keV).
MRI Compatibility Tests
The MRI compatibility tests and simultaneous PET/MRI acquisitions were performed inside a 3-T clinical MRI system (Magnetom Trio; Siemens) with 4-cm loop receiver coils located inside the PET system (Supplemental Fig. 2). MRI radiofrequency waves were transmitted from the main body coil. A custom-made coil holder and animal bed were used for reproducible positioning of the radiofrequency coil to prevent motion artifacts due to coil vibration and for mouse and rat imaging studies (Supplemental Fig. 3). To explore whether the magnetic field and radiofrequency signals influenced the quality of the PET data, we obtained PET flood histograms and energy histograms with the PET insert placed inside the magnet, with and without the MRI sequence, as well as outside the magnet (Fig. 3). For these experiments, we used an annulus phantom (inner diameter, 69 mm; thickness, 2 mm) filled with 68Ga/68Ge covering the entire FOV.

SiPM PET insert placed outside and inside 3-T MRI scanner.
A standard T2-weighted turbo spin echo MRI sequence (repetition time/echo time, 8,000/107; matrix size, 384 × 384; slice thickness, 0.8 mm) of a set of cylindric phantoms (15 mm and 60 mm in diameter and length, respectively) filled with water (without contrast material) was acquired with and without the PET insert inside the magnet to evaluate the effect of the PET insert on MRI scans. In addition, scans were acquired with the PET insert powered on and off to determine the effect of PET electronics.
Simultaneous PET/MRI
To demonstrate the feasibility of simultaneous PET/MRI scans with this system, sets of PET and MRI scans were acquired simultaneously using the SiPM PET insert and 2 loop receiver coils. We acquired 40-min PET/MRI scans of 18F-filled capillary tubes (inner diameter, 1.1 mm; activity, 6.5 MBq) inserted in a cucumber to mimic living animal studies. The capillary tubes were placed along the axis of the scanners, and MRI was performed using standard T2-weighted turbo spin echo (20 slices).
The Institutional Animal Care and Use Committee at Seoul National University approved the mouse study. During the PET experiments, a 25-g BALB/c mouse was anesthetized by continuous administration of isoflurane in oxygen. 18F-FDG (3.7 MBq) was injected through the tail vein, and 30 min later a 60-min image dataset was acquired. T2-weighted turbo spin echo MRI scans were acquired during the PET scan (15 slices).
Data Processing
For normalization correction, scans were acquired using an annulus phantom used in the MRI compatibility tests. Different source thicknesses were compensated for each line of response in the normalization data. The list-mode dataset was sorted into a 3-dimensional sinogram and then was rebinned into 2-dimensional data using the single-slice rebinning method.
All scanned PET data were reconstructed using maximum likelihood expectation maximization with exact position information for each line-of-response element. An isotropic gaussian filter of 0.5 mm in full width at half maximum was applied to the reconstructed images of phantoms and animal. To avoid overestimation of the spatial resolution measurement, uniform background data acquired using a cylindric phantom were added to the point source data before reconstruction. Image fusion of PET and MRI was performed after spatial registration with rigid-body transformation between them using software for functional image registration (Seoul National University) (24).
RESULTS
Physical Performance of SiPM PET
The energy resolution for an individual crystal in a typical detector block was about 13.9%, which is much improved from the first prototype (~26%). The photopeak region was clearly separated from the scattered events in the energy spectrum of each crystal. The global energy spectrum of a block detector obtained by averaging the energy spectra of individual crystals after peak alignment is shown in Supplemental Figure 4. The average coincidence timing resolution was 1.23 ns.

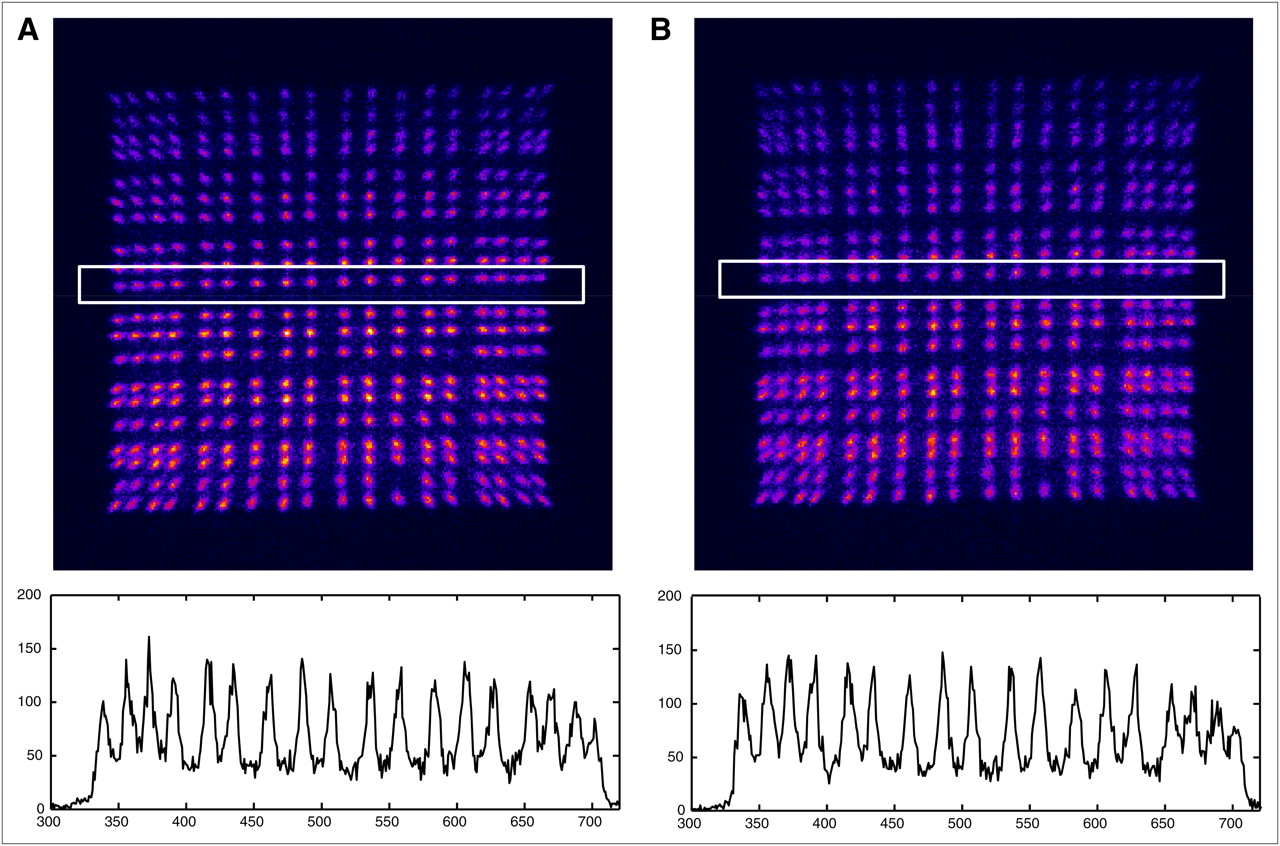
Flood maps of SiPM PET detector module acquired without (A) and with (B) application of radiofrequency pulse sequences, and profiles on them. Boxed regions are where profiles were estimated.
Radial, tangential, and axial spatial resolutions at the center of the FOV were 1.0, 1.2, and 1.5 mm, respectively, which are similar to those obtained from the first prototype. Sensitivities at the center of the FOV were 0.195% and 0.116% with energy windows of 250–750 keV and 350–650 keV, respectively, which are about 2.3 times higher than for the first prototype.
Interference Between PET and MRI
Raw PET signals recorded using a 350-MHz oscilloscope (MSO 4034; Tetronix) from the SiPM PET insert located inside the MRI magnet while running various radiofrequency sequences showed no difference from those acquired outside the MRI room (Supplemental Fig. 5). In addition, the radiofrequency sequences did not lead to any change in the flood map (Fig. 4) or the global energy spectrum of SiPM PET detector modules. As summarized in Table 3, there was no change in the peak-to-valley ratio along the profiles on the middle rows in the flood maps shown in Figure 4.
Peak-to-Valley Ratio Along Profiles on Middle Rows in Flood Maps Shown in Figure 4
In addition, MRI phantom images acquired with the PET insert (power on) located inside the magnet showed no obvious artifacts or observable quality degradation in comparison to the image without the PET insert (Fig. 5). The MRI scan quality was not changed by turning off all power supplies to the PET insert. Signal-to-noise ratios (ratio of the mean and SD of the signal intensity) of MRI scans were evaluated in uniform regions in the MRI phantom (circles on the images). They are summarized in Table 4. The signal-to-noise ratio with PET was slightly smaller.
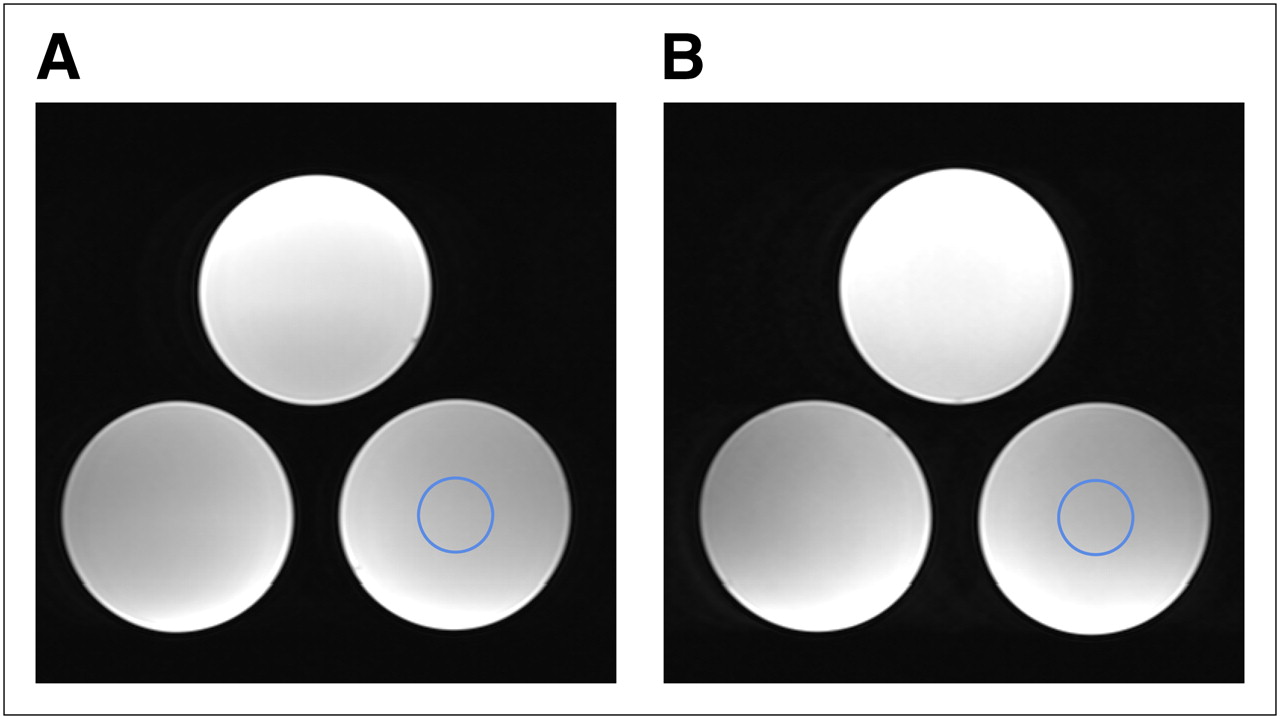
T2-weighted MRI scans of uniform cylindric phantom acquired without (A) SiPM PET insert and with (B) insert (power on). Circled regions are where signal-to-noise ratio, summarized in Table 4, was estimated.
Summary of Average Signal Intensity and Signal-to-Noise Ratio of MRI Scans Shown in Figure 5
Simultaneous PET/MRI
Figures 6 and 7 show the first simultaneous PET and MRI scans of a cucumber phantom and living mouse using the present system. The 18F-PET and T2-weighted MRI scans of capillary tubes inserted into the cucumber show good spatial resolution for both imaging systems and accurate geometric alignment of both images, with minimal spatial nonlinearities (Fig. 6).

Simultaneously acquired PET and MRI (T2-weighted turbo spin echo) scans of three 18F-filled capillary tubes inserted into cucumber.

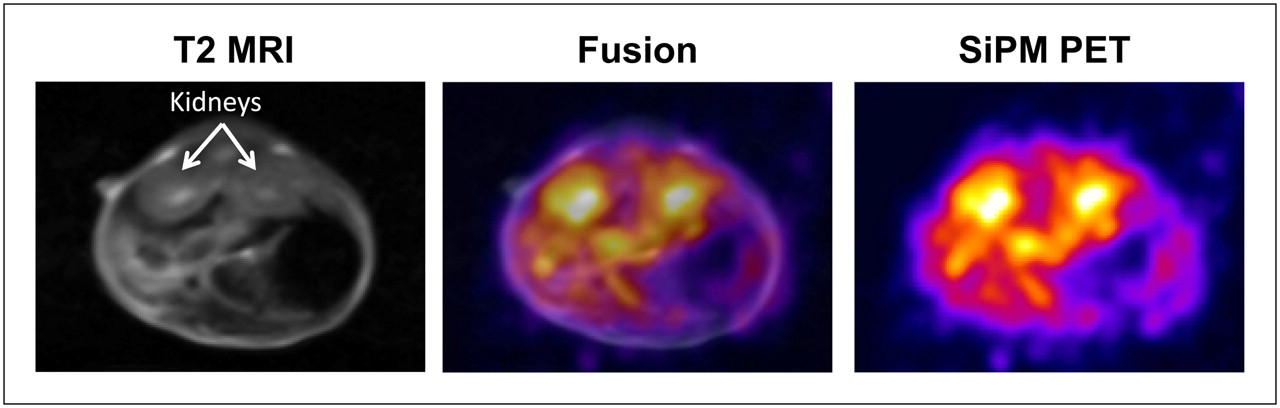
In vivo PET/MRI (T2-weighted turbo spin echo) study in BALB/c mouse after injection of 18F-FDG.
Figure 7 shows the PET and T2-weighted MRI scans of a BALB/c mouse acquired 30 min after injection of 18F-FDG. Transverse slices in the kidney level are shown, and both kidneys are well visualized without any distortion of images or local mismatches.
DISCUSSION
We developed an MRI-compatible SiPM-based PET scanner and combined this scanner with a state-of-the-art 3-T MRI system. We also showed the feasibility of this combined system by performing various simultaneous PET/MRI studies.
There are several advantages of SiPM over APD as a semiconductor photosensor in an integrated PET/MRI system. In particular, the higher gain of signal amplification due to operation in Geiger mode is an advantage of SiPM for reducing the complexity of front-end electronics for analog signal readout from the photosensors (10,11). Being different from the APD-based small-animal PET/MRI systems that use application-specific integrated circuit chips for individually coupling each APD channel to a preamplifier (7,8), our system applies SiPM channels directly connected to the RCN circuit without the use of preamplifiers.
Because of the much-reduced dark count (noise) rate in the state-of-the-art SiPM (S11064-050P; ∼6 Mcps), the incorporation of 64 SiPM channels in a single RCN circuit and application of a wider signal integration time window of 200 ns for analog-to-digital conversion were possible in this study, whereas our previous system (18) had 6 channels in an RCN and a 20-ns integration window. These differences contributed to the extension of the axial FOV and improvement in energy resolution, respectively. The multiplexing signals using the RCN circuit to reduce the number of output channels from the PET detectors was also useful for simplifying wire routing and effectively shielding the wires, in contrast to other approaches using wire bundles (25,26) for 1-to-1 coupling of SiPM with a preamplifier.
The fluctuation in SiPM gain with regard to the operating bias voltage is an important technical issue in SiPM-based PET detector development (10,11). Moreover, each SiPM chip has a different operating voltage level to produce the same gain of signal amplification. This is why we combined 4 S11064-050Ps with a minimum difference in the average optimal operating voltage in each detector module. Although we applied the same bias voltage to 64 SiPM channels in 4 S11064-050Ps to minimize the number of power lines, the flood maps showed a uniform count distribution, as shown in Figure 4, commonly with or without radiofrequency application (the vertical gradient in image intensity is due to off-center source position).
The gain of SiPM is also dependent on temperature (10,11,27). The temperature-dependent gain variation of MPPC is about 5% per degree at room temperature (17,28). In this study, we used the gain compensation method in which the ADC output is scaled retrospectively using the temperature information measured continuously during PET/MRI data acquisition. Because of the well-maintained temperature at about 20°C in the MRI room, the retrospective gain compensation method was a practical solution in our preliminary phantom and animal studies. However, we may need more investigation into the feasibility of this compensation method when we incorporate a heated animal stage to maintain the body temperature of animals. Because other physical properties of SiPM (i.e., the dark count [noise] rate) are also negatively influenced by increasing the temperature, more active temperature insulation of PET detector modules would be useful. The tradeoff between performance and complexity should be considered in future studies.
Radiofrequency waves induce the electric current inside the conductive material, incurring noise in the PET readout electronics (10). In previous studies, we also reported radiofrequency-induced events in the PET electronics that matched radiofrequency pulses (10,14). In contrast, there was no noise from the radiofrequency in this PET system (Supplemental Fig. 5). In this study, we optimized the shielding method and used several techniques to avoid radiofrequency noise. The techniques included the use of nonmagnetic foil-screened twisted-pair cables to transfer the output of the differential amplifiers and isolation panel so as to route signals from inside the MRI room to outside it and isolate the shielding ground. The conductive shielding materials of the foil-screened twisted-pair cables and the isolation panel form a faraday cage that isolates the signal path from the environment with its radiofrequency noise. Therefore, induction of radiofrequency noise to signal lines is avoided.
Although small-animal–dedicated ultra-high-field (i.e., 9.4 T or 7.0 T) MRI scanners yield better spatial resolution and image quality, the combination of an SiPM PET scanner with a widely used clinical 3.0-T or 1.5-T MRI system would also have a rationale. In particular, the much higher availability of advanced pulse sequences and techniques in clinical 3.0-T and 1.5-T systems is one of them. In some translational research from animal experiments to human applications (e.g., development of contrast agents), the clinical system would be preferred over ultra-high-field systems. More available space inside the MRI bore than is allowed in dedicated animal MRI scanners is another merit of the clinical MRI system. The larger space allows the use of longer scintillation crystals and various depth-of-interaction measurement techniques to improve PET system performance (29).
In the investigation of MRI-compatible PET inserts with state-of-the-art clinical MRI systems, one practical challenge is the current MRI trend to use powerful body coils to transmit radiofrequency waves and local radiofrequency coils to receive signals. Use of dedicated local radiofrequency coils to transmit and receive radiofrequency to and from objects would be an effective way to avoid the partial obstruction of waves from the main body coil by the PET insert. Another possible approach is incorporation of short optical fiber bundles between the scintillation crystal array and SiPMs to minimize the obstruction provided by the electronics and shielding materials (6,30).
CONCLUSION
We developed an MRI-compatible SiPM PET insert with 12 detector modules. We found that simultaneous PET/MRI was possible using this multichannel SiPM-based PET insert, with no radiofrequency interference on the PET signals or images and only slight degradation of MRI scans.
DISCLOSURE STATEMENT
The costs of publication of this article were defrayed in part by the payment of page charges. Therefore, and solely to indicate this fact, this article is hereby marked “advertisement” in accordance with 18 USC section 1734.
Acknowledgments
This work was supported by grants from the Atomic Energy R&D Program (2008-2003852 and 2010-0026012) and the WCU Program (R32-10142) through the KOSEF funded by the Korean Ministry of Education, Science, and Technology. Preliminary results of this work, including the first simultaneously acquired PET/MRI scans using the system, were presented at the PET/MRI workshop of the 2010 IEEE Medical Imaging Conference in Knoxville, Tennessee. No other potential conflict of interest relevant to this article was reported.
Footnotes
Published online Mar. 13, 2012.
- © 2012 by the Society of Nuclear Medicine, Inc.
REFERENCES
- Received for publication August 26, 2011.
- Accepted for publication December 27, 2011.


Jump to section
Related Articles
Cited By...
- Generation of PET Attenuation Map for Whole-Body Time-of-Flight 18F-FDG PET/MRI Using a Deep Neural Network Trained with Simultaneously Reconstructed Activity and Attenuation Maps
- Simultaneous Multiparametric PET/MRI with Silicon Photomultiplier PET and Ultra-High-Field MRI for Small-Animal Imaging
- MRI-Based Attenuation Correction for PET/MRI Using Multiphase Level-Set Method
- A Promising Future: Comparable Imaging Capability of MRI-Compatible Silicon Photomultiplier and Conventional Photosensor Preclinical PET Systems
- Principles of PET/MR Imaging
- Comparison of Segmentation-Based Attenuation Correction Methods for PET/MRI: Evaluation of Bone and Liver Standardized Uptake Value with Oncologic PET/CT Data