


Article Figures & Data
Figures
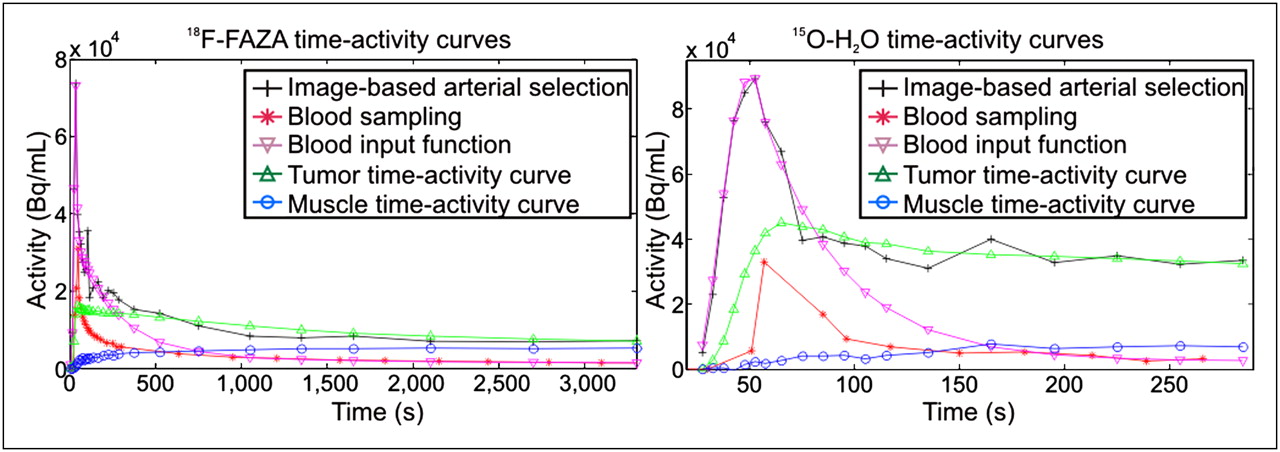
- FIGURE 1.
Blood input curves and time–activity curves of whole tumor region and 1 normal muscle region for patient 2.
- FIGURE 2.
Illustration of different transport mechanisms between 15O-H2O and 18F-FAZA.
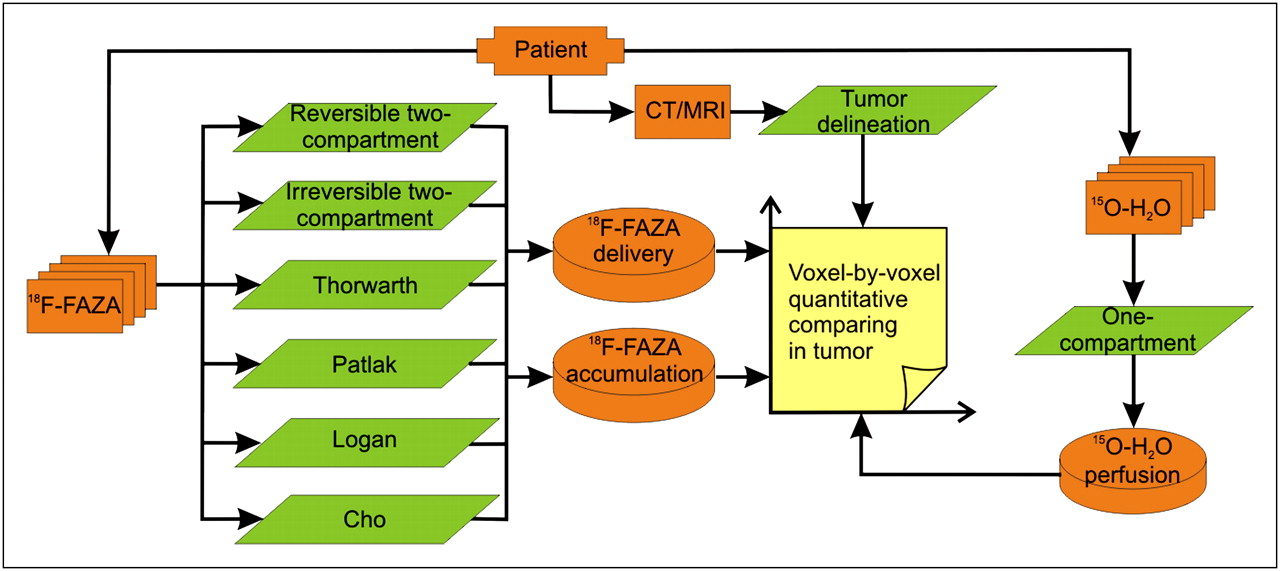
- FIGURE 3.
Procedure for quantitative comparison of hypoxia kinetic models.
- FIGURE 4.
Six frames of 18F-FAZA PET of a slice for patient 2. Regions of interest outline region of tumor, and t denotes time of start of frame.
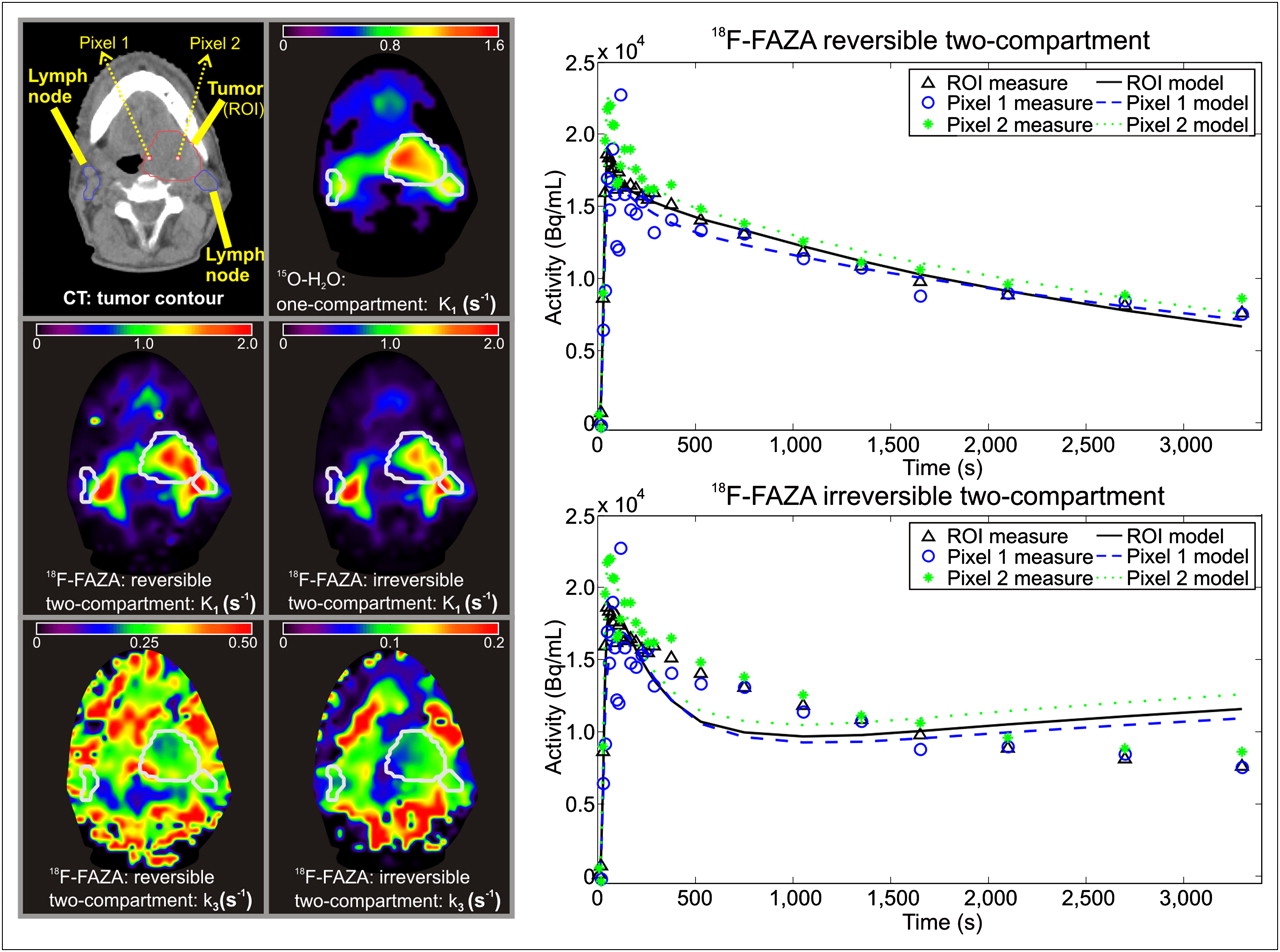
- FIGURE 5.
One slice of CT image and parametric images of reversible and irreversible 2-compartment models for patient 2. Parametric images are computed within region determined by CT. Time–activity curves of tumor region of interest and 2 pixels (arrows) are displayed on right, with corresponding model results. ROI = region of interest.
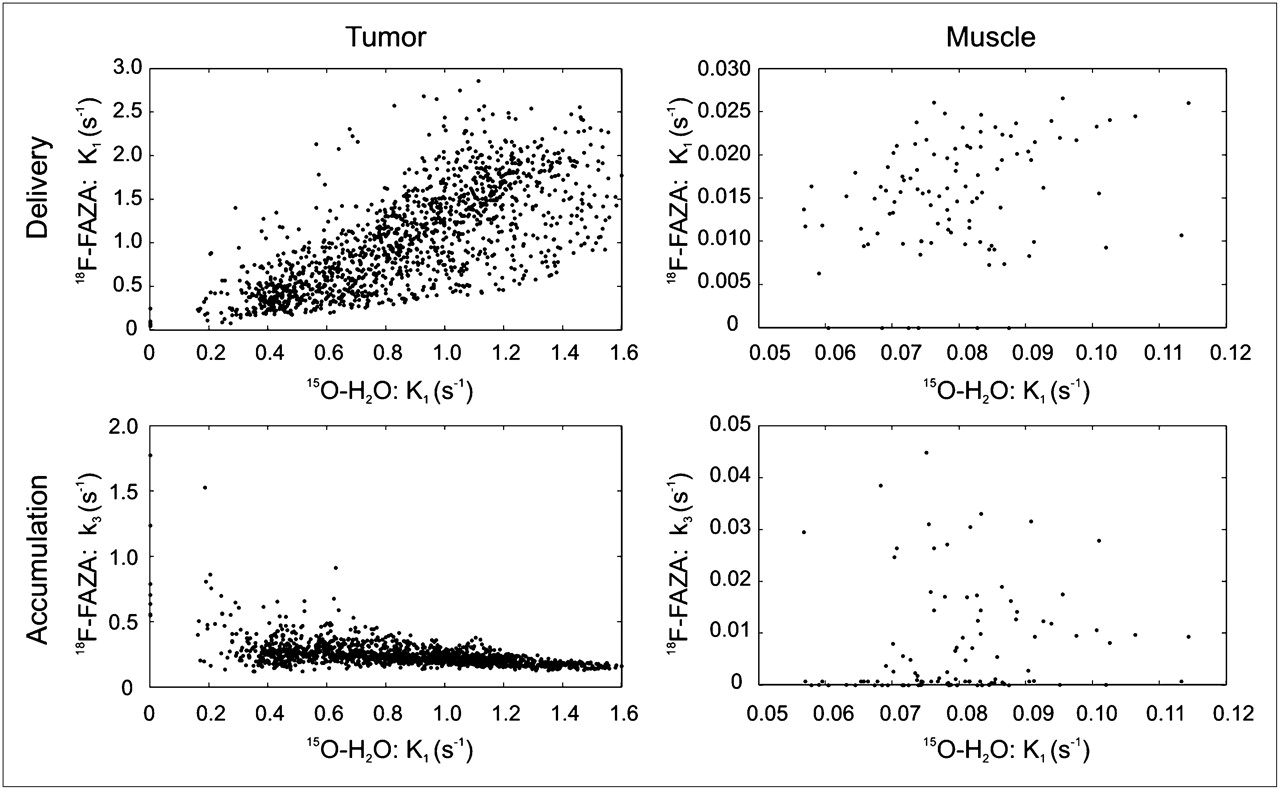
- FIGURE 6.
Scatterplots of voxelwise correlation between estimated parameters of reversible 2-compartment model for 18F-FAZA and K1 of 1-compartment model for 15O-H2O in tumor and muscle regions for patient 2.


Tables
- TABLE 1.
Patient Characteristics and Voxelwise Correlations Between Static Uptake of 18F-FAZA (at 1 Hour After Injection) and 15O-H2O (at 40–70 Seconds After Injection) in Tumor Region
Patient no. Sex Age (y) Tumor location Tumor volume (cm3) r 1 M 44 Oropharynx/hypopharynx 48.83 0.517 2 M 48 Oropharynx 75.30 0.431 3 M 49 Nasopharynx 111.85 0.272 4 F 61 Tonsillar fossa 25.51 0.445 5 M 56 Base of tongue 256.29 0.340 - TABLE 2.
Voxelwise Correlations Between 18F-FAZA Delivery and Corresponding 15O-H2O Perfusion in Tumor Region for Each Patient
Patient no. Reversible 2-compartment: K1 Irreversible 2-compartment: K1 Thorwarth: w0 Cho: early 1 0.359/0.231 0.337/0.188 0.507/0.447 0.854/0.795 2 0.684/0.744 0.724/0.768 0.523/0.584 0.867/0.911 3 0.144/0.103 0.138/0.095 0.183/0.164 0.851/0.791 4 −0.025/0.003 −0.014/−0.002 0.109/0.182 0.291/0.152 5 0.352/0.349 0.332/0.326 0.372/0.388 0.694/0.705 Values after slash (/) indicate computation result when performing half-voxel shift in x direction for registration. Each column of table denotes 1 Pearson correlation coefficient between specified kinetic parameter of 18F-FAZA modeling and kinetic parameter K1 of 15O-H2O modeling.
- TABLE 3.
Voxelwise Correlations Between 18F-FAZA Accumulation and Corresponding 15O-H2O Perfusion in Tumor Region for Each Patient
Patient no. Reversible 2-compartment: k3 Irreversible 2-compartment: k3 Thorwarth: wA Patlak: slope Logan: DV Cho: late 1 −0.462/−0.356 −0.674/−0.636 0.435/0.596 0.487/0.622 0.598/0.672 −0.558/−0.647 2 −0.490/−0.499 −0.344/−0.352 0.528/0.589 0.348/0.436 0.526/0.606 −0.600/−0.627 3 −0.441/−0.428 −0.506/−0.492 0.152/0.144 0.162/0.135 0.297/0.264 −0.404/−0.326 4 −0.156/0.029 −0.094/0.087 0.578/0.637 0.556/0.641 0.416/0.548 −0.067/0.053 5 −0.107/−0.128 −0.167/−0.173 0.451/0.435 0.535/0.527 0.581/0.576 −0.242/−0.261 Values after slash (/) indicate computation result when performing half-voxel shift in x direction for registration. Each column of table denotes1 Pearson correlation coefficient between specified kinetic parameter of 18F-FAZA modeling and kinetic parameter K1 of 15O-H2O modeling.
- TABLE 4.
Voxelwise Correlations Between 18F-FAZA Delivery and Corresponding 15O-H2O Perfusion in Region of Muscle for Each Patient
Patient no. Reversible 2-compartment: K1 Irreversible 2-compartment: K1 Thorwarth: w0 Cho: early 1 0.412 0.344 −0.131 0.436 2 0.230 0.112 −0.068 0.320 3 0.888 0.929 0.414 0.931 4 0.598 0.682 0.117 0.720 5 0.349 0.182 −0.066 0.046 σ 0.257 0.347 0.222 0.345 Each column of table denotes 1 Pearson correlation coefficient between specified kinetic parameter of 18F-FAZA modeling and kinetic parameter K1 of 15O-H2O modeling. σ is SD of normalized correlations of all patients in column.
- TABLE 5.
Voxelwise Correlations Between 18F-FAZA Accumulation and Corresponding 15O-H2O Perfusion in Region of Muscle for Each Patient
Patient no. Reversible 2-compartment: k3 Irreversible 2-compartment: k3 Thorwarth: wA Patlak: slope Logan: DV Cho: late 1 0.166 0.087 0.114 0.226 0.143 −0.290 2 0.111 −0.176 0.476 0.491 0.343 −0.065 3 −0.379 0.567 0.868 0.862 0.351 −0.814 4 0.281 0.446 0.674 0.792 0.309 −0.667 5 0.232 0.050 −0.094 −0.068 −0.300 −0.239 σ 0.266 0.305 0.396 0.389 0.276 0.313 Each column of table denotes 1 Pearson correlation coefficient between specified kinetic parameter of 18F-FAZA modeling and kinetic parameter K1 of 15O-H2O modeling. σ is SD of normalized correlations of all patients in column.


Jump to section
Related Articles
Cited By...
- Multiparametric Analysis of the Relationship Between Tumor Hypoxia and Perfusion with 18F-Fluoroazomycin Arabinoside and 15O-H2O PET
- 18F-Fluoromisonidazole Quantification of Hypoxia in Human Cancer Patients Using Image-Derived Blood Surrogate Tissue Reference Regions
- Parametric Methods for Quantification of 18F-FAZA Kinetics in Non-Small Cell Lung Cancer Patients