


Article Figures & Data
Figures
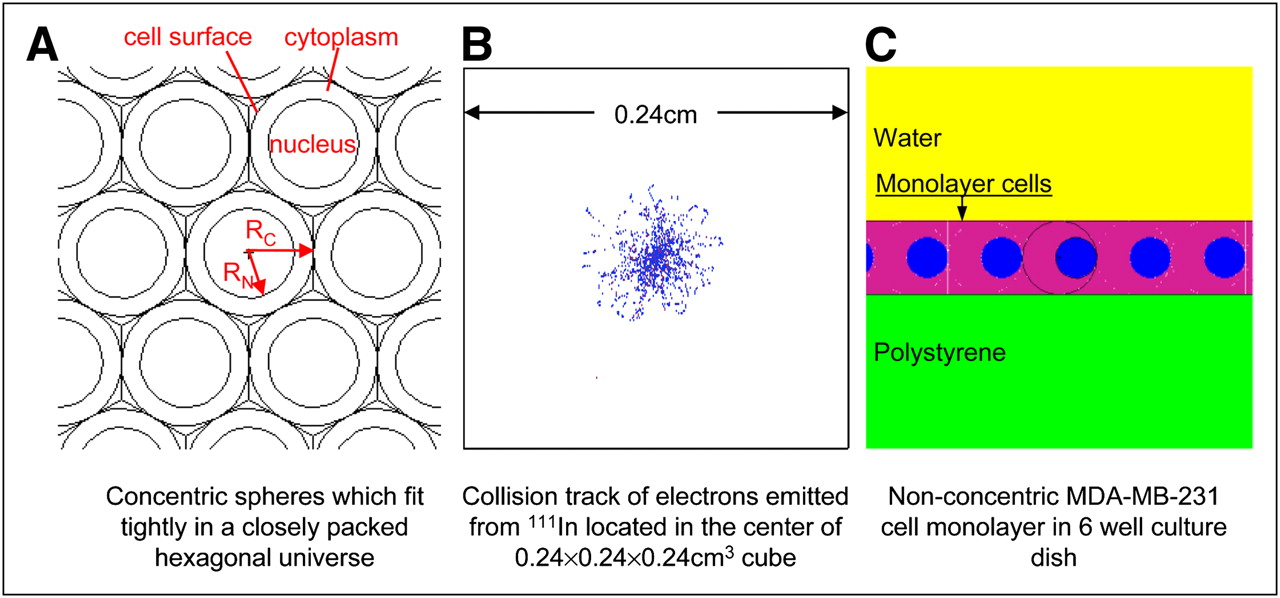
- FIGURE 1.
Schematic cell geometry and 111In distributions used in MCNP simulation.
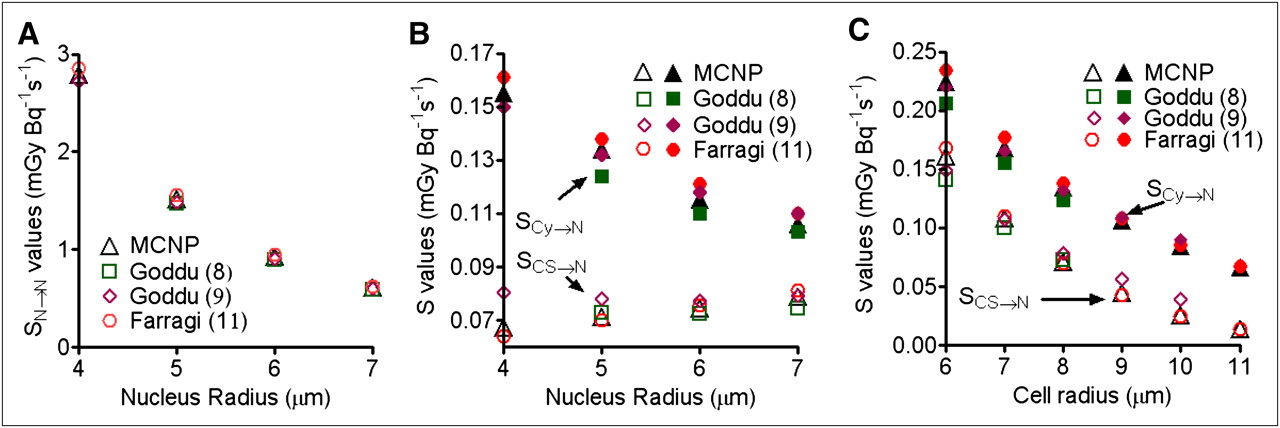
- FIGURE 2.
Effects of cell and nucleus radii on self-dose S values in comparison to those reported by Goddu et al. (8,9) or Farragi et al. (11): dependence of SN→N (A) and of SCy→N and SCS→N (B) on nucleus radius with constant cell radius of 8 μm, and dependence of SCy→N and SCS→N (C) on cell radius with constant nucleus radius of 5 μm.
- FIGURE 4.
Live cell images (central slices) of 6 breast cancer (BC) cell lines (MDA-MB-468, MDA-MB-231, MDA-MB-361, MCF-7, BT-474, and SKBr-3). Cell surfaces (red) were stained by wheat germ agglutinin-Alexa Fluor 594 conjugate, whereas cell nuclei (blue) were stained by Hoechst 33342 dye. RC and RN are mean cell and nucleus radii, respectively.


Tables
Single cell Cell cluster Cell monolayer RC (μm) RN (μm) SN→N SCy→N SCS→N SN→N SCy→N SCS→N Cross-dose S value SN→N SCy→N SCS→N 5 2 19.305 0.442 0.255 24.36 5.59 5.40 5.06 19.60 0.795 0.557 5 3 6.139 0.381 0.245 11.28 5.62 5.36 5.14 6.46 0.782 0.562 5 4 2.785 0.341 0.238 7.99 5.61 5.39 5.20 3.16 0.765 0.570 6 3 6.139 0.295 0.169 9.06 3.25 3.08 2.92 6.32 0.518 0.327 6 4 2.785 0.252 0.162 5.73 3.23 3.06 2.94 2.97 0.482 0.336 6 5 1.523 0.224 0.161 4.50 3.24 3.09 2.97 1.74 0.469 0.347 7 3 6.138 0.231 0.107 7.97 2.09 1.90 1.84 6.25 0.364 0.192 7 4 2.785 0.197 0.108 4.61 2.03 1.89 1.83 2.90 0.337 0.200 7 5 1.523 0.168 0.108 3.37 2.04 1.91 1.84 1.65 0.317 0.204 7 6 0.931 0.151 0.111 2.79 2.04 1.93 1.86 1.07 0.319 0.217 8 4 2.785 0.155 0.067 4.01 1.40 1.26 1.22 2.87 0.252 0.138 8 5 1.523 0.134 0.071 2.73 1.36 1.27 1.21 1.61 0.237 0.145 8 6 0.931 0.115 0.075 2.15 1.36 1.28 1.22 1.02 0.224 0.155 8 7 0.613 0.106 0.079 1.85 1.37 1.30 1.24 0.71 0.221 0.163 9 4 2.785 0.122 0.038 3.64 0.99 0.87 0.86 2.85 0.197 0.098 9 5 1.523 0.106 0.045 2.38 0.96 0.89 0.85 1.59 0.178 0.107 9 6 0.931 0.093 0.049 1.78 0.95 0.89 0.85 1.00 0.169 0.111 9 7 0.613 0.082 0.053 1.47 0.83 0.90 0.86 0.68 0.144 0.118 9 8 0.425 0.077 0.058 1.29 0.96 0.91 0.87 0.50 0.161 0.128 10 5 1.524 0.084 0.026 2.14 0.71 0.63 0.61 1.58 0.141 0.070 10 6 0.931 0.074 0.031 1.55 0.70 0.64 0.62 0.98 0.132 0.076 10 7 0.613 0.066 0.035 1.23 0.70 0.64 0.62 0.67 0.124 0.081 10 8 0.425 0.060 0.039 1.05 0.69 0.65 0.62 0.48 0.122 0.085 10 9 0.308 0.057 0.044 0.94 0.69 0.66 0.63 0.37 0.122 0.092 11 5 1.524 0.066 0.014 2.00 0.53 0.48 0.48 1.57 0.112 0.051 11 6 0.931 0.059 0.018 1.39 0.52 0.47 0.46 0.97 0.103 0.054 11 7 0.613 0.054 0.022 1.08 0.52 0.48 0.47 0.66 0.099 0.058 11 8 0.425 0.049 0.026 0.89 0.52 0.48 0.47 0.47 0.094 0.062 11 9 0.308 0.046 0.030 0.77 0.52 0.49 0.47 0.35 0.095 0.068 11 10 0.230 0.044 0.034 0.70 0.52 0.50 0.42 0.27 0.085 0.072 12 6 0.931 0.047 0.010 1.29 0.41 0.36 0.36 0.97 0.084 0.039 12 7 0.613 0.043 0.013 0.97 0.40 0.36 0.36 0.65 0.081 0.040 12 8 0.425 0.040 0.017 0.78 0.40 0.37 0.36 0.46 0.077 0.044 12 9 0.308 0.037 0.020 0.66 0.40 0.37 0.36 0.34 0.075 0.047 12 10 0.230 0.035 0.023 0.59 0.40 0.37 0.36 0.27 0.074 0.052 12 11 0.176 0.035 0.027 0.54 0.40 0.38 0.36 0.21 0.075 0.056 RC and RN are cell and nucleus radii, respectively.
Single cell Cell monolayer Cell cluster Cell line SN→N SCy→N SCS→N SN→N SCy→N SCS→N SN→N SCy→N SCS→N MDA-MB-468 1.30 0.143 0.089 1.40 0.26 0.18 2.78 1.66 1.56 By Auger electron 1.25 0.127 0.077 1.26 0.15 0.080 1.27 0.16 0.09 By internal conversion electron 0.04 0.017 0.011 0.14 0.11 0.102 1.49 1.47 1.46 S (Auger electron)/S (all electrons) 0.963 0.888 0.864 0.899 0.573 0.44 0.455 0.097 0.059 MDA-MB-361 1.02 0.100 0.053 1.09 0.17 0.12 1.93 1.03 0.95 MCF-7 0.89 0.097 0.057 0.96 0.18 0.08 1.84 1.06 0.99 BT-474 0.89 0.086 0.044 0.95 0.15 0.10 1.66 0.87 0.81 SKBr-3 0.82 0.084 0.044 0.87 0.15 0.06 1.59 0.87 0.81 MDA-MB-231 1.30 0.088 0.034 1.36 0.15 0.08 2.00 0.79 0.72 Acentric MDA-MB-231 1.30 0.069 0.045 1.36 0.14 0.10 2.00 0.78 0.74 S (acentric)/S (concentric) 1.00 0.78 1.33 1.00 0.93 1.24 1.00 0.98 1.02 Cell geometry Dose calculation method Calculated dose to cell nucleus (Gy) Dose-projected SF Corrected SF RE (%) Cell monolayer MCNP 0.59 0.75 0.64 3.1 Single cell MCNP 0.47 0.80 0.67 8.1 Goddu et al. (8) 0.46 0.80 0.67 8.1 Goddu et al. (9) 0.45 0.80 0.67 8.1 Farragi et al. (11) 0.49 0.79 0.67 8.1 Cell cluster MCNP 2.2 0.33 0.28 −54 Farragi et al. (11) 2.8 0.24 0.20 −67 ↵* MDA-MB-468 cells were treated with 111In-DTPA-hEGF (3.2 MBq/mL; 21 nM) for 1 h and had experimental SF of 0.62 (2).
Supplemental Data
Files in this Data Supplement:


Jump to section
Related Articles
Cited By...
- Targeting Micrometastases: The Effect of Heterogeneous Radionuclide Distribution on Tumor Control Probability
- Monte Carlo N-Particle (MCNP) Modeling of the Cellular Dosimetry of 64Cu: Comparison with MIRDcell S Values and Implications for Studies of Its Cytotoxic Effects
- Lognormal Distribution of Cellular Uptake of Radioactivity: Monte Carlo Simulation of Irradiation and Cell Killing in 3-Dimensional Populations in Carbon Scaffolds
- Cellular Dosimetry Using the Geant4 Monte Carlo Toolkit
- Reply: Cellular Dosimetry Using the Geant4 Monte Carlo Toolkit
- The Monte Carlo Method in Nuclear Medicine: Current Uses and Future Potential