


Abstract
Our objective was to compare Monte Carlo N-particle (MCNP) self- and cross-doses from 111In to the nucleus of breast cancer cells with doses calculated by reported analytic methods (Goddu et al. and Farragi et al.). A further objective was to determine whether the MCNP-predicted surviving fraction (SF) of breast cancer cells exposed in vitro to 111In-labeled diethylenetriaminepentaacetic acid human epidermal growth factor (111In-DTPA-hEGF) could accurately predict the experimentally determined values. Methods: MCNP was used to simulate the transport of electrons emitted by 111In from the cell surface, cytoplasm, or nucleus. The doses to the nucleus per decay (S values) were calculated for single cells, closely packed monolayer cells, or cell clusters. The cell and nucleus dimensions of 6 breast cancer cell lines were measured, and cell line–specific S values were calculated. Results: For self-doses, MCNP S values of nucleus to nucleus agreed very well with those of Goddu et al. (ratio of S values using analytic methods vs. MCNP = 0.962–0.995) and Faraggi et al. (ratio = 1.011–1.024). MCNP S values of cytoplasm and cell surface to nucleus compared fairly well with the reported values (ratio = 0.662–1.534 for Goddu et al.; 0.944–1.129 for Faraggi et al.). For cross doses, the S values to the nucleus were independent of 111In subcellular distribution but increased with cluster size. S values for monolayer cells were significantly different from those of single cells and cell clusters. The MCNP-predicted SF for monolayer MDA-MB-468, MDA-MB-231, and MCF-7 cells agreed with the experimental data (relative error of 3.1%, −1.0%, and 1.7%). The single-cell and cell cluster models were less accurate in predicting the SF. For MDA-MB-468 cells, relative error was 8.1% using the single-cell model and −54% to −67% using the cell cluster model. Individual cell-line dimensions had large effects on S values and were needed to estimate doses and SF accurately. Conclusion: MCNP simulation compared well with the reported analytic methods in the calculation of subcellular S values for single cells and cell clusters. Application of a monolayer model was most accurate in predicting the SF of breast cancer cells exposed in vitro to 111In-DTPA-hEGF.
Targeted Auger electron radiotherapy of malignancies is a promising novel therapeutic strategy that aims to deposit lethal DNA-damaging radiation selectively into the nuclei of tumor cells while sparing normal cells. For example, 111In-labeled diethylenetriaminepentaacetic acid human epidermal growth factor (111In-DTPA-hEGF) is a targeted Auger electron–emitting radiotherapeutic agent discovered in our laboratory that is selectively bound, internalized, and translocated to the nucleus of epidermal growth factor receptor–overexpressing breast cancer cells, where it causes DNA double-strand breaks and cell death (1–3). 111In-DTPA-hEGF exhibited potent antiproliferative effects in vitro on epidermal growth factor receptor–overexpressing MDA-MB-468 human breast cancer cells as well as strong antitumor effects in vivo in athymic mice implanted subcutaneously with MDA-MB-468 tumor xenografts (4,5). No major normal-tissue toxicities were observed in mice or rabbits administered high doses of 111In-DTPA-hEGF (6), and the agent is completing phase I clinical trial evaluation in patients with chemotherapy-refractory epidermal growth factor receptor–positive metastatic disease (7).
Because of the nanometer-to-micrometer ranges of Auger electrons and the nonuniform subcellular distribution of radiopharmaceuticals such as 111In-DTPA-hEGF that partition between the cell surface, cytoplasm, and cell nucleus, estimates of the radiation absorbed dose to the nucleus would inform on their potential therapeutic benefit. The gold standard to calculate the dose to the nucleus from Auger electron–emitting radionuclides in subcellular compartments such as the cell surface, cytoplasm, or nucleus is the self-dose S value (in Gy·Bq−1·s−1), that is, the dose to these compartments per unit cumulated radioactivity in the same cell, reported by Goddu et al. (8,9). They applied the analytic method to calculate the self-dose S value for a spherically symmetric single cell. The diameters of the cell and nucleus used in the calculation ranged from 2 to 20 μm. Cole's experimental electron range and energy relationship in unit density matter were applied in the calculation (10), and the self-dose S values for a range of Auger electron-emitters were tabulated (8,9). Similarly, Faraggi et al. also calculated self-dose S values for 5 radionuclides using the analytic method. But they used the scaled electron dose point kernels and the continuous slowing-down approximation range in their calculation (11).
The self-dose S value is adequate to assess the dose to the nucleus for isolated cells. However, for clusters of cells, the cross-dose from surrounding cells becomes more important as the size of the cluster increases. Goddu et al. calculated cross-dose S values for only one cell dimension (cell and nucleus diameters of 10 and 8 μm, respectively) using closely packed cubic geometry. They assessed the effect of cluster diameters (from 26 to 400 μm) on cross-dose S values (12). Faraggi et al. reported cross-dose S values for concentric spheric cells of various dimensions (cell diameters from 6 to 24 μm and nucleus diameters from 4 to 22 μm) in unbounded close-packed hexagonal geometry (11).
Both Goddu et al. and Faraggi et al. used analytic methods and idealized concentric spheres of cell and nucleus to calculate self- and cross-dose S values. It is difficult to extend their methods to cells of different configurations (e.g., the cell and nucleus are not concentric) or geometry (e.g., a monolayer of cells in a culture dish). In this report, we propose a more versatile evaluation of the dose deposited in the nucleus based on Monte Carlo simulation. This stochastic calculation method allows the transport of radiation through a realistic 3-dimensional geometry. We used the Monte Carlo N-particle (MCNP) computer code (13), which is capable of following the photon and electron transport down to an energy of 1 keV in generalized geometries. This energy corresponds to an electron range of about 50 nm in a tissue-equivalent medium. We hypothesized that MCNP would be able to assess both self- and cross-doses to the cell nucleus with accuracy comparable to the reported analytic methods but would be more flexible to model different cell geometries and experimental settings. In this study, we calculated S values to the nucleus from cell surface, cytoplasm, and nucleus compartments for a single cell, closely packed monolayer cells, or a cluster of cells of various dimensions. Our results were compared with those reported by Goddu et al. (8,9,12) and Faraggi et al. (11), and the dose-predicted surviving fraction (SF) was compared with the experimental data reported previously by us for treatment of MDA-MB-468, MDA-MB-231, and MCF-7 human breast cancer cells with 111In-DTPA-hEGF (2).
MATERIALS AND METHODS
Monte Carlo Simulation
MCNP code (version 5; Los Alamos National Laboratory) (13) and the Evaluated Nuclear Data File (ENDF/B-IV) cross-sections (14) were used to establish S values of 111In to the nucleus for a single, closely packed monolayer or clusters of cells of various dimensions. The electron spectrum of 111In, taken from an American Association of Physicists in Medicine (AAPM) Task Group report (15), was included in the MCNP input file to be directly sampled during radiation transport simulation. 111In decays by electron capture and emits Auger electrons, internal conversion electrons, x-rays, and γ-rays. Only internal conversion (145–245 keV; 205–622 μm) and Auger electrons (8.5 eV−25.5 keV; 0.25 nm−13.6 μm) were considered in the dose calculation, whereas the contribution of γ- and x-ray photons to the S values (<2% of electrons' contribution to S value of nucleus to nucleus [SN→N] and <5% of electrons' contribution to S value of cell surface to nucleus [SCS→N] as well as cytoplasm to nucleus [SCy→N]) was considered negligible and ignored. 111In was assumed to be distributed homogeneously in cell surface, cytoplasm, or nucleus compartments (Fig. 1A). For comparison with the analytic methods, cell and nucleus were assumed to be concentric spheres that fit tightly in a closely packed hexagonal universe in the case of the monolayer and cluster of cells (Fig. 1A). For the purposes of the calculation, the radius of the cell and nucleus ranged from 5 to 12 μm and 2 to 11 μm, respectively. The studied volume was defined as a cube of 0.24 × 0.24 × 0.24 cm of breast tissue–equivalent phantom (ICRU-44) (16), 4 times the range of most energetic internal conversion electrons (Fig. 1B). The effect of studied volumes (up to 20 × 20 × 20 cm) on the S values was examined for cells with cell and nucleus diameters of 16 and 10 μm, respectively, and was found to be less than 0.1%. Only for imitating exposure of cells seeded into wells of a 6-well tissue culture plate containing 1 mL of culture medium, the studied volume was defined as a cylinder with a diameter of 1.745 cm and a thickness of 0.105 cm of water and 0.1 cm of polystyrene on which a monolayer of breast cancer cells is attached (Fig. 1C). To compare cross-dose S values with those of Goddu et al. (12), we used closely packed cubic universal geometry and corresponding cell cluster size as the study volume. Cell nuclei were tallied. The energy deposition function (*F8) was used to record the doses in units of megaelectron volts per starting particle per tally volume, which were then converted into grays per decay (13). For each calculation, 104 electrons were launched to reach an SD of less than 1%. All the energy of emitted electrons lower than 1 keV was deposited locally within the cell compartment where 111In was located.
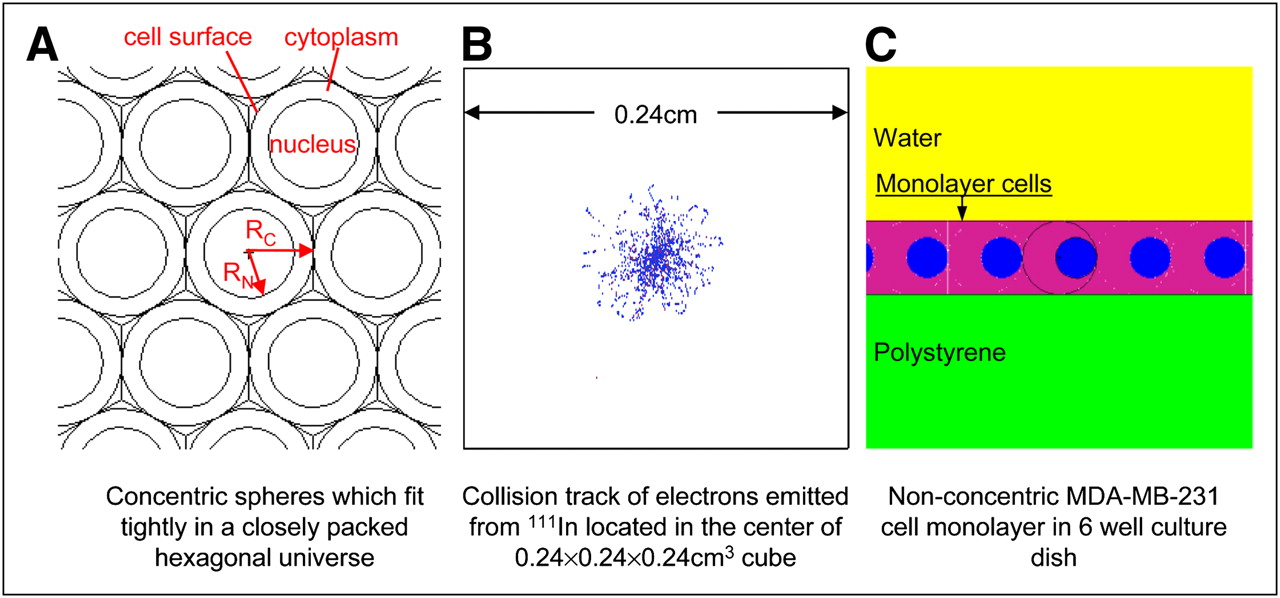
Schematic cell geometry and 111In distributions used in MCNP simulation.
Live Cell Imaging
MDA-MB-468, MDA-MB-361, MDA-MB-231, MCF-7, BT-474, and SKBr-3 human breast cancer cells were purchased from the American Type Culture Collection and cultured in the recommended medium supplemented with 10%−20% fetal bovine serum (GIBCO Invitrogen). We seeded 1 × 10⁵ cells into wells in Lab-Tek II Chamber slides (Thermo Fisher Scientific, Inc.), cultured the cells overnight, and then stained them using Image-iT LIVE Plasma Membrane and Nuclear Labeling Kit (Molecular Probes, Inc.), following the manufacturer's protocol. Hoechst 33342 dye (Molecular Probes, Inc.) and wheat germ agglutinin-Alexa Fluor 594 (Molecular Probes, Inc.) conjugate selectively stain cell nuclei and plasma membrane, respectively. Live cell images were acquired with an LSM 510 Confocal Microscope (Carl Zeiss MicroImaging, Inc.). Optical sections (1.2 μm) through the cells were imaged. At least 30 cells were imaged for each cell line. ImageJ software (U.S. National Institutes of Health) was used to measure the diameter of the cell and nucleus.
Comparison of Radiation Absorbed Dose with Clonogenic Survival
Cell survival curves, that is, SF versus radiation absorbed dose, were assumed to follow the linear-quadratic model and are described by Equation 1 (17,18): Eq. 1where α and β are constants and D is radiation absorbed dose. α and β were 0.4748 and 0.0109 for MDA-MB-468, 0.1086 and 0 for MDA-MB-231, and 0.2119 and 0 for MCF-7 (2).
D in Equation 1 was assumed to be the absorbed dose to the cell nucleus. For 111In-DTPA-hEGF–treated breast cancer cells, cell killing results from 3 independent events (2,4): radiation from 111In specifically localized to the cell surface, in cytoplasm and nucleus, leading to SF1; radiation from nonspecifically bound 111In at the cell surface and 111In in the surrounding growth medium, leading to SF2; and the cytotoxic effects of unlabeled DTPA-EGF, leading to SF3. Thus, the overall SF can be calculated using Equation 2: Eq. 2The percentage relative error (RE) of the MCNP estimated to the experimentally measured SF was calculated by subtracting the calculated from the experimental SF and then dividing by the experimental SF multiplied by 100%.
RESULTS
S Values for 111In Uniformly Distributed in Cell Compartments
Single-Cell Model
To verify the feasibility of using MCNP to calculate subcellular S values, self-dose to the nucleus for 111In uniformly distributed in either nucleus, cytoplasm, or cell surface compartments of a single cell of various dimensions was assessed (Table 1) and compared with the published values by Goddu et al. (8,9) and Farragi et al. (11) (Supplemental Table 1; supplemental materials are available online only at http://jnm.snmjournals.org). SN→N of Goddu et al. were slightly smaller than those for MCNP (ratio of S values using analytic methods vs. MCNP = 0.962–0.995 (8) and 0.971–0.992 (9)), whereas those from Farragi et al. (11) were slightly larger (ratio = 1.011–1.024). Most of the MCNP-calculated SCy→N and SCS→N fell within those reported by Goddu et al. (ratio = 0.662–1.534 (8,9)) and Farragi et al. (ratio = 0.944–1.129 (11)) and agreed well, especially for larger cells (cell radius ≥ 8 μm). For a single cell of the same radius, as the radius of the nucleus increased, both SN→N and SCy→N decreased (Figs. 2A and 2B). The decrease of SN→N was much more apparent than that of SCy→N. The influence of nucleus size on SCS→N was much more subtle than that on SCy→N (Fig. 2B). For a single cell with the same nucleus radius, the cell radius had no effect on SN→N. However, as the cell radius increased, both SCy→N and SCS→N decreased (Fig. 2C). These trends were in good agreement with reports by Goddu et al. (8,9) and Farragi et al. (11). Their data were included in Figure 2 for comparison.
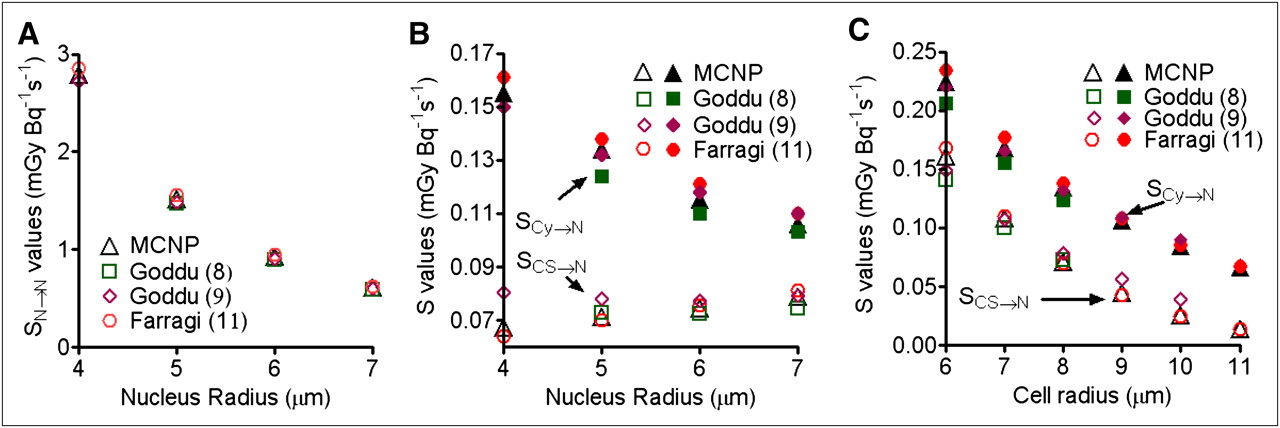
Effects of cell and nucleus radii on self-dose S values in comparison to those reported by Goddu et al. (8,9) or Farragi et al. (11): dependence of SN→N (A) and of SCy→N and SCS→N (B) on nucleus radius with constant cell radius of 8 μm, and dependence of SCy→N and SCS→N (C) on cell radius with constant nucleus radius of 5 μm.
S Values (mGy·Bq−1·s−1) Calculated by MCNP and Using 3 Cell Models
3-Dimensional Cell Cluster Model
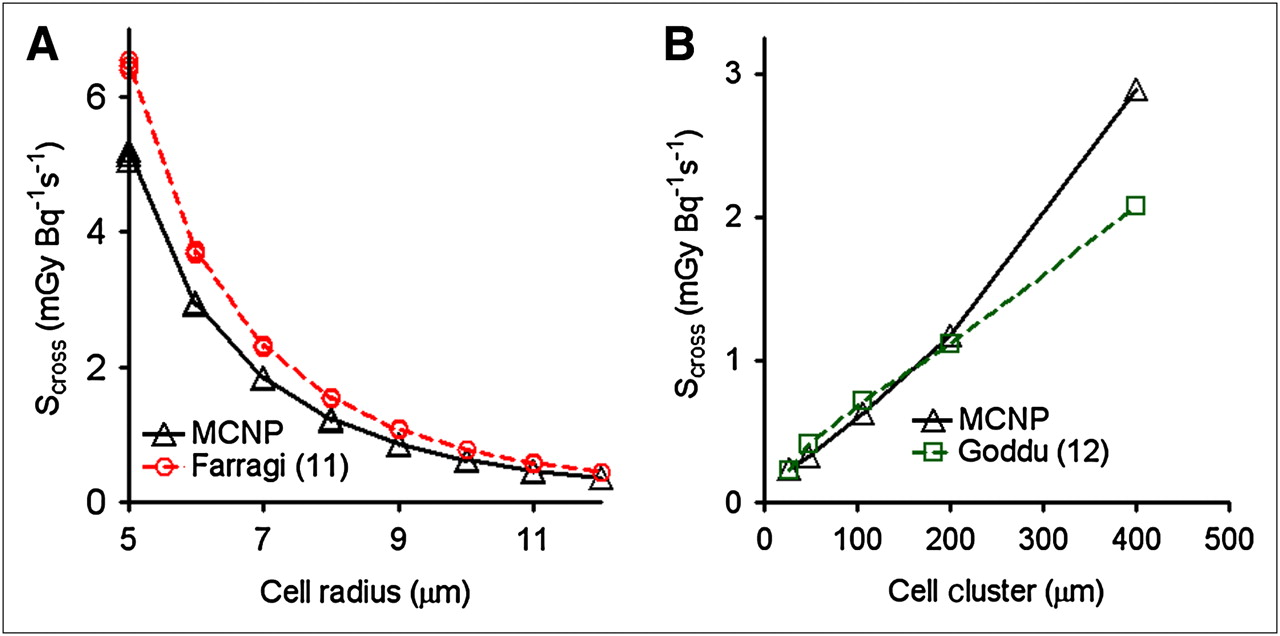
For single cells, the electron energy deposited in the nucleus by 111In was only from the self-dose. In contrast, for cell clusters, the contribution of cross dose to the total dose was not negligible. To test the ability of MCNP to calculate cross-dose S values, we calculated S values to the nucleus for 111In uniformly distributed in various cell compartments of hexagonally closely packed cell clusters and derived cross-dose S values by subtracting self-dose. The cross-dose S values are listed in Table 1 in comparison to the published values (Supplemental Table 2) (11,12). For all calculated cell dimensions, cross-dose S values were independent of subcellular distribution of 111In and the size of cell nuclei but increased as the cell radii decreased. Figure 3A shows an example of the dependence of cross-dose S values on cell radii. The cross-dose S values reported by Farragi et al. (11) were consistently about 25% larger than those calculated by MCNP. To compare with the cross-dose S values reported by Goddu et al. (12), as well as to examine the effect of cell cluster size, we calculated cross-dose S values for various clusters of cells with cell and nucleus radii of 5 and 4 μm, respectively. As shown in Figure 3B, cross-dose S value increased as the cluster size increased. The agreement between the cross-dose S values of Goddu et al. and those calculated by MCNP depended on the size of cell clusters. The greatest discrepancy was observed for the largest size, 400 μm, for which the values calculated by Goddu et al. were 28.4% smaller than the MCNP values.

Monolayer Cell Model
Experiments evaluating the cytotoxic or antiproliferative effects of Auger electron–emitting radiopharmaceuticals often expose cells in monolayer in culture dishes, rather than single cells or cell clusters. Therefore, S values to the cell nucleus for 111In uniformly distributed in various cell compartments of hexagonally closely packed cell monolayer were calculated by MCNP (Table 1) and compared with the S values for single cells and cell clusters (Supplemental Table 3). S values for monolayer cells, especially SCy→N and SCS→N, were much larger than those for single cells (80%−124% and 79%−282% larger than single cell for SCy→N and SCS→N, respectively) but smaller than those for cluster cells (79%−86% and 85%−90% smaller than cluster cells for SCy→N and SCS→N, respectively).
S Values for Breast Cancer Cell Lines
Because the radii of the cell and nucleus had a profound effect on S values and may vary considerably, these dimensions were directly measured for 6 breast cancer cell lines (Fig. 4). All breast cancer cells except MDA-MB-231 showed large nuclei relative to the size of the cells. Though most breast cancer cell lines displayed roughly concentric cells and cell nuclei, the nucleus of MDA-MB-231 cells was closer to one side of the cell surface. S values for the 6 breast cancer cell lines were calculated in 3 models (Table 2). The contribution of Auger and internal conversion electrons to S values for MDA-MB-468 cells, and the effect of acentric versus concentric geometry of cell and nucleus on S values of MDA-MB-231 cells, were studied (Table 2). For the single-cell model, the Auger electrons contributed most to the S values (86%−96%). The contribution of Auger electrons decreased as the crossfire effect of internal conversion electrons increased from monolayer to a cluster of cells. This decrease was most significant for SCS→N (from 86% to 5.9%), followed by SCy→N (from 89% to 10%), and then by SN→N (from 96% to 46%). Acentric and concentric geometry of cell and cell nucleus gave roughly the same SN→N in all 3 models, as well as SCS→N and SCy→N for clusters of cells. However, for single cells and monolayers, SCy→N were smaller for the acentric than for concentric configurations (−22% and −7.3% for single cells and monolayers, respectively); in contrast, SCS→N were larger for acentric than for concentric configurations (33% and 24% for single cells and monolayers, respectively).

Live cell images (central slices) of 6 breast cancer (BC) cell lines (MDA-MB-468, MDA-MB-231, MDA-MB-361, MCF-7, BT-474, and SKBr-3). Cell surfaces (red) were stained by wheat germ agglutinin-Alexa Fluor 594 conjugate, whereas cell nuclei (blue) were stained by Hoechst 33342 dye. RC and RN are mean cell and nucleus radii, respectively.
S Values (mGy·Bq−1·s−1) for Individual Breast Cancer Cell Lines
Comparison of Calculated with Experimental SF
We used our previously published data (2) to compare the MCNP-calculated SF of breast cancer cells exposed to 111In-DTPA-hEGF with the experimental values. First, we calculated the cumulative radioactivity in nucleus, cytoplasm, and cell surface compartments based on the subcellular distribution of 111In in MDA-MB-468, MDA-MB-231, and MCF-7 cells treated with 111In-DTPA-hEGF (3.2 MBq/mL; 21 nM) for 1 h (2). Rapid localization of 111In-DTPA-hEGF in these cell compartments was assumed, and the measured efflux rate of the radiopharmaceutical from the cells in fresh culture medium was considered (1,19). Second, calculation of the absorbed dose to the cell nucleus was based on the derived S values specific for these 3 cell lines of all 3 models. The SF and RE were derived and compared. These calculations and comparisons are shown in Supplemental Table 4. For the monolayer model, all the calculated SF fitted perfectly with the experimentally measured SF (0.62) (2). The RE for MDA-MB-468, MDA-MB-231, and MCF-7 cells was 3.1%, −1.0%, and 1.7%, respectively. There was less agreement for MDA-MB-468 cells using the single-cell model (RE = 8.1%) and cell cluster model (RE = −54%). Because the cumulative radioactivity in MDA-MB-231 and MCF-7 cells was rather small, no notable differences in RE were revealed for these 3 models. Similarly, the SF for MDA-MB-468 cells was projected using the single-cell model of Goddu et al. (8,9) and Farragi et al. (11) and the 3-dimensional cell cluster model of Farragi et al. (11). These projected SF were tabulated and compared (Table 3). Irrespective of whether MCNP or analytic methods were used, the single-cell model was less accurate in predicting the SF; the cell cluster model was much less accurate. In contrast, the monolayer model was the most reliable in projecting the experimental SF, because this model most closely resembled the in vitro experimental conditions.
Comparison of Projected SF* Using Various Dose Calculation Methods
DISCUSSION
This study used the emission spectrum of 111In from AAPM (15). This spectrum was quite similar to that from the MIRD publication (20), except that 2 Auger electrons (8.47 and 183 eV) were included in the AAPM report but not in the MIRD monograph. The difference in total energy released per decay and the contribution of these 2 Auger electrons to the total energy released were both lower than 0.3%. Besides, MCNP followed electron transport only down to 1 keV. Thus, even though we used an earlier published emission spectrum of 111In rather than the most updated spectrum from the MIRD publication, the resulting error in calculated S values should not be significant. To test this assumption, the S values of monolayer MDA-MB-468 cells were recalculated by MCNP using the MIRD spectrum. The ratio of recalculated SN→N, SCy→N, and SCS→N versus those in Table 2 was 1.01, 0.959, and 0.958, respectively, and validated our assumption.
The slight discrepancy between MCNP-generated self- and cross-dose S values and those from the earlier studies of Goddu et al. (8,12) and Farraggi et al. (11) (Supplemental Tables 1 and 2) solely resulted from fundamental differences in energy deposition modeling, because the same 111In decay data from the AAPM report (15) was used in their work and the current study. Various monoenergetic electron (5- to 500-keV) S values for cells of 5-μm cell radius and 4-μm nucleus radius were generated by MCNP and compared with the MIRD S values (9). Depending on energies, the ratio of S values by MCNP versus MIRD ranged from 0.91 to 1.18, 0.80 to 1.31, and 0.81 to 1.32 for SN→N, SCy→N, and SCS→N, respectively. These results further confirmed that the discrepancy came from the modeling.
MCNP was more flexible for modeling various cell geometries in different experimental settings than the analytic methods, and it was also capable of incorporating different element composition and density of the studied volumes. Analytic methods can be applied only in homogeneous media and usually do not account for the element composition in the studied volume (21). Champion et al. similarly described these advantages of Monte Carlo simulation for calculating the subcellular dosimetry of 131I, a β- and γ-emitter, over the analytic methods (22). For the first time, this report provides subcellular S values for 111In in monolayer, which is useful since it represents a common experimental condition for treating cells in vitro with Auger electron–emitting radiopharmaceuticals such as 111In-DTPA-hEGF (2–4) and others (23–25). Single-cell or cell cluster conditions are less common. The predicted SF based on our calculated S values of 111In in cell monolayer fitted almost perfectly with the experimentally determined SF reported previously (2). In contrast, for MDA-MB-468 cells, which had high uptake of 111In after incubation with 111In-DTPA-hEGF, the calculated SF using the S values for the single-cell model overestimated the experimentally determined SF compared with that for the monolayer model (RE = 8.1% vs. 3.1%). Using the S values for the cell cluster model, compared with the monolayer model, dramatically underestimated the SF (RE = −54% vs. 3.1%). The self-dose S values of Goddu et al. (8,9) or Farragi et al. (11) were extrapolated to cells with intermediate dimensions of cell radius of 7.5 μm and nucleus radius of 5.3 μm and were used to calculate the SF for MDA-MB-468 cells; this extrapolation modestly overestimated the experimentally determined SF (RE = 8.1%). The calculated SF for MDA-MB-468 cells using the scaled S values of Farragi's cell cluster model (11) was severely underestimated (RE = −67%). Therefore, it is important to use the S values for the monolayer model to most accurately estimate the radiation absorbed dose to the cell nucleus and to obtain a good correlation with the SF measured in in vitro cytotoxicity experiments. On the other hand, for in vivo experiments such as treating mice bearing tumor xenografts with 111In-DTPA-hEGF or other Auger electron–emitting agents, S values based on the cell cluster model would be more appropriate. Chen et al. reported that nonestablished MDA-MB-468 tumors with an initial volume of 10 mm3 treated with 5 weekly subcutaneous doses of 111In-DTPA-hEGF (cumulative dose of 92.5 MBq, or 17 μg) showed regression (5). A 10-mm3 sphere has a diameter of about 2.6 mm, which is more than 4 times the range of the most energetic electrons emitted by 111In. Thus, it would be more accurate to estimate the radiation absorbed doses to the nucleus of tumor cells in vivo using the S values for the cell cluster model. Calculating the absorbed dose to the nucleus of a 10-mm3 tumor using the self-dose S values for single cells reported by Goddu et al. (8) would greatly underestimate the absorbed doses.
The size of the cell and nucleus had a profound effect on the subcellular S values in all 3 studied models. Thus, we performed live cell imaging of 6 different breast cancer cell lines and determined the mean diameters of the cells and their nuclei, which were larger than anticipated. To our knowledge, the dimensions of these breast cancer cells have never been published. The cell and nucleus diameters of MDA-MB-468 cells were assumed to be 10 and 6 μm, respectively, in the previous microscopic dose distribution projection (5) but were actually 15 and 10.6 μm measured in this study. That projection overestimated the SN→N (6.03 vs. 2.78 mGy·Bq−1·s−1) but underestimated the SCy→N (0.318 vs. 1.66 mGy·Bq−1·s−1) and SCS→N (0.178 vs. 1.53 mGy·Bq−1·s−1). The underestimation of SCy→N and SCS→N due to the use of self-dose S values rather than S values of cell clusters and the overestimation of SN→N due to the assumption of smaller diameters of cell and cell nucleus were partially compensated. Using S values for MDA-MB-468 cell cluster and cumulative radioactivities in nucleus, cytoplasm, and cell surface reported previously by Chen et al. (5), we have reestimated the radiation absorbed doses to the cell nucleus in MDA-MB-468 xenografts as 1.4 Gy at 5% injected dose/g, 8.3 Gy at 30%, and 22.2 Gy at 80%, which were about 1.6 times greater than those previously reported (0.88 Gy at 5%, 5.29 Gy at 30%, and 14.02 Gy at 80%) (5).
In this study, the SF was predicted from our previously published dependency of SF on γ-absorbed doses for these 3 breast cancer cell lines (2). The almost perfect fit between the MCNP-predicted SF and the experimental value suggests that the electrons emitted during the decay of 111In had a relative biologic effect on breast cancer cells similar to that of γ-rays. This means that even if 111In-DTPA-hEGF was translocated to the nucleus of MDA-MB-468 cells, 111In was not sufficiently closely associated with DNA to exhibit high-linear-energy transfer. Nonetheless, nuclear importation is necessary to maximize the radiation absorbed dose. According to the calculation of Chen (26), a distance between 111In and DNA greater than 1 μm results in low-linear-energy transfer and thus RBE similar to γ-rays. MCNP follows electron transport down to 1 keV. The resolution of microscopic dose mapping should be better than 0.1 μm. Therefore, MCNP is capable of modeling the radiation absorbed dose to the cell nucleus (micrometer scale) from Auger electron–emitting radiotherapeutic agents that are not intimately associated with DNA. To model the dose to DNA at the nanometer scale for DNA-binding radiotherapeutics such as 125I-iododeoxyuridine, a detailed history Monte Carlo code that follows the transport of electrons down to 100 eV would be necessary (27). Other methods, such as the inner shell ionization model, have been proposed (28). This model uses a hybrid Monte Carlo simulation method to calculate the amount of inner shell ionization generated by the degraded photon spectrum in the tissues and electron knock-on. Then, an equivalent dose of 0.05 Gy per inner shell ionization is applied, derived from the work of Kassis et al. (29).
CONCLUSION
MCNP is a feasible and reliable method to assess the subcellular radiation absorbed dose from Auger electron–emitting radionuclides in real experimental settings. For the first time, this study calculated the S values to the cell nucleus for 111In at the cell surface, in the cytoplasm, and in the nucleus of cells in monolayer and having various cell and nucleus dimensions. S values obtained from this cell-monolayer model were more appropriate to estimate the absorbed dose for in vitro experiments than those from single-cell or cell cluster models. The cell and nucleus diameters of 6 commonly used breast cancer cell lines were measured and reported for the first time. These individual cell line–specific dimensions had large effects on the calculation of S values and, thus, were important to estimate radiation-absorbed doses accurately in experimental settings.
Acknowledgments
This research was supported by a grant from the Canadian Breast Cancer Research Alliance (grant 019513) with funds from the Canadian Cancer Society.
Footnotes
-
COPYRIGHT © 2010 by the Society of Nuclear Medicine, Inc.
References
- Received for publication February 9, 2009.
- Accepted for publication August 17, 2009.


Jump to section
Related Articles
Cited By...
- Targeting Micrometastases: The Effect of Heterogeneous Radionuclide Distribution on Tumor Control Probability
- Monte Carlo N-Particle (MCNP) Modeling of the Cellular Dosimetry of 64Cu: Comparison with MIRDcell S Values and Implications for Studies of Its Cytotoxic Effects
- Lognormal Distribution of Cellular Uptake of Radioactivity: Monte Carlo Simulation of Irradiation and Cell Killing in 3-Dimensional Populations in Carbon Scaffolds
- Reply: Cellular Dosimetry Using the Geant4 Monte Carlo Toolkit
- Cellular Dosimetry Using the Geant4 Monte Carlo Toolkit
- The Monte Carlo Method in Nuclear Medicine: Current Uses and Future Potential