


Abstract
The purpose of this study was to evaluate the diagnostic efficacy of low-dose, combined 18F-FDG PET/CT enterography (PET/CTE), compared with CT enterography (CTE) alone, in the assessment of patients with Crohn disease. Methods: Thirteen patients with Crohn disease were prospectively enrolled in this pilot study and underwent abdominal–pelvic 18F-FDG PET/CTE using neutral oral and intravenous contrast medium. The effective dose from PET/CTE was 17.7 mSv for the first 4 patients and 8.31 mSv for the last 9 patients. Six patients underwent surgical resection of the bowel, and 7 patients underwent colonoscopy with biopsies within 27 d (mean, 12 d) of PET/CTE. PET/CTE and CTE images were each visually assessed for Crohn disease involvement in 54 bowel segments with pathology correlation. Extraintestinal findings were recorded. A CTE severity score, maximum standardized uptake value (SUVmax), SUVmax ratio, simplified endoscopic score, and clinical parameters were correlated with pathology inflammation grade, on a per-patient basis and on a per-bowel-segment basis, using Spearman correlation. Results: In 3 (23.1%) of 13 patients, 18F-FDG uptake using PET/CTE revealed active inflammation in a bowel segment not evident using CTE (n = 2) or revealed an enterocolic fistula missed with CTE (n = 1). Visual interpretation of both PET/CTE and CTE images detected the presence of disease in all bowel segments with more than mild inflammation (sensitivity, 100%; specificity, 89.7%; positive predictive value, 78.9%; and negative predictive value, 100%). Correlation to inflammation grade per patient was the strongest for the SUVmax ratio (0.735, P = 0.004) and SUVmax (0.67, P = 0.013), as compared with the CTE score (0.62, P = 0.024). Correlation with inflammation per bowel segment was higher for the CTE score (0.79, P < 0.0001) than the SUVmax ratio (0.62, P < 0.0001) or SUVmax (0.48, P < 0.0001). SUVmax correlated strongly with serum C-reactive protein (0.82, P = 0.023), but CTE score did not. Conclusion: Low-dose 18F-FDG PET/CTE, compared with CTE, may improve the detection and grading of active inflammation in patients with Crohn disease. PET/CTE also may reveal clinically significant findings, such as enterocolic fistula, not evident on PET or CTE alone.
Crohn disease is an inflammatory bowel disorder characterized by transmural inflammation and a predilection for involvement of the terminal ileum, the colon, or both (1). Any segment of the gastrointestinal tract may be involved, and the disease is characteristically progressive, often leading to strictures, fistulas, abscesses, and perianal involvement. Up to 80% or more of patients with Crohn disease ultimately require surgical resection (1). Medical management with immunosuppressive antimetabolites, such as 6-mercaptopurine, and biologic therapies targeting tumor necrosis factor, such as infliximab, are effective in inducing mucosal healing and sustained remissions (2). Each of these drugs has potential side effects or complications, and some are expensive (2,3).
Imaging tests, along with endoscopy, pathology, and clinical findings, contribute to the diagnosis of Crohn disease. Imaging tests are also used to assess the extent and severity of disease, including evaluation for complications (4). CT enterography (CTE) is currently the most useful imaging test for the evaluation of patients with Crohn disease, although MR enterography shows promise and does not use ionizing radiation (5,6). CTE depicts not only the luminal narrowing of diseased bowel segments but also the mucosal or mural abnormalities and extraintestinal findings, such as fistulas or abscesses (7). CTE can be used to assess all segments of bowel in the abdomen and pelvis. CTE and MR enterography findings correlate with the presence of active inflammation; however, their role in quantifying inflammation and assessing response to therapy is not well defined (8–10). CTE and MR enterography may have a limited ability to confirm resolution of inflammation, because bowel wall thickening and enhancement may persist during clinical remission (11,12).
Prior studies have shown that 18F-FDG PET or PET/CT can be used to detect moderate to severe inflammation of bowel involved with Crohn disease (13–18). Mild inflammation, however, is less reliably detected and false-positive findings caused by physiologic bowel activity have been noted. Combining 18F-FDG PET with CTE (PET/CTE), using neutral oral and intravenous contrast material, and a dedicated PET/CT scanner has received little attention to date but offers the potential for combining the anatomic detail of CTE with the metabolic characterization and quantification of 18F-FDG PET in the assessment of Crohn disease (19). The purpose of this study was to evaluate the diagnostic efficacy of low-dose 18F-FDG PET/CTE, compared with CTE alone, in the assessment of patients with Crohn disease.
MATERIALS AND METHODS
Patients
A prospective pilot study, approved by the Institutional Review Board and complying with the Health Insurance Portability and Accountability Act, combining 18F-FDG PET and CTE into a dedicated PET/CTE protocol, was conducted from December 2008 to January 2010. Thirteen patients (4 men, 9 women; age range, 23–78 y; mean age, 48.5 y) were enrolled after they provided written informed consent. All patients had known Crohn disease, clinically suspected active disease, and clinical indications for both CTE and either colonoscopy or surgical bowel resection. The number of years since initial diagnosis of Crohn disease ranged from 1 to 55 y (mean, 20.4 y). Five patients had a history of prior bowel resection for Crohn disease but none in the previous 12 mo. Exclusion criteria included pregnancy, suspected bowel perforation, abdominal abscess, allergy to iodinated intravenous contrast material, and renal insufficiency. Body mass index (BMI) ranged from 18.8 to 34.3 kg/m2 (mean, 28.8 kg/m2). Six patients underwent surgical resection of bowel, from 4 to 17 d, after PET/CTE. Two patients underwent colonoscopy, with biopsies performed 6 and 7 d, respectively, after PET/CTE; 5 patients had colonoscopy with biopsies performed 5–27 d before PET/CTE. Overall, pathology specimens were obtained within a mean of 12 d of PET/CTE.
18F-FDG PET/CTE Technique
Patients were instructed to avoid sugar-containing foods and strenuous physical activity for 24 h. Oral intake was limited to water for 6 h before arrival. The 18F-FDG dose and CT tube current (mA) were reduced, after the first 4 patients, to further minimize the radiation dose of PET/CTE while maintaining diagnostic image quality. The first 4 patients received an intravenous 18F-FDG dose of 414–773 MBq (mean, 529 MBq [14.3 mCi]; mean, 6.7 MBq/kg [0.18 mCi/kg]), and the last 9 patients received 181–222 MBq (mean, 196 MBq [5.3 mCi]; mean, 3.3 MBq/kg [0.09 mCi/kg]). The mean dose for all 13 patients was 300 MBq (8.1 mCi; 4.25 MBq/kg [0.11 mCi/kg]). The 18F-FDG uptake period ranged from 57 to 94 min (mean, 71 min). Blood glucose levels were measured immediately before tracer administration in all patients and ranged from 76 to 132 mg/dL (mean, 94 mg/dL).
Immediately after 18F-FDG administration, all patients drank 1,350 mL of a refrigerated neutral oral contrast agent (0.1% w/v barium sulfate suspension; VoLumen [E-Z-EM, Inc.]) during the 60 min before imaging. A Discovery VCT (GE Healthcare) PET/CT scanner with 64-detector row CT was used. After voiding, patients underwent a single CT acquisition of the abdomen and pelvis using intravenous iopromide (300 mgI/mL; Ultravist [Bayer Healthcare Pharmaceuticals]). Twelve patients received 150 mL at 3 mL/s, with a 70-s scan delay, and 1 patient with fragile veins received 70 mL at 1.5 mL/s. CT was performed with 120 kVp, a 1.375 pitch factor, and a 0.6-s rotation time. The tube current was 200–300 mA (mean, 250 mA; mean mA-to-BMI ratio, 8.7) in the first 4 patients and 100–250 mA (mean, 137 mA; mean mA-to-BMI ratio, 5.7) in the remaining 9 patients. Mean tube current for all 13 patients was 172 mA, and mean mA-to-BMI ratio was 6.7. PET images were obtained from bottom to top in 2-dimensional mode, allowing 4 min per bed position.
Transaxial and coronal CT images were reconstructed with a 2.5-mm thickness and 2.5-mm interval, using a 512 × 512 matrix. The PET dataset was reconstructed using the CTE dataset for attenuation correction and an ordered-subset expectation maximization algorithm. PET images were displayed with a 3.27-mm thickness and 2.5-mm interval, using a 128 × 128 matrix.
Radiation Dose
The effective dose from 18F-FDG PET was estimated using a ratio of 14.1 mSv to 740 MBq (20). The effective dose for CTE was estimated by multiplying the dose–length product for each patient examination by a normalized effective dose conversion factor for the abdomen and pelvis (21). The 18F-FDG PET/CTE effective dose for the first 4 patients ranged from 13.9 to 23.9 mSv (mean, 17.7 mSv; CTE contributed 7.69 mSv, and 18F-FDG PET contributed 9.99 mSv). The effective dose for the last 9 patients ranged from 6.5 to 11.5 mSv (mean, 8.31 mSv; CTE contributed 4.56 mSv, and 18F-FDG PET contributed 3.75 mSv).
Imaging Interpretation
CTE images were interpreted by consensus, at a Centricity (GE Healthcare) workstation, by 2 attending radiologists with 3–6 y of experience reading CTE scans and unaware of PET and clinical information other than the diagnosis of Crohn disease. PET/CTE scans were subsequently read by consensus, as a combined study, by an attending radiologist with 3 y of experience reading CTE and 9 y of experience reading PET or PET/CT scans and by an attending nuclear medicine physician with 11 y of experience reading PET or PET/CT scans. The 2 PET/CTE readers were aware of CTE results but unaware of clinical information other than the diagnosis of Crohn disease; studies were interpreted at the Xeleris (GE Healthcare) workstation. One reader participated in both the initial CTE interpretation and the subsequent PET/CTE interpretation. PET and CTE datasets were each assessed for image quality and were rated as either of good diagnostic quality or of suboptimal diagnostic quality.
Imaging findings related to the bowel were recorded by segments including the stomach, duodenum, proximal small bowel, middle small bowel, distal small bowel, terminal ileum, cecum, ascending colon, transverse colon, descending colon, sigmoid colon, and rectum. A bowel segment was further subdivided if multiple regions of the segment had corresponding pathology specimens. In patients with prior surgery, some bowel segments were absent. Visual assessment of PET/CTE and CTE images was used to determine the presence or absence of Crohn disease involvement of the bowel and extraintestinal findings. To minimize PET/CTE false-positive results related to physiologic uptake, 18F-FDG uptake in the bowel was considered abnormal only if uptake was greater than that in adjacent bowel loops and if a corresponding CTE abnormality was present.
In addition to visual assessment of CTE images, a composite CTE score was devised to quantify the severity of Crohn disease in each segment (Table 1). A CTE score of zero indicated no abnormality, and scores from 1 to 10 were considered increasingly abnormal. Each bowel segment was assigned a CTE score. The highest CTE score per patient was recorded. In addition to visual assessment of 18F-FDG PET scans, active inflammation—based on the maximum standardized uptake value (SUVmax), normalized to body weight, within a region of interest including the most 18F-FDG–avid portion of each bowel segment—was semiquantitatively assessed. The ratio of SUVmax in each bowel segment to the SUVmax of normal small bowel, with a CTE score of zero, was also calculated. The highest SUVmax and SUVmax ratio in each patient were recorded.
Composite CTE Severity Scoring Method (CTE Score)
For patients who did not undergo surgery, the severity of disease at colonoscopy was visually assessed for each accessible bowel segment including the terminal ileum using the simplified endoscopic score for Crohn disease (22). Each segment had a potential score ranging from 0 (normal) to 12 (severe). Segmental scores were used, rather than total score, because of variation in the number of bowel segments evaluated from patient to patient and also to facilitate correlations by bowel segment.
Clinical Parameters
All patients were evaluated with the Harvey–Bradshaw index on arrival for PET/CTE. This clinical tool measures Crohn disease activity based on the severity of symptoms and other clinical manifestations of Crohn disease (23). Scores can range from 0 to 15 or higher. High scores indicate a poor clinical condition. Patients were also evaluated with the Inflammatory Bowel Disease Questionnaire (24). This standardized, 32-question survey assesses patients’ quality of life. Scores can range from 32 to 224, with high scores indicating better quality of life. The serum C-reactive protein (normal ≤ 3.0 mg/L) was recorded if obtained within 30 d of PET/CTE.
Pathology Assessment
All patients underwent pathology evaluation, by 1 gastrointestinal pathologist, based on endoscopic biopsies (n = 7) or surgically resected bowel specimens (n = 6). Fifty-four bowel segments, including 19 small bowel and 35 colorectal segments, were analyzed. Each pathology specimen was graded for the presence and degree of inflammation using a 5-point scale: 0, normal (no chronic or active inflammation); 1, chronic inactive disease; 2, mild activity; 3, moderate activity; and 4, severe activity. In addition, surgically resected strictures were classified as either predominantly fibrotic, predominantly inflammatory, or mixed fibrotic–inflammatory, based on the degree of fibrosis and degree of inflammation in the bowel wall.
Statistical Methods
The sensitivity, specificity, and positive and negative predictive values, with 95% confidence intervals, on a per-bowel-segment basis, for the visual interpretation of 18F-FDG PET/CTE scans, visual interpretation of CTE scans, and simplified endoscopic score were assessed for detection of Crohn disease involvement using 2 pathology inflammation thresholds.
To determine how imaging, endoscopic, and clinical parameters correlated with pathology inflammation grading, on a per-patient basis, the Spearman correlation was applied to the highest CTE score, highest SUVmax, highest SUVmax ratio, highest simplified endoscopic score, Harvey–Bradshaw index, Inflammatory Bowel Disease Questionnaire, C-reactive protein, and highest pathology grade for each patient. For correlation with inflammation, on a per-bowel-segment basis, the Spearman correlation was applied to the CTE score, SUVmax, SUVmax ratio, simplified endoscopic score, and pathology grade of each bowel segment in all patients.
RESULTS
Imaging and Pathology
18F-FDG PET and CTE images were rated of good diagnostic quality in all cases, regardless of dose (Fig. 1). Eleven patients (84.6%), all of whom had active disease confirmed either by pathology (n = 10) or by endoscopic visualization without biopsy (n = 1), had abnormal CTE and PET/CTE scans. Two patients (15.4%) had normal CTE and PET/CTE scans. In both cases, pathology specimens revealed no more than mild (grade ≤ 2) activity. Nine patients (69.2%) had at least 1 bowel segment with severe (grade 4) activity (Table 2).
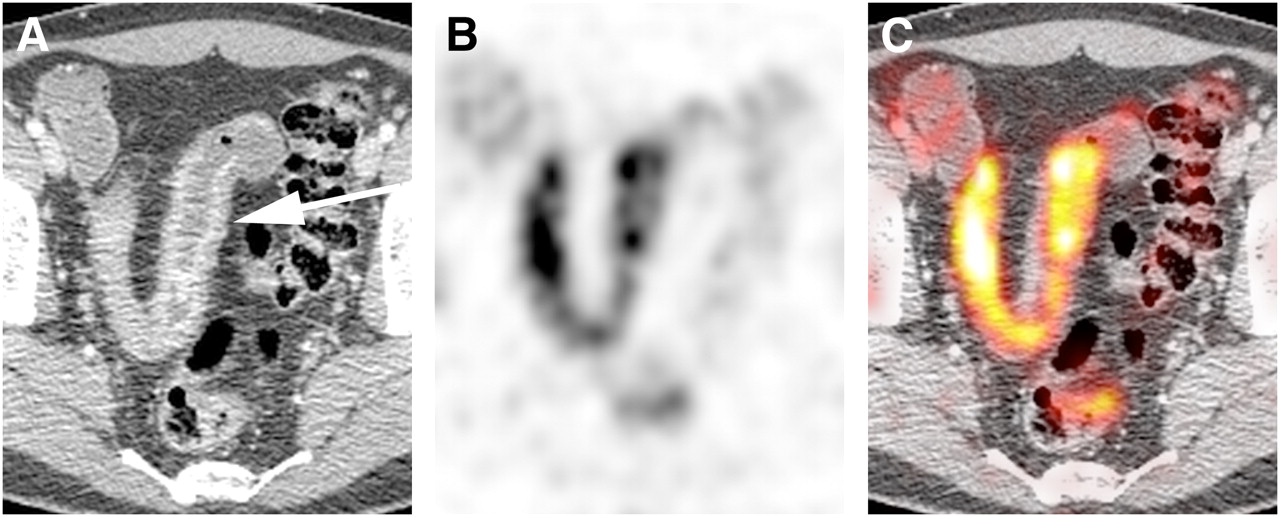
Axial CTE (A), 18F-FDG PET (B), and fused PET/CTE (C) images demonstrating good diagnostic image quality in study patient with lowest 18F-FDG dose relative to body weight and second lowest CT tube current relative to BMI. CTE demonstrates mural thickening and mucosal enhancement in loop of ileum (arrow) involved with Crohn disease. Corresponding 18F-FDG uptake is seen on PET. Excellent anatomic registration of PET and CTE findings on PET/CTE is typical in advanced Crohn disease because of fixation of bowel loops caused by surrounding inflammation and fibrofatty proliferation.
Clinical, Imaging, and Pathology Data by Patient
18F-FDG PET results enabled visual PET/CTE identification of clinically significant findings, not evident on CTE alone, in 3 (23%) of 13 patients. In 2 patients, increased 18F-FDG uptake revealed active inflammation in segments of bowel that demonstrated nonspecific mural thickening on CTE (Fig. 2). In the third patient, 18F-FDG uptake bridging a loop of small bowel and sigmoid colon led to a PET/CTE diagnosis of enterocolic fistula (Fig. 3).

Oblique coronal PET/CTE image (A) demonstrates 18F-FDG–avid stricture (arrow) at junction of distal small bowel and ileoanal J pouch. Skip lesion further upstream is also 18F-FDG–avid. Axial CT image (B) through upstream skip lesion demonstrates nonspecific mural thickening (arrow) without contrast enhancement or surrounding fat stranding to indicate acute inflammation. Corresponding PET/CTE image (C) shows 18F-FDG uptake in skip lesion, indicating active inflammation.

Axial CTE image (A) demonstrates thickened loop of ileum (white arrow) in pelvis and unremarkable adjacent loop of sigmoid colon (black arrow). No fistula was appreciated on CTE. Corresponding 18F-FDG PET image (B) reveals increased tracer uptake in ileum (arrow) consistent with active Crohn disease; however, anatomic detail is insufficient to suggest enterocolic fistula. Fused PET/CTE image (C) clearly demonstrates 18F-FDG uptake (arrow) bridging ileum and sigmoid colon, with focal uptake present in wall of sigmoid colon. PET/CTE diagnosis of enterocolic fistula was confirmed at surgery.
On the basis of an analysis of 54 segments of bowel in 13 patients, the sensitivity, specificity, and positive and negative predictive values for the detection of Crohn disease involvement were identical for the visual interpretation of PET/CTE and CTE images (Table 3). PET/CTE and CTE both enabled detection of all segments of bowel with at least moderate (grade ≥ 3) activity.
Detection of Bowel Involvement with Crohn Disease Using 2 Pathology Inflammation Thresholds
Clinical Parameters and Colonoscopy
The mean Harvey–Bradshaw index value was 5.3 (range, 0–13). The mean Inflammatory Bowel Disease Questionnaire score was 159 (range, 67–210). Serum C-reactive protein levels, ranging from 1.9 to 29 mg/L (mean, 13.1 mg/L), were available in 7 patients. For the 7 patients who did not undergo surgical resection, colonoscopy enabled detection of all abnormal segments with at least moderate (grade ≥ 3) activity, but with somewhat lower specificity than CTE and PET/CTE (Table 3).
Correlation with Inflammation
The Spearman correlation coefficient using the highest pathology inflammation grade on a per-patient basis was strong for the highest SUVmax ratio (0.735, P = 0.004) and substantial for the highest SUVmax (0.67, P = 0.013). Both standardized uptake value parameters outperformed the highest CTE score (0.62, P = 0.024). The Harvey–Bradshaw index, Inflammatory Bowel Disease Questionnaire, highest simplified endoscopic score, and C-reactive protein did not demonstrate statistically significant correlations with the highest inflammation grade per patient. The highest SUVmax correlated strongly (0.82, P = 0.023) with C-reactive protein, whereas the CTE score did not show significant correlation with C-reactive protein. The Spearman correlation coefficient using pathology inflammation grade, on a per-bowel-segment basis, was higher for the CTE score (0.79, P < 0.0001) than for the SUVmax ratio (0.62, P < 0.0001) or SUVmax (0.48, P < 0.0001). The correlation coefficient for the simplified endoscopic score was 0.63 (P < 0.0001).
Strictures
Five of the 6 patients who underwent surgery had bowel strictures resected. The predominant type of stricture was classified as fibrosing in 1 patient, inflammatory in 2, and mixed inflammatory–fibrosing in 2 others. The SUVmax corresponding to these strictures ranged from 5.9 to 8.5 (mean, 7.0). The SUVmax in the 3 bowel strictures identified on imaging, but not requiring surgical resection, ranged from 3.5 to 6.4 (mean, 5.2). The difference in mean SUVmax between the surgical and nonsurgical strictures was not statistically significant (P = 0.085).
DISCUSSION
This radiologic–pathologic–clinical correlation study suggests additional diagnostic value for low-dose 18F-FDG PET/CTE, compared with CTE alone, in the assessment of patients with suspected active Crohn disease. 18F-FDG uptake on PET/CTE images enables detection of acute inflammation in the bowel, which on CTE images alone may demonstrate only mural thickening, without more specific CTE features of acute inflammation. CTE findings, other than abscesses or fistulas, which suggest acute inflammation, include mucosal or mural hyperenhancement, fat stranding, and hyperemia (25). Mural thickening and hyperenhancement, although usually present in the setting of acute inflammation, often persist after acute inflammation has resolved, making these findings nonspecific for acute inflammation (11,12). Combined 18F-FDG PET/CTE, including review of fused image datasets, can also enable detection of morphologic manifestations of Crohn disease, such as enterocolic fistula, that may not be apparent on PET or CTE images alone.
The accuracy of visual interpretation of PET/CTE and CTE images was identical in the detection of bowel involvement with Crohn disease. The study requirement, that a CTE abnormality should be present to correlate with 18F-FDG uptake in order for the uptake to be considered abnormal on PET/CTE, explains the identical performance and helped to minimize false-positive PET findings due to physiologic 18F-FDG uptake in the bowel. There were only 2 bowel segments in a single patient in whom 18F-FDG uptake, with SUVmax ratio of at least 1.5, had the potential to detect active inflammation confirmed on pathology but without corresponding CTE abnormality. In contrast, 5 segments of bowel in 4 patients demonstrated SUVmax ratios of 1.5 or more without corresponding CTE or pathology abnormality. In the only other published study to date, using combined 18F-FDG PET/CTE, but without pathology assessment of inflammation, the authors also found that PET findings did not improve the sensitivity of PET/CTE over CTE in detecting bowel involvement in patients with Crohn disease (19). Their findings, and ours, are consistent with the previously reported high accuracy of CTE in detecting Crohn disease involvement of the bowel (6,10,25,26).
The similar SUVmax, in the 5 bowel strictures resected at surgery and the 3 strictures not requiring surgical resection, suggests that SUVmax may not be reliable in determining the need for surgical management. Low SUVmax has been suggested as more likely to correlate with predominantly fibrotic strictures requiring surgical management. In 1 study, SUVmax less than 2.35 was retrospectively found to correlate with poor response to medical therapy and need for surgical management (19). In another study, SUVmax, normalized to lean body mass, of less than 8.0 correlated with the need for surgical management (27). In our study, however, mean SUVmax was higher in surgically resected strictures than in medically managed strictures.
Clinical indices of disease activity, although helpful in assessing patients with Crohn disease, do not consistently correlate with disease activity observed at colonoscopy or pathology (28). This inconsistency was (also) observed in our study. On a per-patient basis, SUVmax ratio and SUVmax correlated better with inflammation than CTE; on a per-bowel-segment basis, CTE correlated better than the standardized uptake parameters. C-reactive protein, a useful clinical marker of systemic inflammatory response, was found to strongly correlate with SUVmax but not with CTE score (29). The high prevalence of active disease in our patient population may have favored the correlation of CTE score with inflammation. The lack of specificity of CTE parameters indicating disease activity would likely overestimate active inflammation in a population that included more patients with an absence of activity or with mild activity. This lack of specificity of CTE parameters and the tendency of CTE manifestations of Crohn disease to change slowly over time may limit the role of CTE in monitoring response to medical therapy. 18F-FDG uptake, on the other hand, may provide a more direct and dynamic measure of inflammation, including the ability to localize and quantify inflammation within individual patients (Fig. 4).

Oblique sagittal PET/CTE image (A) reveals increased 18F-FDG uptake in terminal ileum, greater in distal (5.0 cm; arrow) than in proximal (5.0 cm) region. Pathology inflammation scores from endoscopic biopsies were 4 (severe) and 2 (mild), respectively, illustrating ability of 18F-FDG PET to quantify relative degrees of inflammation. Axial PET/CTE image (B) from another patient illustrates tendency of Crohn disease to preferentially involve mesenteric border of bowel. Inflammatory 18F-FDG uptake is much greater along mesenteric border (arrow) than along antimesenteric border.
18F-FDG PET is increasingly used for monitoring response to therapy in a variety of malignancies (30), and a similar role for 18F-FDG PET in inflammatory conditions is beginning to be explored (31–33). If 18F-FDG uptake proves capable of accurate, early assessment of response to therapy in patients with Crohn disease, this information may enable modification or discontinuation of ineffective drug therapies that carry significant toxicities or expense.
After baseline 18F-FDG PET/CTE, follow-up PET/CT protocols for therapy monitoring could be performed without intravenous contrast and using a tube current as low as 10 mA to further decrease radiation dose. Crohn disease characteristically shows little change in anatomic distribution over time, and bowel loops involved with Crohn disease tend to become fixed in anatomic location within the abdomen as the disease progresses (Fig. 1) (34). This not only facilitates excellent anatomic registration of diseased bowel on PET and CTE datasets but also would facilitate correlation of SUVmax measurements on initial and follow-up PET/CTE scans, even with limited CT image quality. The potential for intravenous contrast enhancement of the bowel to alter SUVmax used for comparison of enhanced and unenhanced PET/CTE is a theoretic concern, but on the basis of prior studies this potential is not likely to clinically significantly affect the outcome (35). We did not observe artifacts related to the use of intravenous contrast or chilled oral contrast in this study. PET/CTE, using optimized tube current and contrast materials, could be reserved for the initial assessment of Crohn disease or when complications of Crohn disease such as perforation, abscess, or obstruction are suspected.
One limitation of our study was the small number of patients enrolled due to budget limitations and lack of payer coverage of PET/CT for inflammatory conditions. This was intended, however, to be a pilot study, and the costs of PET/CT were covered, in part, through an extramural source. The patient population was not representative of all patients with Crohn disease but rather focused on patients with active disease. The small number of study participants and the high prevalence of active disease were addressed through analysis of data not only per patient but also per bowel segment, normal and abnormal, with pathology correlation. Pathology scoring of inflammation was based on endoscopic biopsies in 7 patients and surgical pathology in 6 patients. Histopathology assessment of the entire bowel wall and adjacent mesentery would have been preferable in every case, but because not all patients required surgical management, endoscopic biopsies provided the next best standard.
CONCLUSION
18F-FDG PET/CTE appears to improve the assessment of patients with Crohn disease by confirming the presence of active inflammation when CTE findings alone are nonspecific. The viewing of fused PET/CTE images can enable the diagnosis of clinically significant findings, such as enterocolic fistulas, that may otherwise be inconspicuous on PET or CTE images alone. SUVmax and SUVmax ratio offer semiquantitative assessment of active inflammation that correlates well with histopathology grading of inflammation and serum C-reactive protein. SUVmax was not helpful in differentiating strictures that require surgical resection from those that do not. Combining 18F-FDG PET and CTE in a low-dose PET/CTE protocol provides a comprehensive imaging assessment of both disease activity and disease morphology in patients with Crohn disease.
Acknowledgments
We thank Shu-Huei Shen for her assistance in data collection and Richard D. Nawfel for his assistance with radiation dose calculations. This study was funded through the Wylie J. Dodds Research Award (Society of Gastrointestinal Radiologists).
- © 2010 by Society of Nuclear Medicine
REFERENCES
- Received for publication June 30, 2010.
- Accepted for publication September 7, 2010.


