


Article Figures & Data
Figures
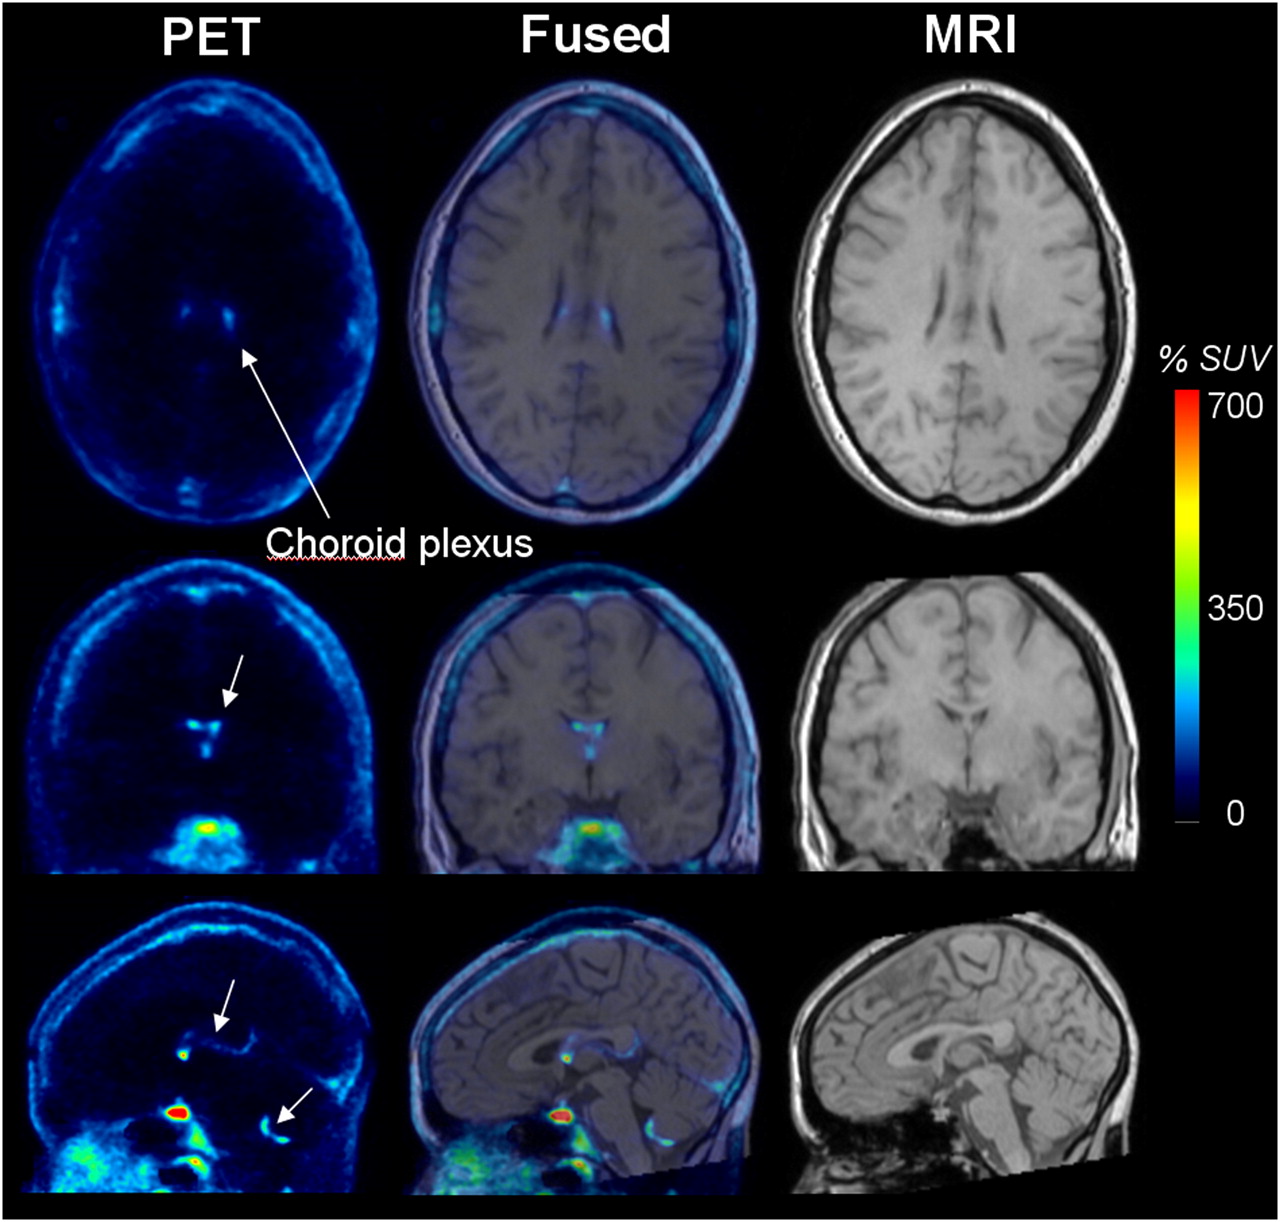
- FIGURE 1.
PET images of 11C-dLop in human brain and corresponding MR image. PET images were summed from 0 to 90 min, and pixel values represent mean concentration of radioactivity (%SUV). Coregistered MR images and fused PET and MR images are also shown. Arrows point to choroid plexus on medial surfaces of lateral ventricles and on roof of third and fourth ventricles.
- FIGURE 2.
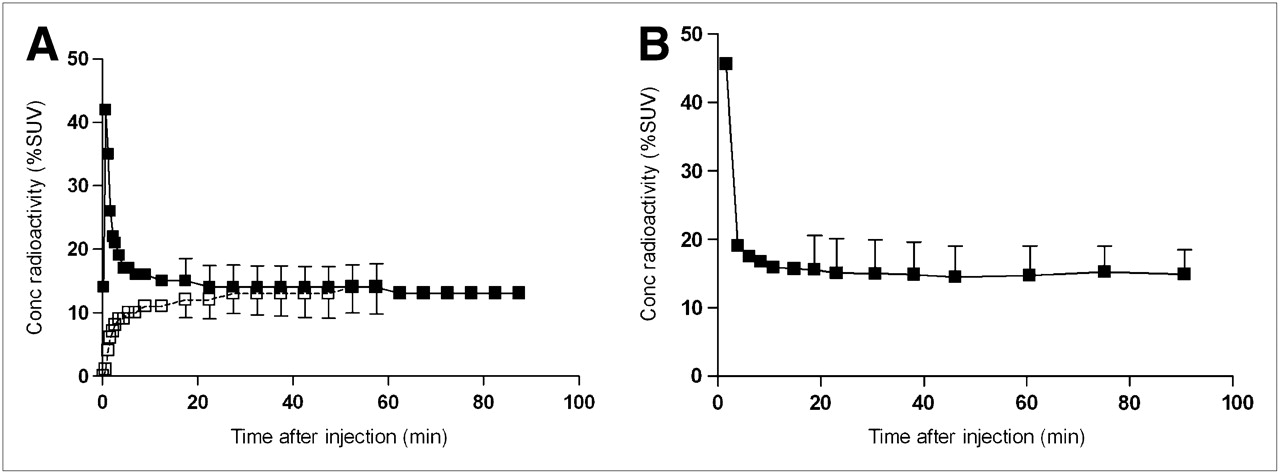
(A) Concentration of radioactivity in brain, with (□) and without (▪) vascular correction, in 4 subjects who had head-dedicated imaging. Symbols represent mean values. SD bars are included for all points after 18 min. Note that SD bars are smaller than symbols for all points after 60 min. (B) Concentration of radioactivity in brain in 8 subjects who had whole-body imaging. Vascular correction of brain activity could not be performed in these subjects, because no blood was collected during scanning. Conc = concentration.
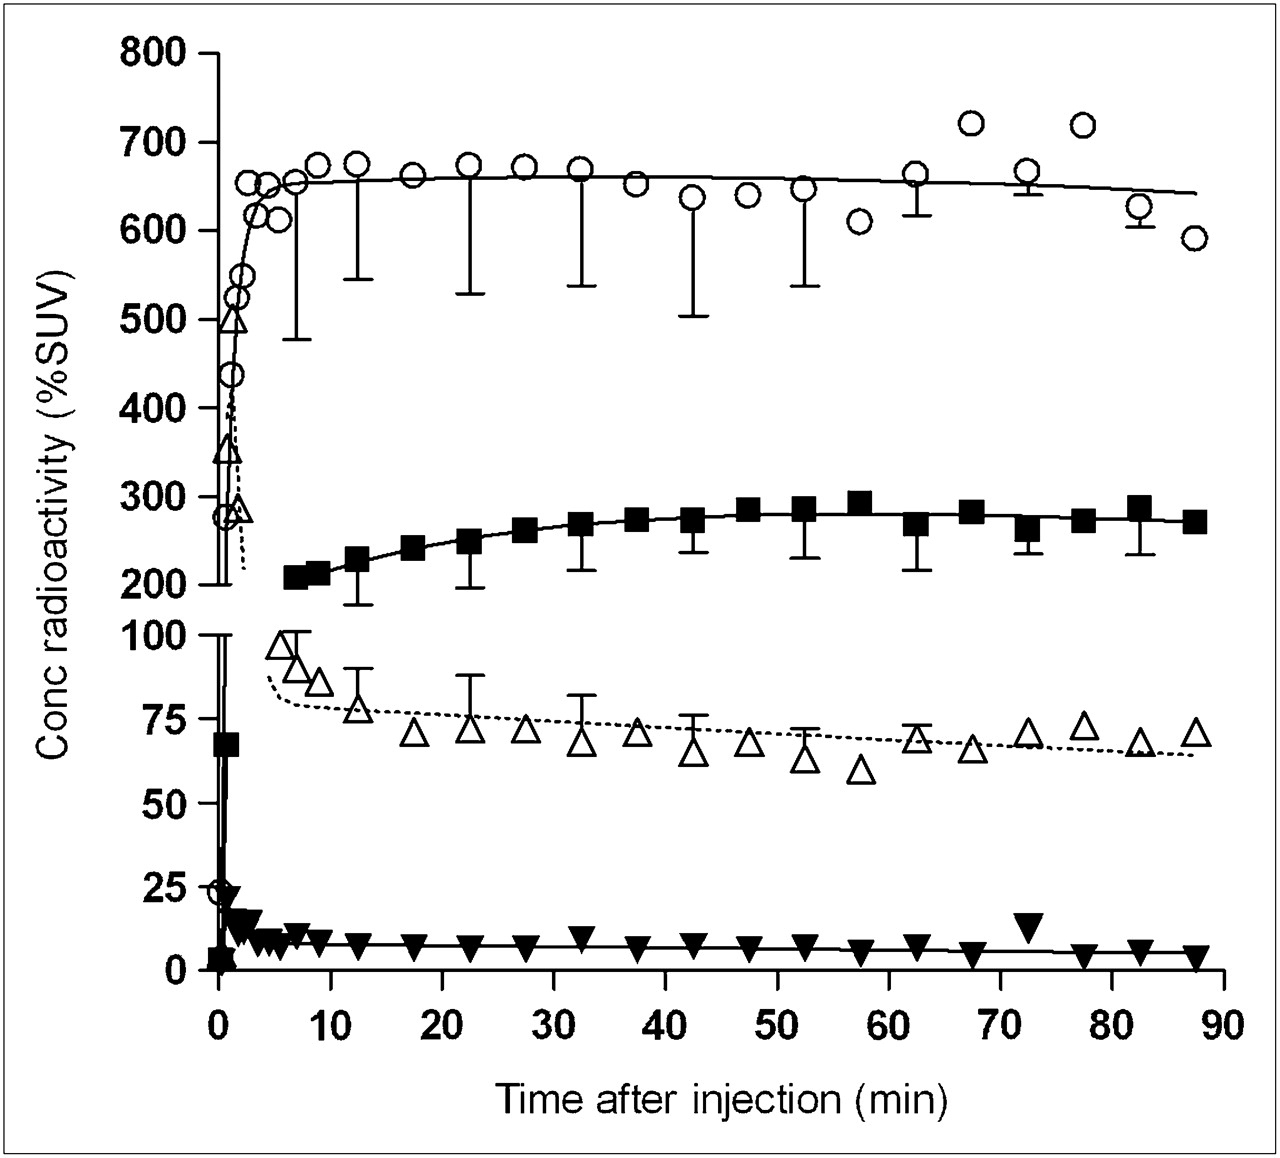
- FIGURE 3.
After injection of 11C-dLop, radioactivity in pituitary gland (○) and choroid plexus (▪) peaked quickly and remained stable during course of scan, whereas uptake in venous sinus (▵) and fourth ventricle (i.e., CSF) (▾) peaked quickly and stabilized at lower level. Symbols represent mean values in 4 subjects. For clarity, SD bars are included only after 5 min and for every other time point. Conc = concentration.
- FIGURE 4.
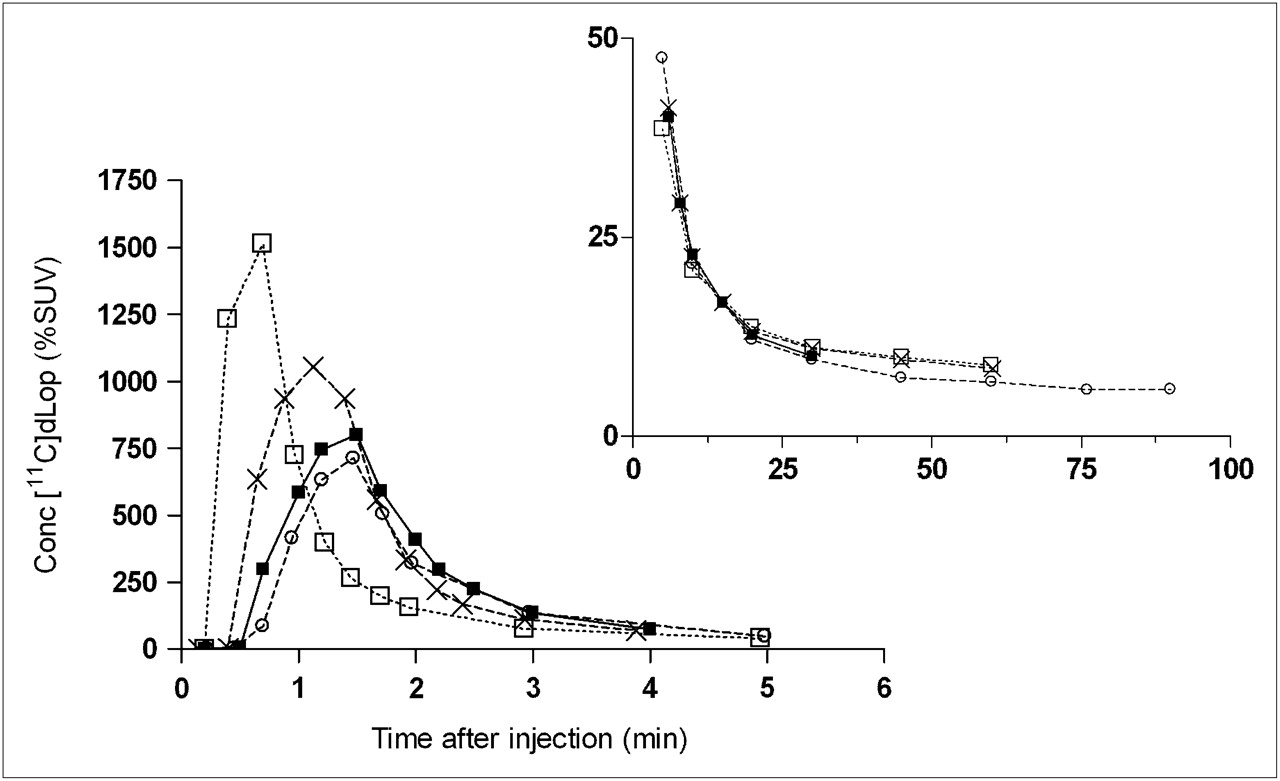
Concentration of unchanged 11C-dLop in plasma after radiotracer injection. Curve is shown with 2 time intervals (0–5 min and 5–90 min) because of high concentrations at early time points. Each symbol represents 1 of the 4 healthy control subjects. Conc = concentration.
- FIGURE 5.
(A) Percentage composition of plasma radioactivity over time is shown for 11C-dLop (▪) and total radiometabolites (○) (n = 4 subjects). Symbols represent mean ± SD, although SD is sometimes smaller than size of symbol. (B) Representative radiochromatogram of plasma at 30 min after injection of 11C-dLop. Parent constituted 88% of total radioactivity. Radiometabolites (A−E) are less lipophilic than11C-dLop. cps = counts per second.
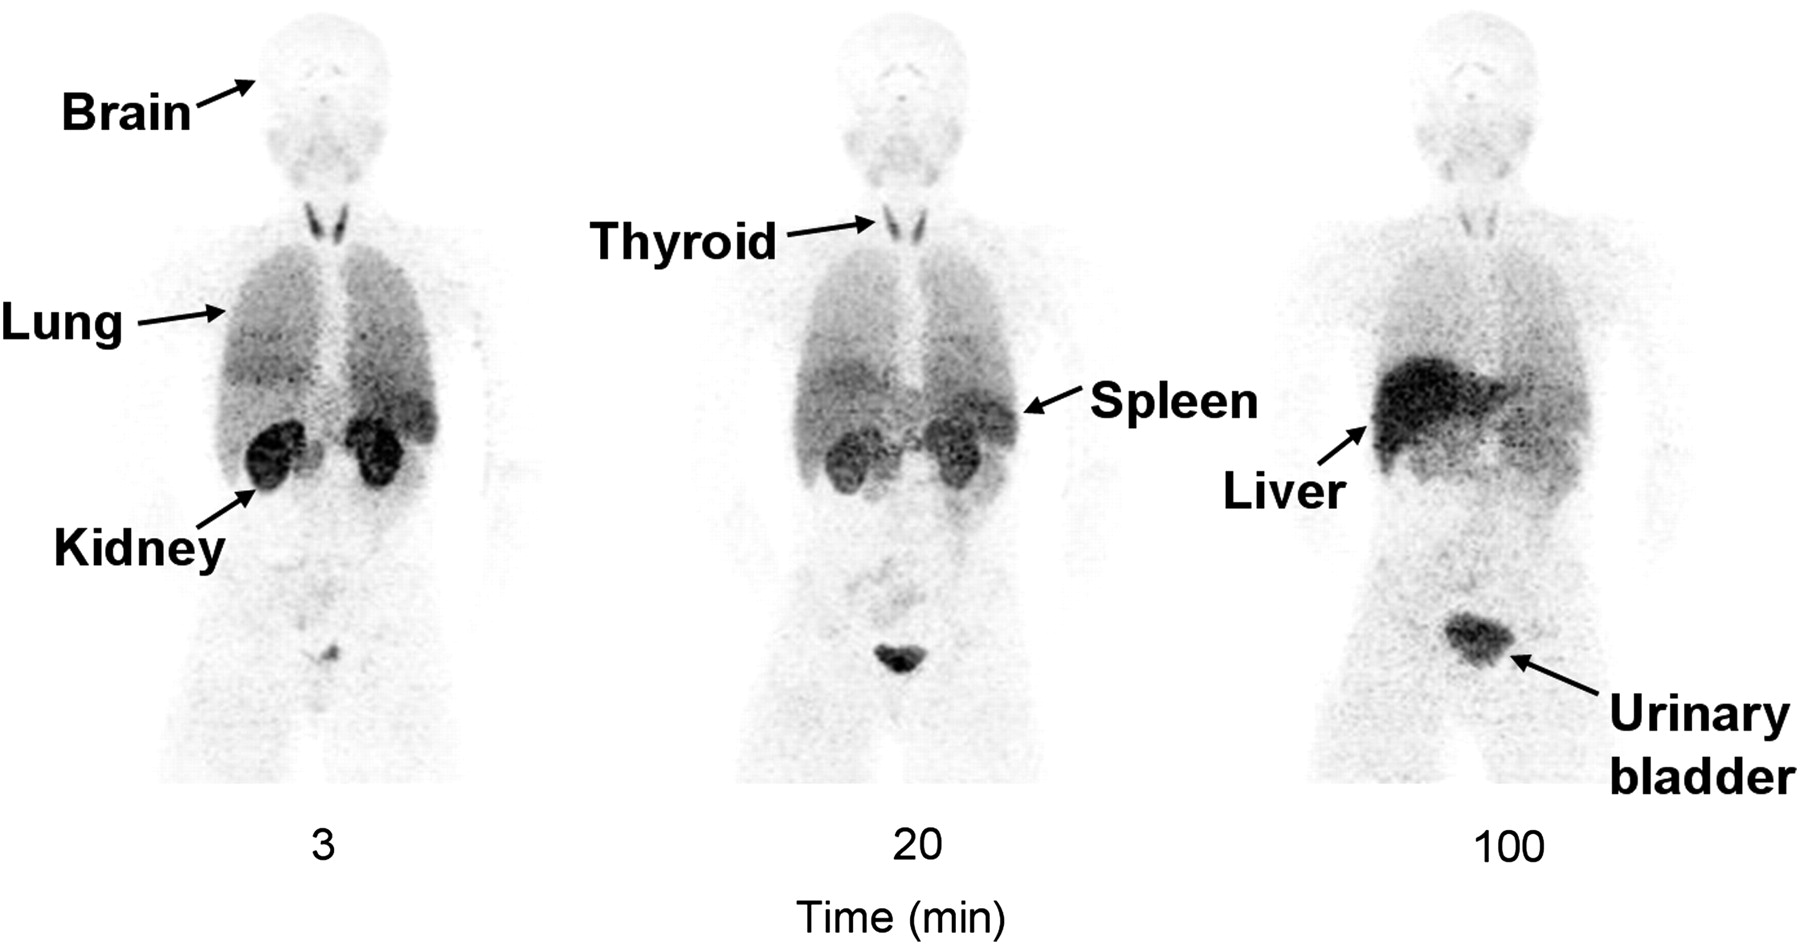
- FIGURE 6.
Maximal-intensity-projection images of distribution of radioactivity in healthy male subject at 3, 20, and 100 min after injection of 11C-dLop.
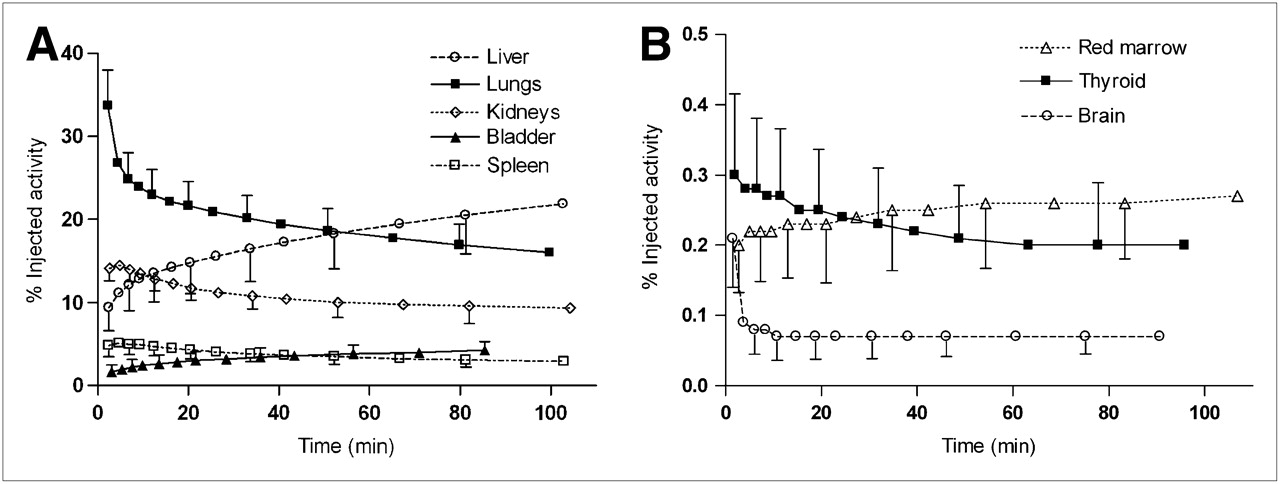
- FIGURE 7.
Uptake of radioactivity in organs that could be visually identified on planar whole-body images. Activity of organ is expressed as percentage of injected activity. Data are mean ± SD in 8 subjects.


Tables
Source organ Residence time (h) Thyroid 0.001 ± 0.000 Brain 0.002 ± 0.001 Lungs 0.102 ± 0.014 Liver 0.068 ± 0.017 Urinary bladder 0.013 ± 0.005 Spleen 0.019 ± 0.005 Kidneys 0.055 ± 0.007 Red marrow 0.009 ± 0.003 Remainder in body 0.220 ± 0.007 Data are mean ± SD.
Target organ doses μSv/MBq mrem/mCi Adrenals 4.2 ± 0.1 15.4 ± 0.4 Brain 0.8 ± 0.2 2.9 ± 0.7 Breasts 2.0 ± 0.1 7.5 ± 0.2 Gallbladder wall 3.8 ± 0.3 14.1 ± 1.1 LLI wall 1.9 ± 0.1 7.2 ± 0.4 Small intestine 2.3 ± 0.1 8.5 ± 0.2 Stomach 2.8 ± 0.1 10.3 ± 0.3 ULI wall 2.3 ± 0.1 8.7 ± 0.3 Heart wall 3.2 ± 0.1 11.8 ± 0.3 Kidneys 50.1 ± 6.0 184.9 ± 22 Liver 12.9 ± 2.7 47.9 ± 10 Lungs 27.0 ± 3.4 99.8 ± 13 Muscle 2.0 ± 0.0 7.3 ± 0.1 Ovaries 2.0 ± 0.1 7.5 ± 0.4 Pancreas 4.0 ± 0.2 14.9 ± 0.6 Red marrow 2.9 ± 0.3 10.9 ± 1.1 Osteogenic cells 3.0 ± 0.2 11.2 ± 0.7 Skin 1.4 ± 0.0 5.3 ± 0.1 Spleen 30.5 ± 6.8 112.7 ± 25 Testes 1.5 ± 0.1 5.5 ± 0.3 Thymus 2.3 ± 0.1 8.6 ± 0.3 Thyroid 14.7 ± 6.2 54.5 ± 23 Urinary bladder wall 10.8 ± 3.3 39.8 ± 12 Uterus 2.2 ± 0.2 8.3 ± 0.7 Total body 2.9 ± 0.0 10.8 ± 0.1 Effective dose 7.8 ± 0.6 28.7 ± 2.2 LLI = lower large intestine; ULI = upper large intestine.
Data are mean ± SD.
Supplemental Data
Files in this Data Supplement:
In this issue


Jump to section
Related Articles
Cited By...
- Modulation of P-glycoprotein at the Human Blood-Brain Barrier by Quinidine or Rifampin Treatment: A Positron Emission Tomography Imaging Study
- Quantification of Dynamic 11C-Phenytoin PET Studies
- Increased Permeability-Glycoprotein Inhibition at the Human Blood-Brain Barrier Can Be Safely Achieved by Performing PET During Peak Plasma Concentrations of Tariquidar
- Increased In Vivo Expression of an Inflammatory Marker in Temporal Lobe Epilepsy
- A Novel Positron Emission Tomography Imaging Protocol Identifies Seizure-Induced Regional Overactivity of P-Glycoprotein at the Blood-Brain Barrier
- P-Glycoprotein Function at the Blood-Brain Barrier in Humans Can Be Quantified with the Substrate Radiotracer 11C-N-Desmethyl-Loperamide