


Abstract
Cerebral amyloid angiopathy (CAA) is known to be an important cause of spontaneous cortical–subcortical intracranial hemorrhage in normotensive older persons. CAA can also manifest as leukoencephalopathy, brain atrophy, and ischemia secondary to hypoperfusion. Our goal was to verify cerebral hypoperfusion in patients with CAA using 99mTc-ethylcysteinate dimer (99mTc-ECD) brain perfusion SPECT. Methods: A total of 11 patients (5 men and 6 women; age range, 58–78 y; mean age ± SD, 70.0 ± 7.0 y) with clinically and radiologically established probable CAA who underwent 99mTc-ECD SPECT were included. 99mTc-ECD SPECT scans were also obtained from 13 age-matched healthy control subjects (7 men and 6 women; age range, 60–79 y; mean age ± SD, 66.7 ± 6.4 y) for comparison. The relative regional cerebral blood flow values obtained for patients and controls were compared using software. Results: Compared with controls, patients with probable CAA showed hypoperfusion in the inferior parietal lobule of both parietal lobes (Brodmann area [BA] 40), middle temporal gyrus of the left temporal lobe (BA 39), postcentral gyrus of the right parietal lobe, superior temporal gyrus of the right temporal lobe (BA 22), superior temporal gyrus of the right frontal lobe (BA 10), inferior temporal gyrus of the left temporal lobe (BA 20), and both caudate bodies (P < 0.0001, t = 4.65). Conclusion: Patients with probable CAA had significantly decreased cerebral perfusion and may be at risk for leukoencephalopathy, atrophy, and ischemia.
Cerebral amyloid angiopathy (CAA), also known as congophilic angiopathy or cerebrovascular amyloidosis, is characterized by amyloid deposition in the walls of small vessels in the cerebral cortex and leptomeninges in the aging brain, in the absence of systemic amyloidosis (1–4). CAA is a focal, patchy, often asymmetric process that most likely involves the parietooccipital cortex and spares the hippocampi, basal ganglia, and brain stem, even when severe involvement is evident elsewhere (3,5).
CAA has been implicated as an important microvascular cause of primary nontraumatic spontaneous cortical–subcortical intracranial hemorrhage in normotensive older persons (2,3). In addition to intracranial hemorrhage, CAA can manifest as leukoencephalopathy, brain atrophy, and ischemia. Hypoperfusion resulting from vessel wall deposition of β-amyloid may be responsible for these manifestations (6–8).
Few studies have been conducted using brain perfusion SPECT in patients with CAA. Shih et al. obtained 99mTc-HMAPO images from a 71-y-old man with CAA and reported heterogeneous uptake of the radiotracer. These findings may reflect multiple foci of decreased perfusion that occurs from stenosis or occlusion of small- and medium-sized cerebral arteries (9,10). Haan et al. suggested the usefulness of SPECT based on the finding that hypodense lesions observed on CT scans were consistent in part with perfusion defects detected on SPECT (4,11). However, these past studies conducted only visual analysis, and both quantitative and qualitative analyses were unavailable. To verify the pathologic effect of CAA on cerebral perfusion, we performed 99mTc-ethylcysteinate dimer (99mTc-ECD) brain perfusion SPECT in patients with probable CAA and attempted to objectively examine the findings using a voxel-based analysis.
MATERIALS AND METHODS
The features of 11 patients (5 men and 6 women; age range, 58–78 y; mean age ± SD, 70.0 ± 7.0) clinically and radiologically diagnosed as probable CAA are presented in Table 1. The inclusion criteria for diagnosis of probable CAA were as follows: more than 10 petechial microbleed or hemosiderin deposition foci with a cortical–subcortical distribution sparing the deep cortical nuclei such as the basal ganglia and thalami, based on the gradient-recalled echo (GRE) sequence of brain MRI; patient age of 55 y or older; and no other clinical or radiologic cause of hemorrhage.
Patient Characteristics
MRI was performed in patients included in this study for further evaluation of neurologic symptoms such headache, changes in visual acuity or visual field, motor weakness, sensory loss, seizure, or memory impairment. These patients were diagnosed with various disorders such as lacunar infarction, seizure disorder, and vascular dementia in addition to CAA.
Patients with conditions that could affect cerebral perfusion SPECT images, such as acute onset stroke symptoms within 3 mo, stenosis greater than 50% in large vessels such as middle cerebral artery or anterior cerebral artery, and history of traumatic brain injury, were excluded.
Hypointense lesions on the T2*-weighted GRE images were scored by counting the lesions that were considered to be abnormal. Abnormal lesions were defined as a small (<10 mm in diameter) hypointense signal with a well-defined margin on the T2*-weighted GRE images. Patients with macrolobar hemorrhage (≥10 mm in diameter) were excluded to rule out the effect of macrohemorrhage on perfusion brain SPECT images. The interval between brain MRI and 99mTc-ECD SPECT was less than 1 mo in each patient.
99mTc-ECD SPECT scans were also obtained from 13 age-matched healthy volunteers (7 men and 6 women; age range, 60–79 y; mean age ± SD, 66.7 ± 6.4 y) selected as the controls after exclusion of all 29 illnesses that Christensen et al. (12) had proposed to be possibly associated with cognitive impairment. There were no microbleeds, lacunes, or moderate-to-severe white matter lesions on the MR images of the healthy controls.
Informed consent for a retrospective study of image findings was waved by the institutional review board of our institution.
MRI
MRI was performed using a 1.5-T superconducting magnet system (Signa Excite; GE Healthcare). GRE sequences were obtained in the axial plane with the following parameters: repetition time/echo time, 700 ms/20 ms; flip angle, 25°; slice thickness, 6 mm; number of slices, 20; field of view, 220 × 220 mm; matrix size, 288 × 256; number of excitations, 1; and acquisition time, 3 min 3 s. Microbleeds or hemosiderin depositions were defined as small foci of signal loss in the GRE MRI, and the lesions were counted. Images were analyzed independently by 2 experienced neuroradiologists, and consensus was reached for discordant findings.
SPECT
The scans obtained for patients and controls were interleaved in time. Images were obtained 40 min after intravenous injection of 1,110 MBq of 99mTc-ECD using a dual-head γ-camera (ECAM plus; Siemens Medical) equipped with a low-energy, fanbeam collimator. Subjects were supine with their eyes open during the scan. The room was dimly lit, and noise was kept to a minimum. The data obtained were reconstructed in a 128 × 128 matrix with a pixel size of 3.9 × 3.9 × 3.9 mm (field of view, 240 mm; slices thickness, 7 mm) and a 20% symmetric energy window at 140 keV. Continuous transaxial tomograms of the brain were reconstructed after backprojection with a Butterworth filter (cutoff frequency of 0.4 cycles/pixel, order 5) to reduce noise. 99mTc-ECD images were corrected for tissue attenuation using a standard commercial correction routine (Siemens).
Group Analysis of Probable CAA, Compared with Controls
Images were analyzed on an IBM personal computer with a Windows XP operating system (Microsoft). SPM2 software (Wellcome Department of Cognitive Neurology, University College of London) based on MATLAB, version 6.0 (The MathWorks), was used for image analysis. The SPECT data with attenuation and scatter correction were converted into ANALYZE format. The mean pixel intensity across all slices of the imaging volume was calculated. Each pixel was then thresholded at 80% of this value to eliminate background noise and partial-volume effects at the edge of the brain. Each SPECT scan was then spatially normalized by 12-parameter affine warping and sinc-linear interpolation to the SPECT template brain from the Montreal Neurologic Institute and reformatted to a 16-bit image of 79 × 95 × 68 voxels, each 2 × 2 × 2 mm. These images were spatially smoothed with a gaussian filter of 16 mm in full width, used at a half maximum value. Normalized regional cerebral blood flow (CBF) values were calculated by dividing the CBF at each voxel by the global CBF obtained for each individual.
The normalized SPECT data acquired for the CAA group were compared with data from the 13 healthy subjects. Group contrasts in regional CBF were estimated at each voxel using the General Linear Model in the SPM2 software. A 2-sample t test model was fitted, and a t statistic image was constructed. The t statistic image was thresholded at t greater than 4.65, corresponding to an uncorrected P value of less than 0.0001 in conjunction with a cluster filter of 100 voxels. This combined application of a statistical threshold and cluster filter has previously been shown to substantially reduce the false-positive identification of activated pixels at any given threshold. For purposes of visualization and anatomic localization, the t score clusters were projected onto the standard high-resolution T1-weighted MR images.
In exploratory analyses, we assessed the correlation of regional CBF for regions that differed significantly across groups. A statistical probabilistic anatomic map (SPAM) of the International Consortium for Brain Mapping was applied to objectively draw voxels of interest (VOIs) (13). A SPAM consists of 98 VOIs in a single image, in which each voxel has the probability of belonging to a specific VOI. After spatial normalization, the counts of each SPECT image were normalized using proportional scaling, with the mean counts of the cerebellum set at 50. The normalized counts were multiplied by the probability of the SPAM and were determined as the count of each VOI. The cerebral lobar counts were then calculated by averaging the counts of the VOIs that had been reclassified into each lobe. In SPAM data, the Mann–Whitney test was performed to compare CAA and control groups. A value of P less than 0.01 was considered significant.
Comparison Between SPECT and MRI in Individual CAA Patients
For each CAA patient, the number of microbleed hypointense signal intensities on MRI and perfusion represented by the regional CBF value on 99mTc-ECD SPECT were compared using Spearman correlation. In addition, 2 experienced neuroradiologists reviewed SPECT and MR images to see if the hypoperfusion area on SPECT corresponded to the increased signal on brain MR GRE images.
RESULTS
Among the total of 11 patients, 2 patients demonstrated diffuse or focal T2 hyperintense signal intensities along the subcortical white matter (Fig. 1A). The GRE sequences of these patients showed multiple small, nodular, dark signal intensities with cortical–subcortical distribution rather than central deep cortical nuclei and thalami (Fig. 1B). Areas corresponding to T2 hyperintense signals on brain perfusion SPECT revealed decreased perfusion (Fig. 1C).
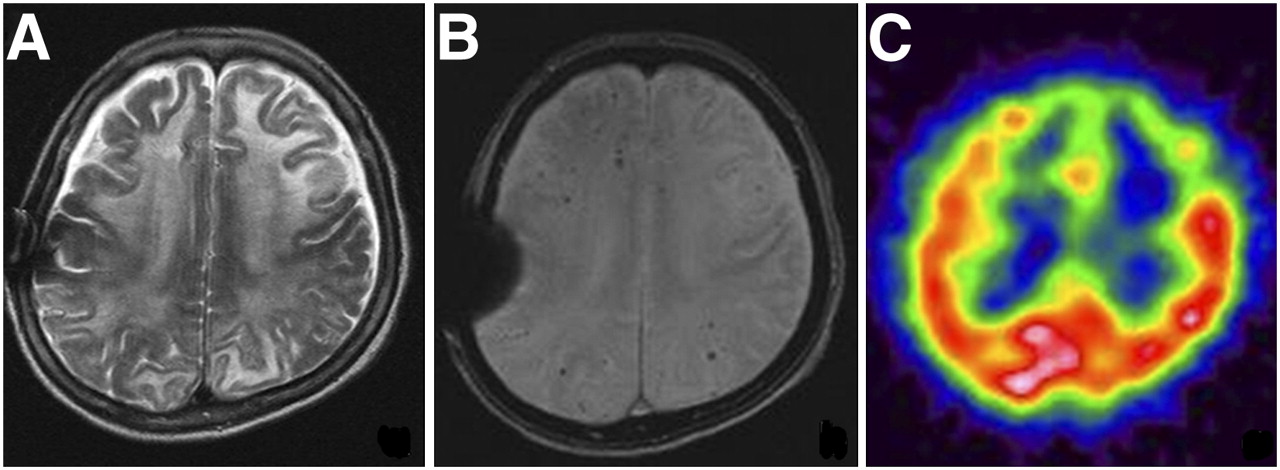
A 68-y-old woman with progressive cognitive decline. (A) Diffuse high signal intensities are noted along subcortical white matter of bilateral frontoparietal lobes on T2-weighted images. (B) GRE sequence revealed multiple petechic hypointense signal intensities along with cortical–subcortical distribution. Focal susceptibility artifact is shown at location of right parietal skull due to previous surgery. (C) Focal perfusion defects are demonstrated in anterior portions of both frontal lobes using 99mTc-ECD SPECT.
The remaining 9 patients exhibited multiple dark signal intensities with cortical–subcortical distribution on GRE images without any T2 hyperintense signals or macrohemorrhage.
Compared with healthy age-matched controls, the patients with probable CAA showed multiple areas with significantly decreased cerebral perfusion (P < 0.001, t = 4.65). The hypoperfusion areas were the inferior parietal lobule of both parietal lobes (Brodmann area [BA] 40), middle temporal gyrus of left temporal lobe (BA 39), postcentral gyrus of right parietal lobe, superior temporal gyrus of right temporal lobe (BA 22), superior temporal gyrus of right frontal lobe (BA 10), inferior temporal gyrus of left temporal lobe (BA 20), and both caudate bodies (Fig. 2; Table 2).
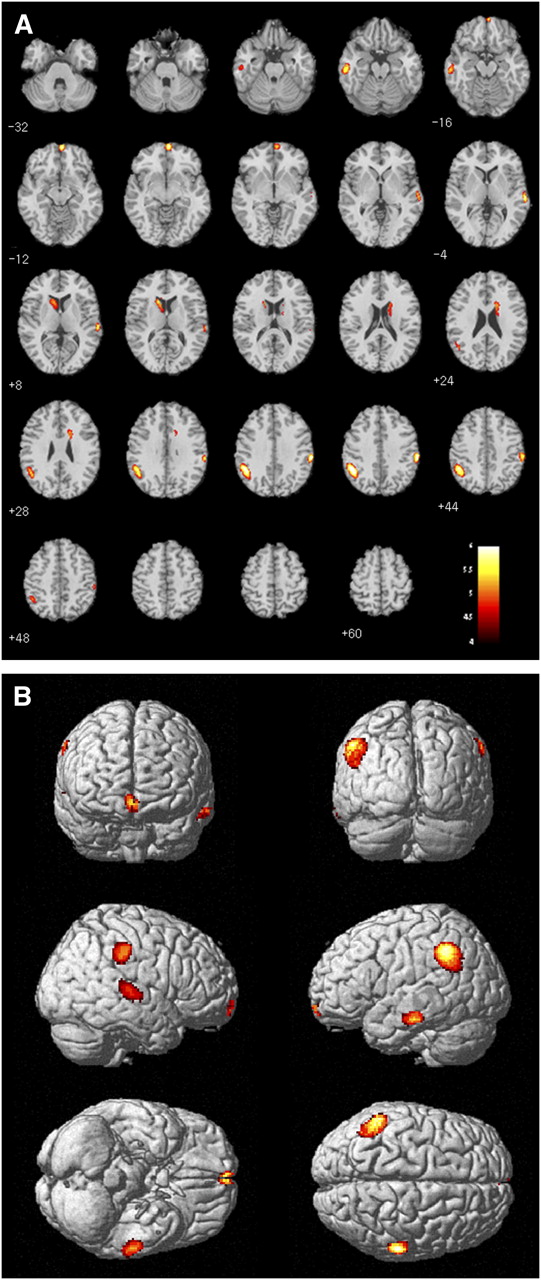
Results from group comparisons of patients with CAA and healthy controls: areas with decreased regional CBF. (A) Transaxial MR fused images. (B) Three-dimensional-rendered images.
Areas with Significantly Decreased Regional CBF in CAA Patients, Compared with Controls
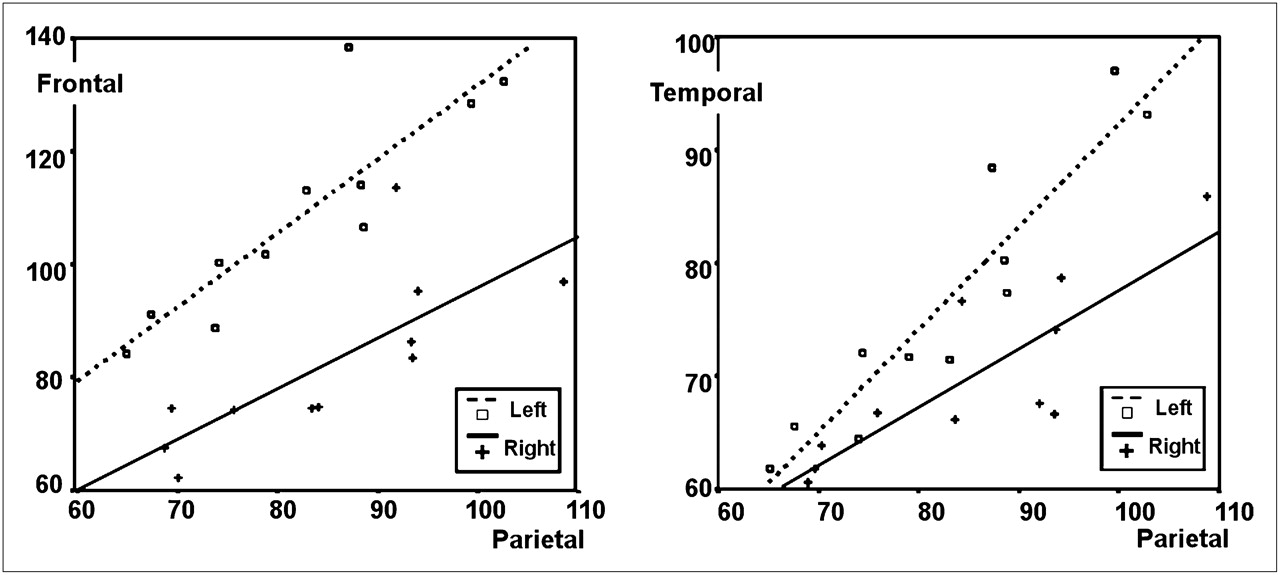
Furthermore, normalized regional CBF was strongly intercorrelated across all regions in which disproportionate hypoperfusion was identified, including between temporal and parietal regions (r = 0.90, P < 0.01) and between frontal and parietal regions (r = 0.83, P < 0.01) (Fig. 3).

Correlation of regional blood flow between parietal and frontal cortices and between parietal and temporal cortices. Numbers of counts per voxel by SPAM are compared between bilateral frontal and parietal cortices and between bilateral temporal and parietal cortices and plotted separately. Both scatter plots demonstrate positive correlation (frontal and parietal regions, r = 0.83; temporal and parietal regions, r = 0.90).
The number of microbleeds on MRI and regional CBF value on SPECT showed no correlation. In contrast, the region of hypoperfusion corresponded to the microbleed region in 3 patients (patients 2, 5, and 11, Table 1).
DISCUSSION
CAA occurs after the deposition of eosinophilic material and amyloid protein in the cortical, subcortical, and leptomeningeal vessels. These depositions present with a broad spectrum of clinical symptoms and neuroimaging findings. Most patients with CAA are asymptomatic, but symptomatic patients can present findings such as transient neurologic events, progressive cognitive decline, or potentially devastating intracranial hemorrhage (1,10).
Among various manifestations, primary lobar intracerebral hemorrhages represent the clinical and radiologic findings that are well established in patients with CAA. In particular, chronic cortical–subcortical microbleed can be revealed by the GRE sequence, which is a useful sequence for detecting the hemosiderin shown to accumulate in the brain (1,2). Better detection of microbleeds was recently reported with a susceptibility-weighted image that maximizes the susceptibility effect (14,15). The susceptibility-weighted image adds a phase image, which represents phase shift, to the gradient-echo image and is reported to have a higher sensitivity for hemorrhage products. At our institution, a susceptibility-weighted image was not available when this study was performed; thus, gradient-echo images were used instead for the evaluation of microbleeds.
The histopathologic changes of cerebrovascular structures in CAA are well characterized. The amyloid deposition infiltrates the entire wall of large leptomeningeal arteries and superficial cortex arteries in both a uniform and a diffuse manner. Superimposed fibrinoid degeneration is observed in the affected vessels, often causing microaneurysmal dilation of the vascular wall, sometimes concomitant with luminal stenosis (4). The presence of microaneurysm can induce massive intraparenchymal hemorrhages in patients with CAA, and the presence of luminal stenosis can reflect hypoxic–ischemic changes. Although the most common presentation of CAA is spontaneous cerebral hemorrhage, a few reports of cases of nonhemorrhagic leukoencephalopathy as a result of hypoxic–ischemic changes in vessel stenosis have been published (6,16–20).
Niwa et al. reported a profound defect in the CBF response to functional activation by somatosensory stimuli and produced a mismatch between substrate delivery and energy demands imposed by neural activity in a study using transgenic mice overexpressing amyloid precursor protein (21). In addition, by topical superfusion of exogenous Aβ1-40 to the neocortex, an increase in the CBF through endothelium-dependent vasodilation was observed using a laser Doppler flowmeter. Vasodilation lacking communication with the endothelium did not increase the CBF (22).
Smith et al. confirmed diminished vascular reactivity to visual stimulation in 11 CAA patients, compared with the controls, using transcranial Doppler ultrasound and showed that the occipital cortex is affected by the disease (23). A change in the resistance of the distal vessels was suggested as the pathologic mechanism.
Gray et al. (17) assessed the histopathology findings of 12 patients with leukoencephalopathy that occurred in areas not associated with intracerebral hemorrhage. The white matter with leukoencephalopathy demonstrated pathologic changes of demyelination with microscopic changes associated with spongiosis, swollen oligodendroglia, widening of the perivascular spaces with edema, hyalinization of the blood vessel walls, myelin loss with partial axonal degeneration, and gliosis. Surprisingly, vessel walls with amyloid deposition were not observed in the white matter leukoencephalopathy. On the basis of these findings, Gray et al. postulated that the amyloid deposits in the meningocortical vessels caused hypoperfusion in the deep white matter, inducing subsequent ischemic demyelination (17).
In our 2 patients with confluent or localized T2 hyperintense signals in the subcortical white matter, decreased cerebral perfusion of the corresponding areas was noted in the brain perfusion SPECT. These findings suggest that hypoperfusion or ischemia can develop in patients with CAA, and white matter T2 hyperintense leukoencephalopathy in patients with CAA may be induced from cerebral hypoperfusion.
Caulo et al. (19) followed up a patient with CAA for more than 1 y; these authors observed disease progression but, at the same time, regression of the abnormalities present in other regions of the brain. They postulated the possibility of the coexistence of 2 different pathologic changes: myelin loss and astrocytic gliosis with stability over time and versatile vasogenic edema. These double conditions support the hypoxic theory, justifying the lack of correlation of the signal intensity abnormality with hemorrhage in cases of CAA.
Inflammation of the vascular wall, angitis, and hypoperfusion producing high signal intensity on T2-weighted images of white matter could also be possible causes of the signal intensity abnormality (18,20). In some subsets of patients with CAA, a specific form of perivascular inflammation known as the immune response to Aβ deposition in the vascular wall has been reported. Asymmetric T2 hyperintense lesions extending to the subcortical U fibers with an edematous appearance represent major imaging findings (10,16).
However, in our study definite hypoperfusion was observed in brain perfusion SPECT in the same sites as T2 high signal intensities in 2 patients with diffuse leukoencephalopathy. These findings were contradictory to inflammation, which is typically shown as increased perfusion on brain perfusion SPECT. Thus, one could postulate that the leukoencephalopathy observed in both patients occurred as a result of hypoperfusion due to vessel narrowing.
Although many investigators have suggested the possibility of hypoperfusion of the distal white matter resulting from vascular disease as a cause of the pathologic results described above, hypoperfusion and ischemia in patients with CAA have not been scientifically documented. This study demonstrated that cerebral perfusion decreased significantly in patients with diffuse CAA, compared with age-matched controls. These findings may be informative in predicting the risk of leukoencephalopathy, atrophy, and ischemia resulting from cerebral hypoperfusion in patients with CAA.
The criteria we used to select patients with diffuse CAA were more than 10 petechial hemorrhagic or hemosiderin deposition foci on the GRE sequence of the brain MRI with a cortical–subcortical distribution but no involvement of the deep cortical nuclei such as the basal ganglia and thalami. In most cases, the causative factors for the occurrence of cerebral microbleed were CAA or chronic hypertensive cerebral angiopathy. Therefore, attempts were made to rule out cases of chronic hypertensive cerebral angiopathy, which can develop more frequently in areas prone to hypertensive intracerebral hematoma in the central portion of the brain such as the thalami, basal ganglia, cerebellum, and pons. Therefore, we added cortical–subcortical distribution, the prevalent site of CAA involvement (5,24), to the inclusion criteria.
Tsushima et al. (25) reported that the number of T2* hypointense signals that can appear in most healthy individuals does not exceed 9. On the basis of their study, we regarded a brain with more than 9 hypointense signals as pathologic and included it in our study.
From the SPECT of CAA patients included in our study, we were able to observe multifocal hypoperfusion in both cerebral cortical regions, which corresponded well with the report by Shih et al. (9). Decreased regional CBF in both basal ganglia was reported many times but confirmed for the first time through SPECT in this study. Decreased regional CBF in the thalamus, cerebellum, and pons had been observed previously, and we were also able to observe a decline in regional CBF on SPECT. We supposed that the heterogeneous multifocal hypoperfusion was due to the differences in the patient's age or the extent of the patient's disease state. Further research will be necessary.
The number of microbleeds on MRI and regional CBF value on SPECT did not have meaningful correlation, and the region of hypoperfusion and microbleeds on MRI were matched in only 3 patients. These discrepancies are probably due to different pathogeneses of hypoperfusion and microbleed that can occur in CAA patients. Though amyloid protein deposition in the endothelium is a common factor, there is underlying disparity in that a microbleed is characterized by the weakening and rupture of the vessel, whereas hypoperfusion results from vascular stenosis. Therefore, though the MRI and perfusion SPECT findings of the CAA patient group and age-matched control group were different, no correlation need exist between the severity of hypoperfusion due to vessel stenosis and number of microbleeds due to vessel rupture within the CAA patient group. In addition, because of the small number of CAA patients included in this study, the number of microbleeds varied greatly from 10 to 336, and the marked heterogeneity could also have contributed to the lack of correlation.
Some patients had a Mini-Mental State Examination score equal to or less than 20, and the possibility of dementia was suggested. However, previous reports have proposed dementia to be present in 20%−40% of the CAA patients, so we did not deem it necessary to exclude patients with impaired cognitive function from this study. In other reports, Alzheimer disease was seen in more than 40% of CAA patients with dementia (1,26,27). In addition, CAA was observed in up to 90% of Alzheimer disease patients. According to histologic findings, Alzheimer disease, which is responsible for most dementia, frequently accompanies CAA. A typical SPECT finding for Alzheimer disease is decreased regional CBF to temporal and parietal cortices, and usually the temporal cortex changes are observed first. Our CAA group analysis demonstrated posterior hypoperfusion, but frontal and caudate hypoperfusion was also seen. In other words, findings of Alzheimer disease and vascular dementia can both be considered present. And the SPECT images of the individual patients did not demonstrate findings typical of Alzheimer disease. Thus, though the posterior hypoperfusion could have resulted from Alzheimer disease, CAA with dementia seems the more likely explanation.
CONCLUSION
On the basis of our 99mTc-ECD SPECT results, which are in agreement with previously published data, we verified that hypoxic–ischemic changes can develop in the CAA patient's brain.
Acknowledgments
We acknowledge the financial support of the Korea Institute of Medicine, made in the program year of 2008.
Footnotes
-
COPYRIGHT © 2009 by the Society of Nuclear Medicine, Inc.
References
- Received for publication February 13, 2009.
- Accepted for publication August 17, 2009.


Jump to section
Related Articles
Cited By...
- Loss of spontaneous vasomotion precedes impaired cerebrovascular reactivity and microbleeds in a mouse model of cerebral amyloid angiopathy
- Atrophy patterns in cerebral amyloid angiopathy with and without cortical superficial siderosis
- Chronic cerebral hypoperfusion: a key mechanism leading to vascular cognitive impairment and dementia. Closing the translational gap between rodent models and human vascular cognitive impairment and dementia