


Abstract
PET allows for quantitative, regional myocardial perfusion imaging. The short half-lives of the perfusion tracers currently in use limit their clinical applicability. Here, the biodistribution and imaging quality of a new 18F-labeled myocardial perfusion agent (18F-BMS-747158-02) in an animal model are described. Methods: The biodistribution of 18F-BMS-747158-02 was determined at 10 and 60 min after injection. The first-pass extraction fraction of the tracer was measured in isolated rat hearts perfused with the Langendorff method. Small-animal PET imaging was used to study tracer retention. Results: The biodistribution at 10 min after injection demonstrated high myocardial uptake (3.1 percentage injected dose per gram [%ID/g]) accompanied by little activity in the lungs (0.3 %ID/g) and liver (1.0 %ID/g). The tracer showed a high and flow-independent myocardial first-pass extraction fraction, averaging 0.94 (SD = 0.04). PET imaging provided excellent delineation of myocardial structures. The heart-to-lung activity ratio increased from 4.7 to 10.2 between 1 and 15 min after tracer injection (at rest). Adenosine infusion (140 μg/kg/min) led to a significant increase in myocardial tracer retention (from 1.68 [SD = 0.23]) s−1 to 3.21 [SD = 0.92] s−1; P = 0.03). Conclusion: The observation of a high and flow-independent first-pass extraction fraction promises linearity between tracer uptake and myocardial blood flow. Sustained myocardial tracer uptake, combined with high image contrast, will allow for imaging protocols with tracer injection at peak exercise followed by delayed imaging. Thus, 18F-BMS-747158-02 is a promising new tracer for the quantitative imaging of myocardial perfusion and can be distributed to imaging laboratories without a cyclotron.
The assessment of myocardial blood flow during rest and stress conditions has become an important clinical tool for diagnosing coronary artery stenosis in patients with suspected ischemic heart disease (1,2). PET allows for the quantification of regional myocardial blood flow (3,4). Attenuation correction provides accurate delineation of regional tracer kinetics, which are used in combination with validated tracer kinetic models to quantify myocardial perfusion in mL/min/g of tissue (5,6). Recently, the combination of PET and CT offered the opportunity to develop a comprehensive cardiac examination including an assessment of coronary calcification, CT angiography, and quantitation of the myocardial perfusion reserve (7). Anatomic and functional information will provide a unique characterization of coronary artery disease (CAD), assessing the severity of stenosis and providing a prognosis with one imaging approach.
At present, several blood flow tracers are available for use with PET. The availability of these blood flow tracers depends on local production either by a cyclotron facility in close proximity or by a generator, as in the case of 82Rb. This limitation has restricted the application of PET flow measurements. Therefore, the need for an 18F-labeled flow tracer is well appreciated. Such a tracer can be distributed as a single-dose unit in a fashion similar to that of 18F-FDG or 99mTc-labeled flow tracers, widening the application of PET perfusion imaging.
Recently, the first 18F-labeled radiopharmaceutical for the assessment of myocardial perfusion was proposed (8), underscoring the interest in such a tracer. The purpose of the present study was to characterize a new 18F-radiolabeled PET perfusion tracer (18F-BMS-747158-02) in a rat model. 18F-BMS-747158-02 is a pyridazinone analog designed to target mitochondrial complex I of the electron transport chain with high affinity. Uptake into the heart is selective because of the high density of mitochondria in myocardial tissue. In addition to biodistribution, the in vivo pharmacokinetics in the rat myocardium as well as surrounding tissues were measured by dynamic small-animal PET imaging. Studies with perfused isolated rat hearts were used to determine the first-pass myocardial extraction fraction of this tracer at different flow rates.
MATERIALS AND METHODS
Animal Studies
All animal studies were performed with healthy mature male Wistar rats (275 [SD = 25] g; Charles River Laboratories, Inc.). Animals were used in only one experiment, and all experiments were performed in accordance with guidelines for the care and use of living animals in scientific studies and the German Law for the Protection of Animals.
Tracer Preparation
Dry cryptate ([K⊂2.2.2.]+18F−) was resolubilized with a solution of BMS-747155-01 in dry acetonitrile. The mixture was stirred at 90°C for 10 min. 18F-BMS-747158-02 was purified by preparative high-performance liquid chromatography. After dilution, the product fraction 18F-BMS-747158-02 was immobilized on a reversed-phase cartridge, washed, and eluted with ethanol. The solvent was removed under reduced pressure. Quality control was performed with an analytic high-performance liquid chromatography system. The entire synthesis was completed within 60 min. The overall radiochemical yield was 50%–60%, and the radiochemical purity was 99%. The value of log POct/PBS was 0.76 ± 0.01 (mean ± SD), indicating moderate lipophilicity.
Biodistribution Study
For the biodistribution study, 6.3–7.0 MBq of 18F-BMS-747158-02 in 150 μL of phosphate-buffered saline (pH 7.4) was injected into a lateral tail vein. The animals were anesthetized with isoflurane (Abbott GmbH & Co.; 1.5% by volume, 2.0 L of O2/min) during tracer injection. The animals were awake during the uptake period of 10 min (n = 3) or 60 min (n = 3), after which they were euthanized by carbon dioxide inhalation. The organs of interest were rapidly dissected and weighed. Organ activity levels were determined by well counting with the appropriate energy window and decay correction. Data were expressed as percentage injected dose per gram (%ID/g).
Perfused Isolated Rat Heart Study
Hearts were quickly excised from anesthetized rats (intraperitoneal sodium pentobarbital [0.25 mL]; Merial GmbH), placed in ice-chilled Krebs–Henseleit bicarbonate buffer (glucose at 10 mmol/L), and cannulated via the aorta. Krebs–Henseleit buffer, oxygenated with a mixture of 95% oxygen and 5% carbon dioxide, was used to perfuse the heart (without recirculation; n = 3, n = 4, and n = 4 for flow velocities of 5, 8.3, and 16.6 mL/min, respectively). The heart was stabilized for a period of 15 min, after which a bolus injection of ∼0.925 MBq of 18F-BMS-747158-02 (0.037 MBq/μl) was given. Whole-heart radioactivity was measured over 10 min with a pair of bismuth germanate detectors interfaced to coincidence detection circuitry. Care was taken to keep the counting rate within the linear response range of the system, to prevent dead-time–induced counting rate losses during tracer injection. The total coincidence counting rate was measured as a function of time and corrected for decay. The curve was analyzed by fitting an exponentially decaying function to the data representing the tissue washout component (from 100 s to 600 s). The fitted curve was extrapolated to the time of the maximum counting rate, and the value obtained was divided by the measured maximum counting rate. This ratio is a measure of the extraction fraction (Fig. 1; please note that for visibility, only data up to 100 s are shown, together with the extrapolated fitted curve). Because the curve was essentially linear in the fit region, possible differences between an exponential fit and a linear fit were studied. No differences were found for the determination of the extraction fraction (data not shown).
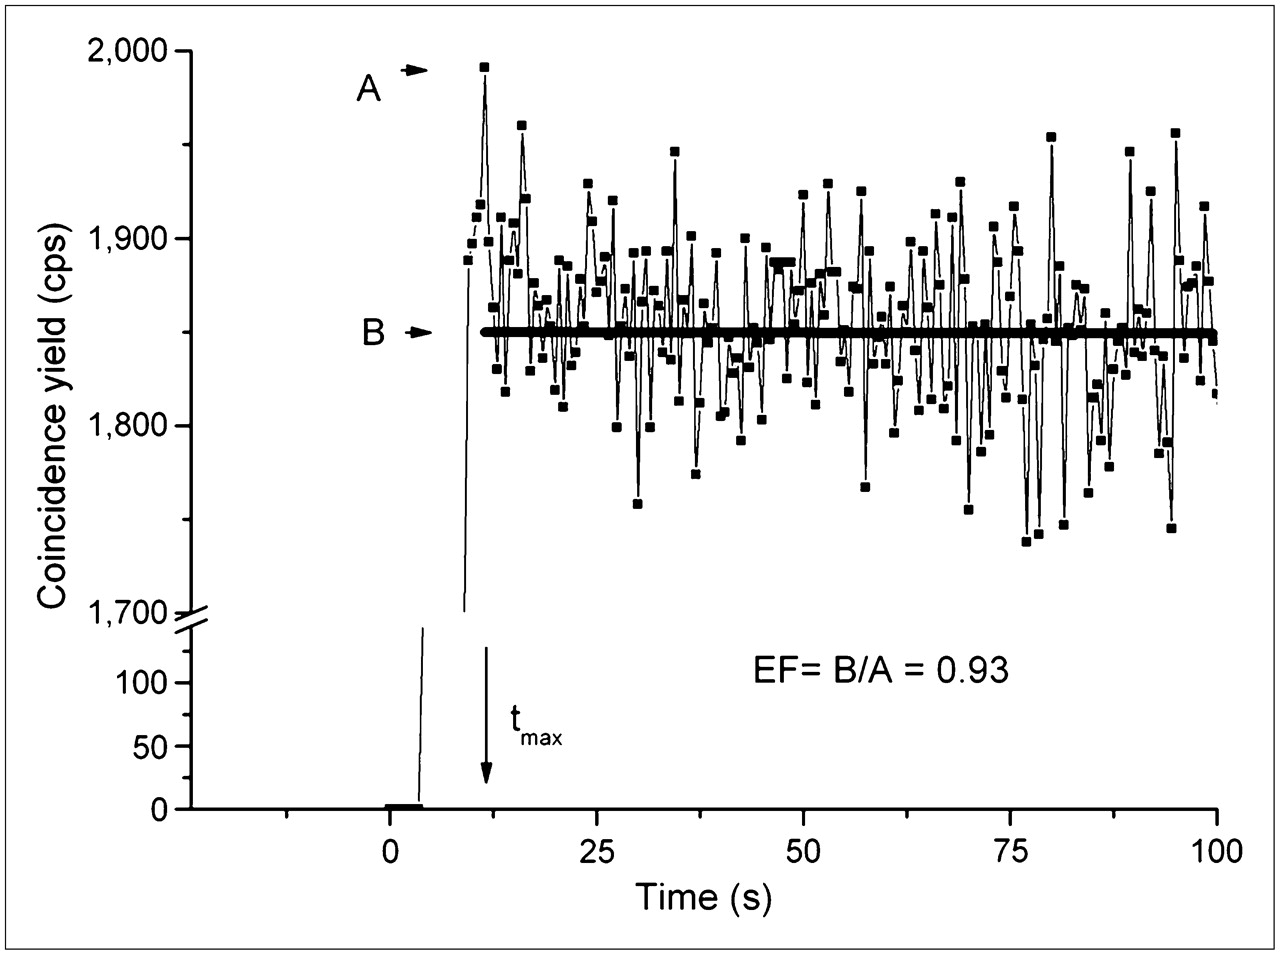
Data from first-pass extraction fraction (EF) measurements. Typical time–activity curve (for flow velocity of 8.3 mL/min) is shown, together with extrapolation of fit to tissue washout portion of curve (100 < t [s] < 600; fit itself is not shown). Extraction fraction is defined as ratio of measured (A) to extrapolated (B) values at time point at which measured curve reaches its maximum value (indicated by tmax).
Small-Animal PET Imaging
Rats were imaged in the prone position with a dedicated animal PET scanner (microPET Focus 120; Siemens Medical Solutions) (9,10). The animals were anesthetized by the intramuscular administration of a mixture of midazolam (0.1 mg/kg), fentanyl (1.0 μg/kg), and medetomidin (10.0 μg/kg). For injection of activity, a catheter was placed in a lateral tail vein. Data acquisition started before the intravenous injection of ∼37 MBq of 18F-BMS-747158-02 in 500 μL of phosphate-buffered saline (pH 7.4). To increase myocardial blood flow, we performed stress studies during the infusion of adenosine via a separate catheter placed in a different lateral tail vein (11). Adenosine (140 μg/kg/min; Sanofi-Synthelabo, GmbH) was infused over a period extending from 5 min before to 2 min after the start of the imaging procedure with an infusion pump. Measurements were obtained for 6 animals in the rest group and 6 animals in the stress group. Data were acquired in list mode format for 20 min, and histograms were used to produce a 29-frame sinogram (18 × 5 s, 7 × 30 s, 2 × 150 s, and 2 × 5 min). The sinogram was reconstructed into an image of 128 × 128 × 95 voxels by use of filtered backprojection with a ramp filter with a cutoff at the Nyquist frequency. The voxel size equaled 0.433 × 0.433 × 0.796 mm3, and the effective spatial resolution was less than 2.0 mm. Data were normalized and corrected for randoms, dead time, and decay.
Image Analysis
Image analysis was performed with the ASIPro software package (Siemens Medical Solutions) as well as with the Munich Heart software package (12). The latter software allows for image reorientation, enabling viewing of the heart along the short, vertical long, and horizontal long axes.
Regions of interest (ROIs) were manually defined in transaxial slices of the frame reconstructed from data measured between 15 and 20 min after injection. Blood-pool (left ventricular cavity) and myocardial ROIs were drawn on 3 contiguous slices near the basal plane of the heart. Lung and liver ROIs were drawn close to the heart. The mean activities in the ROIs (in arbitrary units, proportional to cps/mL) were plotted as a function of time (time–activity curves). These regional time–activity curves were used to determine uptake ratios for myocardium to liver, myocardium to blood, and myocardium to lung.
Tracer retention (1/s) was defined as the myocardial activity concentration divided by the integral under the input function. For calculation of tracer retention at 1 and 2 min after injection, the ROIs described earlier were used to define myocardial uptake. The time integral of the input function for 1 and 2 min was defined by fitting a γ-variate function to the measured input function. The homogeneity of myocardial tracer uptake was determined with the Munich Heart software. Polar map representations of uptake after 2 min were derived. The values in the polar map representation of the tracer indicated the percentage of mean tracer uptake in the ROI, normalized to the maximum myocardial uptake (expressed as a percentage of the maximum).
Statistical Methods
Values are reported as mean (SD). Statistical significance was tested with a standard t test.
RESULTS
Biodistribution Study
Table 1 shows the biodistribution (%ID/g) of 18F-BMS-747158-02. Uptake in the heart was approximately 3 times higher than that in the liver and 10 times higher than that in lung tissue. The route of excretion of the compound was primarily renal, consistent with the observed rapid decrease in activity in the kidneys.
Biodistribution of 18F-BMS-747158-02 in Male Wistar Rats
Perfused Isolated Rat Heart Study
Typical time–activity curves for all flow velocities are shown in Figure 2. The vascular component was very small in the time–activity curves, indicating high tracer extraction. Slow tracer washout was implied by the almost constant tissue activity during the acquisition time interval. A high and flow-independent extraction fraction was found (Table 2). The differences between the flow groups were not statistically significant (P ≥ 0.05).
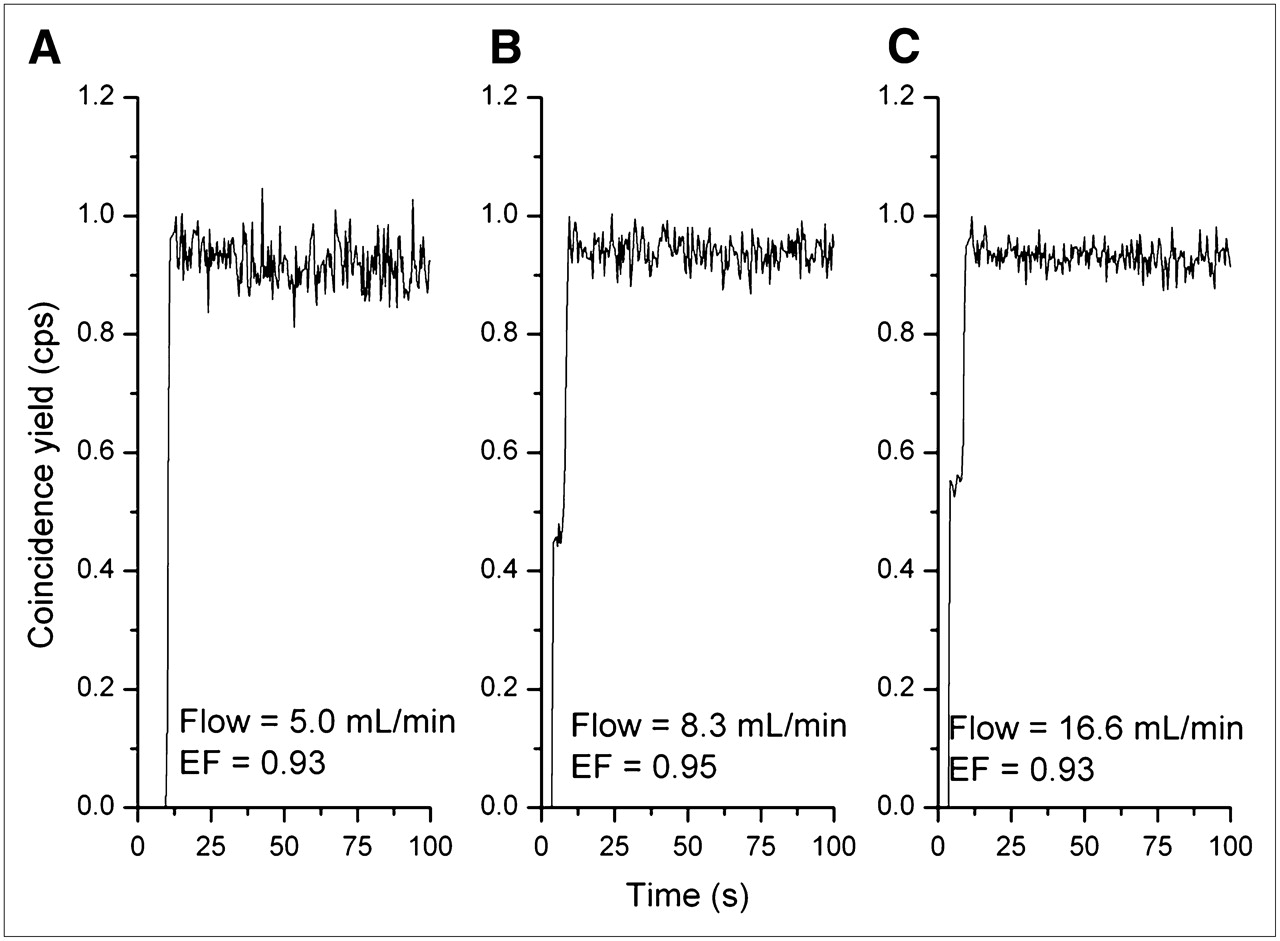
First-pass extraction fraction (EF) as function of blood flow. Smoothed time–activity curves obtained from sequential measurements of single rat heart are shown. Flow velocities and extraction fractions are indicated.
Average Extraction Fractions Measured with Langendorff Method
Small-Animal PET Study
One animal in the stress group moved during the scan. Therefore, the data pertaining to this animal were not useful. Thus, all data analysis was based on 6 animals in the rest group and 5 animals in the stress group.
Figure 3 shows an imaging example of the uptake of 18F-BMS-747158-02 in the myocardium at 15–20 min after injection. High contrast between the myocardium and blood, lungs, and liver was seen. Right ventricular activity was delineated, indicating high extraction and retention, as well as low nonspecific binding of the tracer.
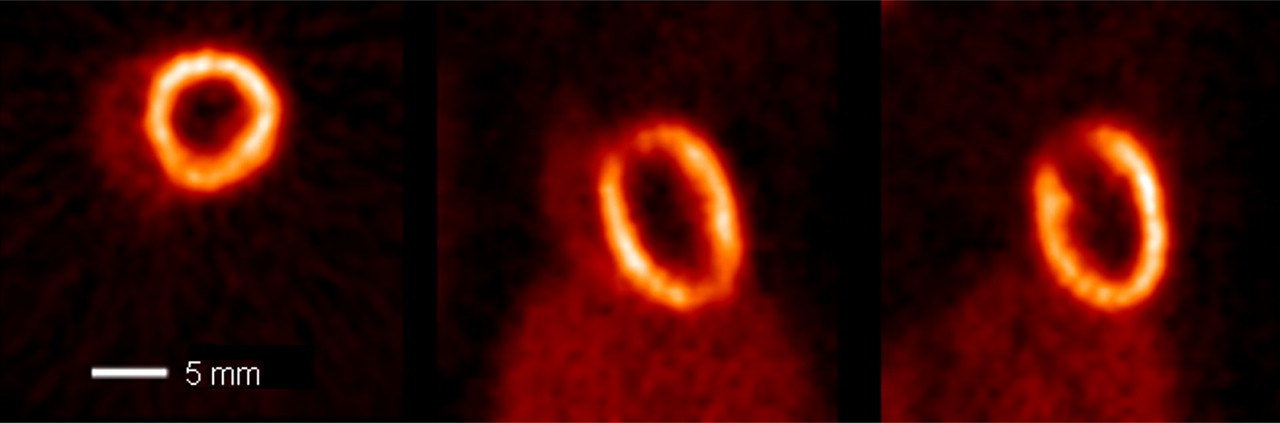
Late image (15–20 min after injection) of 18F-BMS-747158-02 uptake. Transaxial, coronal, and sagittal views are shown from left to right.
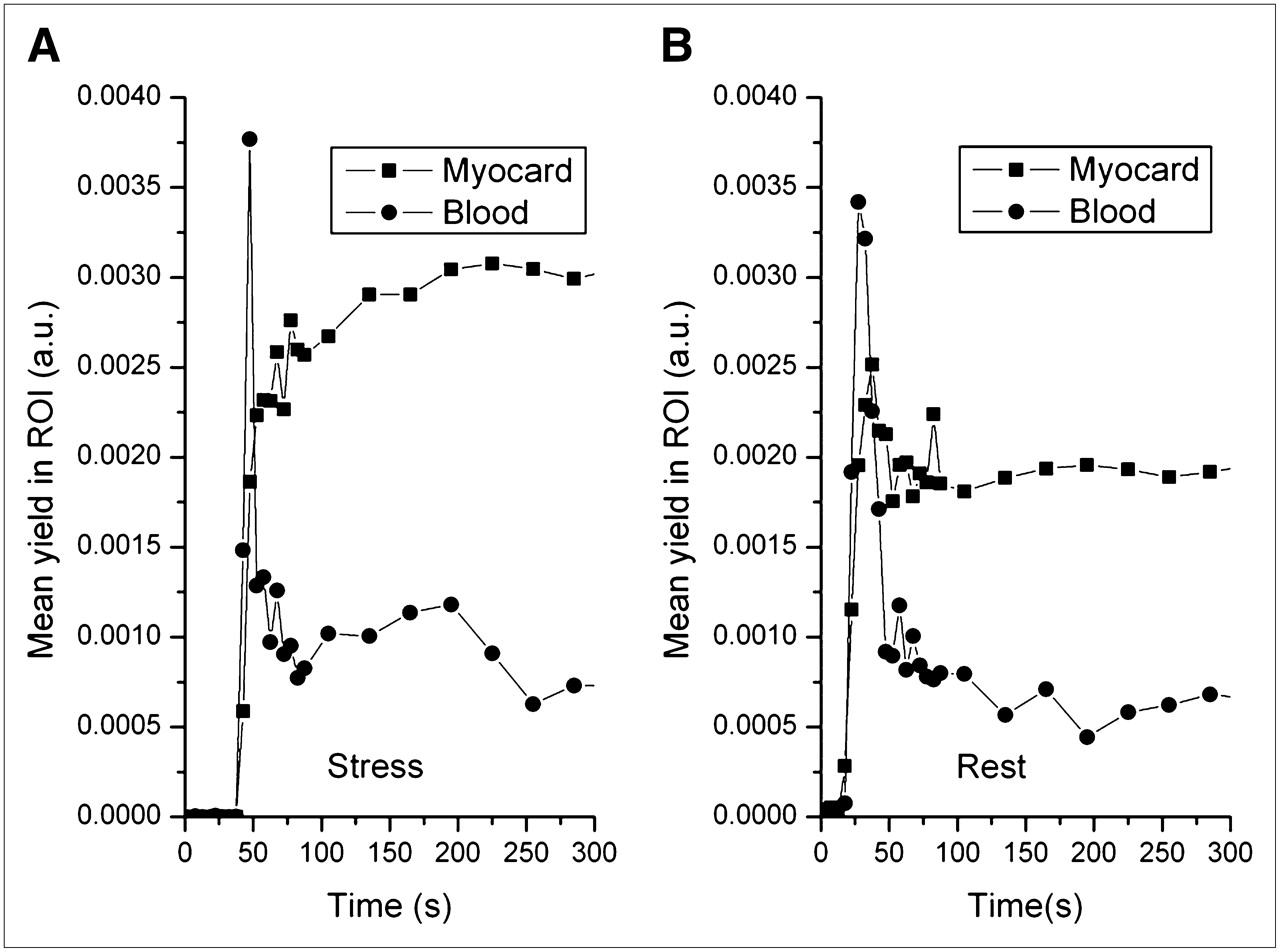
Figure 4 shows typical time–activity curves for the myocardium and the blood pool under rest and stress conditions, normalized to the same injected dose. The effect of adenosine infusion was clear.

PET-derived time–activity curves. (A) Time–activity curves for blood pool and myocardial (Myocard) tissue for animal in stress group. (B) Corresponding time–activity curves for animal in rest group, normalized to same injected dose. Vertical axes are in arbitrary units (a.u.), proportional to cps/mL.
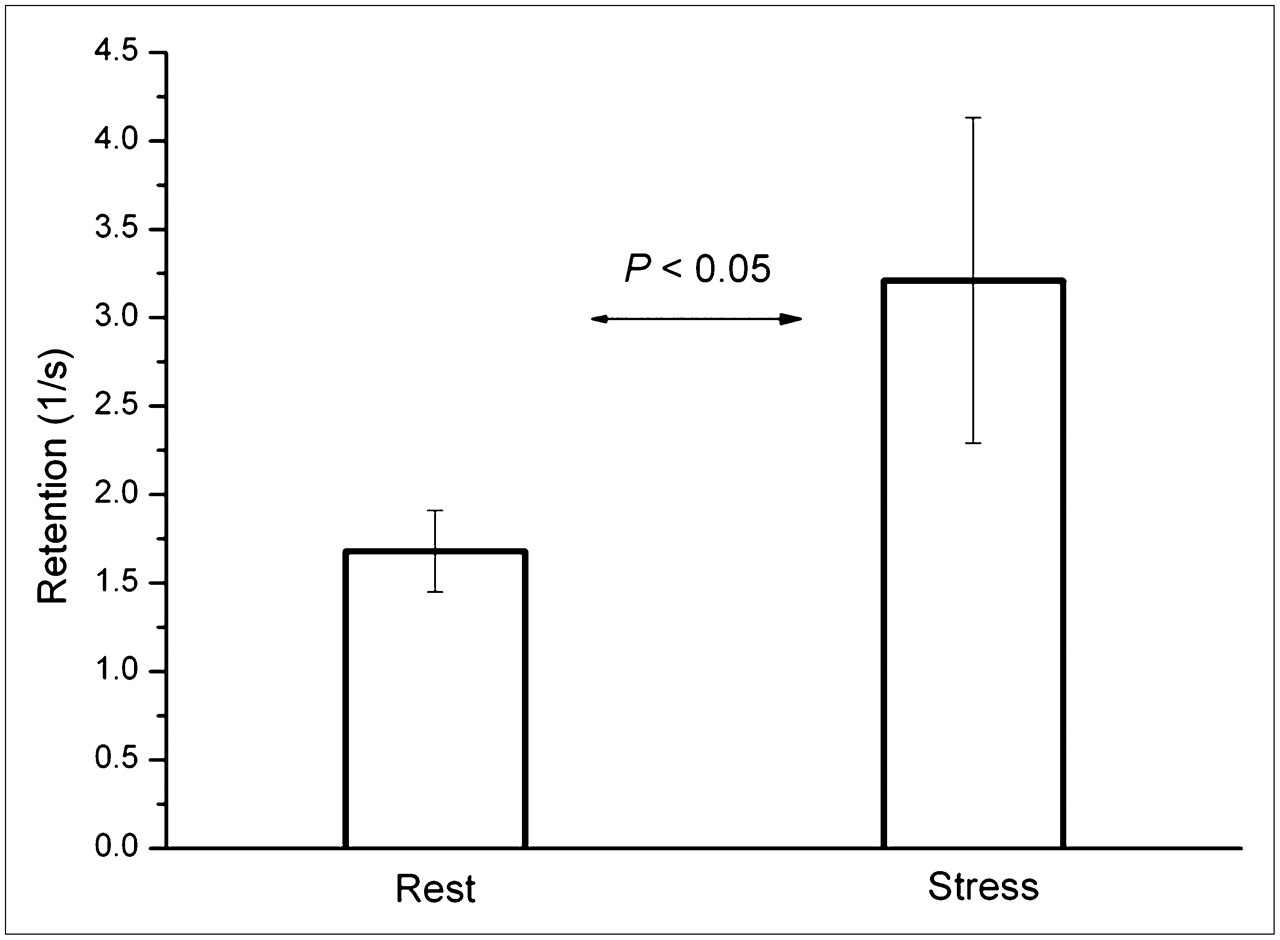
The uptake ratios derived from the time–activity curves for the myocardium, liver, blood, and lungs at 1, 2, 5, and 15 min after injection are shown in Table 3. The in vivo–derived heart-to-blood and heart-to-liver activity ratios did not change for the time points analyzed, whereas the heart-to-lung activity ratio increased (from 4.7 to 10.2 between 1 and 15 min at rest). During the 20 min of data acquisition, no significant washout of the tracer from the myocardium was observed. The retention values after 1 and 2 min were 1.77 (SD = 0.30) s−1 and 1.68 (SD = 0.23) s−1 for the rest group and 3.27 (SD = 0.74) s−1 and 3.21 (SD = 0.92) s−1 for the stress group, respectively (Fig. 5). The adenosine-induced increase in tracer retention was significant (P < 0.05). The ratios of stress to rest values averaged 1.85 and 1.91 at 1 and 2 min after injection, respectively.

Retention values at rest and stress. Retention values determined after 1 min under rest and stress conditions indicated significant increase in blood flow during adenosine infusion. Vertical lines indicate SDs.
In Vivo–Derived Uptake Ratios for 18F-BMS-747158-02 in Male Wistar Rats
The distribution of myocardial tracer uptake at 2 min after injection was determined for myocardial wall ROIs. For the rest and stress groups, the average means were 82.4% (SD = 6.3%) and 81.9% (SD = 5.3%), respectively. Table 4 shows the mean uptake values for different left ventricular segments.
Distribution of 18F-BMS-747158-02 Uptake at 120 Seconds After Injection
DISCUSSION
Several blood flow tracers are available for use with cardiac PET; they have been validated in animal models and clinical studies. The most physiologic tracer is 15O-water, because it diffuses freely across membranes, resulting in a flow-independent myocardial extraction fraction close to 1. However, 15O-water has a physical half-life of only 120 s, limiting its application to facilities with an on-site cyclotron. In addition, the rapid washin and washout kinetics of 15O-water imaging limit count statistics and compromise the regional evaluation of myocardial blood flow (6,13). Nevertheless, this tracer has gained acceptance in research laboratories for the quantification of myocardial blood flow and flow reserve in various clinical protocols (14,15).
13N-Ammonia is widely used as a flow tracer because of its high myocardial extraction fraction and its relatively long physical half-life (10 min), which together facilitate good image quality. Several studies have validated 13N-ammonia as a marker for the qualitative as well as quantitative assessment of regional myocardial blood flow (16–18). Tracer kinetic models are used to compensate for decreasing myocardial extraction fractions at higher flows, yielding accurate measurements of flow over a wide flow range (4,5). A pattern of heterogeneous retention of 13N-ammonia has been observed in healthy volunteers, limiting the specificity of perfusion defect detection, especially in the lateral wall of the left ventricle (1,4).
82Rb offers the advantage of being a generator-produced radiopharmaceutical with a generator shelf life of about 4 wk. The very short half-life of 82Rb, 76 s, and the relatively low myocardial extraction fraction result in image quality very similar to that provided by 99mTc-based SPECT tracers. This tracer has been validated extensively and is being used clinically as a routine generator-produced radiopharmaceutical in the application of PET and PET/CT for the work-up of patients with CAD (19–22).
Recently, 18F-labeled fluorobenzyl triphenyl phosphonium, a member of the class of potentiometric lipophilic phosphonium cations originally developed for measurement of the mitochondrial membrane potential, was introduced for myocardial perfusion imaging (8). The accumulation of the tracer depends primarily on the mitochondrial membrane potential. Furthermore, the myocardium-to-liver uptake ratio is approximately 1, hampering image contrast for myocardial structures.
In the present study, 18F-BMS-747158-02 was characterized with respect to its usefulness as a PET tracer for myocardial perfusion imaging. The chemical structure of 18F-BMS-747158-02 represents a modification of the pyridazinone insecticide pyridaben. These compounds act through tight binding to mitochondrial complex I, the first component of the electron transport chain, which is highly conserved. 18F-BMS-747158-02 is selectively taken up into the heart because of the high density of mitochondria in cardiac muscle (23,24). The lipophilicity of the compound and its high binding affinity (50% inhibitory concentration of ∼13.8 nM (25)) result in a very high binding capacity.
Our study of the first-pass extraction fraction of the tracer in an isolated rat heart showed that the extraction fraction was higher than 90% and essentially flow independent (5–15 mL/min). Therefore, we conclude that delivery of the tracer by myocardial flow remains the limiting factor for retention, fulfilling the requirement for an almost ideal flow tracer.
This high extraction fraction is surprising, because the flow rates in the non–blood-perfused rat heart are considerably higher than those under physiologic conditions. Other common SPECT and PET perfusion tracers that are retained in the myocardium have considerably lower values. The SPECT tracer 99mTc-sestamibi has an average myocardial extraction fraction of 0.38 (SD = 0.09) for a flow range of 0.52–3.19 mL/min/g (26). For 13N-ammonia, an extraction fraction of 0.82 (SD = 0.06) has been found at a control flow after injection into the left circumflex coronary artery (27); lower extraction fractions have been found at higher flows (in mL/min/100 g; calculated as extraction fraction = 1 − 0.607−125/flow). For 82Rb, a value of 0.42 (SD = 0.06) has been found after injection into the femoral vein at normal resting flow rates (0.75–1.5 mL/min/g) (28). The observation of an essentially flow-independent extraction fraction for 18F-BMS-747158-02 implies a linear relationship between uptake and myocardial blood flow, which is an important attribute for stress flow measurements. To our knowledge, the observed increase in tracer retention in the rat heart during pharmacologic stress testing with adenosine infusion is the first documentation of the expected relationship between uptake and perfusion. The stress-to-rest retention ratio of approximately 1.9 in the present study corresponds well to the reported value of 1.8 (SD = 0.6) for adenosine stress testing with validated tracer kinetic models of 13N-ammonia in the rat heart (11). However, further studies with larger animals and labeled microspheres as a gold standard are being performed in our laboratory to define the relationship between 18F-BMS-747158-02 PET flow measurements and microsphere-derived blood flow in the heart (29).
Because this tracer is bound to mitochondrial structures, it needs to be clarified whether alterations in the metabolic state of the myocardium (hypoxia or ischemia) affect the regional retention of the tracer. Such alterations have been observed with 99mTc-sestamibi, which is also retained in mitochondrial structures (30). However, small metabolically induced changes in tissue retention may not affect the overall diagnostic performance of an imaging approach, as shown by blood flow data obtained with 99mTc.
The metabolic fate of the tracer was not evaluated in the present study. An observed slight increase in blood activity over time (Table 1) may suggest the presence of metabolites with different tissue uptake characteristics. Therefore, tracer retention estimates were restricted to the first 2 min after tracer injection, when metabolic effects are expected to be negligible.
The relatively slow washout of the tracer allows for imaging protocols with high count statistics. Gated data acquisition would provide measurements of ventricular volumes and wall motion. Patients can be injected during peak exercise on a treadmill and transferred for imaging after the completion of the exercise protocol.
CONCLUSION
The data presented here describe a promising 18F-labeled perfusion tracer which, in combination with PET/CT, can be clinically useful for a comprehensive evaluation of patients with CAD. Such an evaluation can include assessment of coronary stenosis by coronary CT angiography and quantitation of flow reserve and global and regional ventricular function by PET.
Acknowledgments
We acknowledge the contribution of Ming Yu, PhD, in the initial ex vivo characterization of the tracer. We thank Michael Herz for the accurate and reliable operation of the cyclotron as well as Birgit Meissner and Karin Mesecke for secretarial assistance. This study was supported by a research grant from BMS.
Footnotes
-
COPYRIGHT © 2008 by the Society of Nuclear Medicine, Inc.
References
- Received for publication June 28, 2007.
- Accepted for publication December 4, 2007.


Jump to section
Related Articles
Cited By...
- Rest/Stress Myocardial Perfusion Imaging by Positron Emission Tomography with 18F-Flurpiridaz: A Feasibility Study in Mice
- Diagnostic Performance of PET Versus SPECT Myocardial Perfusion Imaging in Patients with Smaller Left Ventricles: A Substudy of the 18F-Flurpiridaz Phase III Clinical Trial
- Phase-III Clinical Trial of Fluorine-18 Flurpiridaz Positron Emission Tomography for Evaluation of Coronary Artery Disease
- Stability of Distribution of F18 Flurpiridaz After Transient Coronary Occlusion in Pigs
- Quantitative Assessment of Coronary Microvascular Function: Dynamic Single-Photon Emission Computed Tomography, Positron Emission Tomography, Ultrasound, Computed Tomography, and Magnetic Resonance Imaging
- Integration of Quantitative Positron Emission Tomography Absolute Myocardial Blood Flow Measurements in the Clinical Management of Coronary Artery Disease
- Comparison of 18F-Labeled Fluoroalkylphosphonium Cations with 13N-NH3 for PET Myocardial Perfusion Imaging
- Absolute Quantitation of Myocardial Blood Flow in Human Subjects With or Without Myocardial Ischemia Using Dynamic Flurpiridaz F 18 PET
- Novel PET Probes 18F-BCPP-EF and 18F-BCPP-BF for Mitochondrial Complex I: A PET Study in Comparison with 18F-BMS-747158-02 in Rat Brain
- Small-Animal PET Imaging of Isolated Perfused Rat Heart
- Assessment of the 18F-Labeled PET Tracer LMI1195 for Imaging Norepinephrine Handling in Rat Hearts
- Phase II Safety and Clinical Comparison With Single-Photon Emission Computed Tomography Myocardial Perfusion Imaging for Detection of Coronary Artery Disease: Flurpiridaz F 18 Positron Emission Tomography
- Evaluation of a Mitochondrial Voltage Sensor, (18F-Fluoropentyl)Triphenylphosphonium Cation, in a Rat Myocardial Infarction Model
- Synthesis and Preliminary Evaluation of 18F-Labeled Pyridaben Analogues for Myocardial Perfusion Imaging with PET
- Phase I, First-in-Human Study of BMS747158, a Novel 18F-Labeled Tracer for Myocardial Perfusion PET: Dosimetry, Biodistribution, Safety, and Imaging Characteristics After a Single Injection at Rest
- Stable Delineation of the Ischemic Area by the PET Perfusion Tracer 18F-Fluorobenzyl Triphenyl Phosphonium After Transient Coronary Occlusion
- Simplified Quantification of Myocardial Flow Reserve with flurpiridaz F 18: Validation with Microspheres in a Pig Model
- Cardiac Positron Emission Tomography
- Absolute Figures Are Better Than Percentages
- Comparison of Positron Emission Tomography Measurement of Adenosine-Stimulated Absolute Myocardial Blood Flow Versus Relative Myocardial Tracer Content for Physiological Assessment of Coronary Artery Stenosis Severity and Location
- Evaluation of the Novel Myocardial Perfusion Positron-Emission Tomography Tracer 18F-BMS-747158-02: Comparison to 13N-Ammonia and Validation With Microspheres in a Pig Model
- Evaluation of a Novel 18F-Labeled Positron-Emission Tomography Perfusion Tracer for the Assessment of Myocardial Infarct Size in Rats
- A Novel 18F-Labeled Tracer for the Quantification of Myocardial Blood Flow and Infarct Size With Positron-Emission Tomography: Another Way to Avoid the Need of an On-Site Cyclotron
- A New 18F-Labeled Myocardial PET Tracer: Myocardial Uptake After Permanent and Transient Coronary Occlusion in Rats