


Abstract
The aim of this study was to investigate regional differences between morphologic and functional changes in patients with mild dementia with Lewy bodies (DLB) compared with those with Alzheimer's disease (AD). Methods: Twenty patients with very mild DLB (mean age, 74.5 y; mean Mini-Mental State Examination [MMSE] score, 24.0), 20 patients with very mild AD (mean age, 74.1 y; mean MMSE score, 24.0), and 20 age- and sex-matched healthy volunteers (normal controls [NC]) underwent both 18F-FDG PET and 3-dimensional spoiled gradient echo MRI. Fully automatic volumetry of the MRI data was used to obtain whole brain, hippocampal, occipital, and striatal volumes, which were compared with the results of a similar analysis of glucose metabolic data. Results: In DLB patients, volumetric data indicated a significant volume decrease in the striatum, whereas 18F-FDG PET showed significant glucose metabolic reductions in the temporal, parietal, and frontal areas—including in the occipital lobe—compared with those in the NC group. In contrast, in AD patients, both the hippocampal volume and glucose metabolism were significantly decreased, whereas the occipital volume and metabolism were preserved. Conclusion: Comparison of very mild DLB and AD revealed different morphologic and metabolic changes occurring in the medial temporal lobes and the occipital lobe, demonstrating characteristic pathophysiologic differences between these 2 diseases.
Dementia with Lewy bodies (DLB), a clinical entity of primary degenerative dementia pathologically characterized by the presence of Lewy bodies in cortical, subcortical, and brain-stem structures, is the second most common degenerative dementia after Alzheimer's disease (AD). In the DLB brain, the occipital lobe is not affected histopathologically but metabolic or perfusional reduction is present in the occipital lobe (1–3), whereas the medial temporal limbic area is minimally affected histopathologically (4–6). In the mild AD brain, neuropathologic changes predominantly affect the neocortical association area and medial temporal limbic area. These histopathologic changes lead to focal atrophy and can be demonstrated by MRI (7,8), whereas metabolic reductions are demonstrated in the neocortical association area by PET (9,10). However, there has been controversy as to whether medial temporal metabolic reductions exist in the early stage of AD (11–16). The localization method using the region of interest (ROI) showed that significant medial temporal hypometabolism may be seen in AD, even in the incipient amnestic mild-cognitive-impairment stage (13–15). These morphologic and functional changes in the same patients have been studied in AD patients (16), although, to our knowledge, there are no reports describing these investigations in the same DLB patients.
By analyzing both MR images and glucose metabolic PET in patients with mild DLB or AD in this study—using automatic volumetric and voxel-based techniques for MR images and metabolic values of regional structures and the voxel-based technique for PET images—we delineated differences in detectable morphologic and functional abnormalities between DLB and AD.
MATERIALS AND METHODS
All procedures followed the clinical study guidelines of our institute and were approved by the Institutional Review Board. Written informed consent was obtained from subjects and patients or patients' relatives. We studied 60 subjects, including 20 patients with very mild DLB (mean age ± SD, 74.5 ± 4.9 y; 11 women, 9 men), 20 patients with very mild AD (mean age ± SD, 74.1 ± 3.3 y; 13 women, 7 men), and 20 age-matched healthy volunteers (NC) (mean age ± SD, 72.9 ± 3.3 y; 15 women, 5 men).
All patients were examined by neurologists and psychiatrists and underwent MRI of the brain, MR angiography of the neck and head, electroencephalography, and standard neuropsychologic examinations. Although the criteria for the diagnosis and management of DLB were revised in 2005 (17), we used the former criteria reported in 1996 for this study. Because the new criteria include morphologic and functional findings and this study dealt directly with morphologic and functional findings of DLB, to avoid sample selection bias, our DLB inclusion criteria were based on the DLB 1996 diagnostic criteria, which do not refer to MR images and PET findings.
The inclusion criteria for DLB were (a) a diagnosis of probable DLB using the criteria of the consortium on DLB international workshop published in 1996 (18), (b) no evidence of focal brain lesions on MR images, and (c) a mean Mini-Mental State Examination (MMSE) score of >20 (19).
The inclusion criteria for AD were (a) a diagnosis of probable AD using National Institute of Neurological and Communicative Disorders and Stroke/Alzheimer's Disease and Related Disorders Association criteria (20), (b) no evidence of focal brain lesions on MR images, and (c) a MMSE score of >20. We excluded (a) patients with complications from other neurologic diseases or those in poor overall physical condition, (b) those who had severe language, attention, or behavioral disorders that would make performance of the MRI and PET procedures difficult, and (c) those from whom informed consent could not be obtained.
The mean MMSE score ± SD was 24.0 ± 2.2 in the DLB group and 24.0 ± 2.2 in the AD group. Healthy volunteers (NC), who served as control subjects, had no neurologic signs or significant medical antecedents and no abnormal findings on MR images. None of the subjects in this study had diabetes mellitus. The mean MMSE score ± SD of the NC group was 29.8 ± 0.6.
MRI Procedure
The MR scanner was a 1.5-T Signa Horizon (GE Healthcare). Three-dimensional spoiled gradient echo imaging (repetition time, 14 ms; echo time, 3 ms; flip angle, 20°; thickness, 1.5 mm; 124 slices) was performed. MR images were obtained 0–28 d before the PET examinations.
PET Procedure
The PET procedure is described in detail elsewhere (21). In brief, 18F-FDG PET images were obtained using a Headtome IV scanner (Shimadzu Corp.). Before the PET scans, all subjects received MR examinations for PET positioning. All subjects fasted for at least 4 h before PET. Subjects were studied in the resting condition, with eyes closed but without ears plugs. After obtaining a transmission scan, a 12-min emission scan was started 60 min after intravenous injection of 185–370 MBq of 18F-FDG. Data were collected in 128 × 128 matrices. The slice interval was 6.5 mm when the z-motion mode was used.
Data Analysis
Voxel-Based Comparison.
All MR images and PET data were transferred to a personal computer. Regional brain volume was measured with a combination of software using normalizing and segmentation techniques for SPM5 ([SPM = statistical parametric mapping] Wellcome Department of Cognitive Neurology, London, United K. [http://www.fil.ion.ucl.ac.uk/spm/software/spm5/]) (22–24). For PET, all individual PET images were transformed into a standard stereotactic anatomic space. Then, all images were smoothed using an isotropic gaussian kernel (12 mm, full width at half maximum [FWHM]) to increase the signal-to-noise ratio and to compensate for the differences in gyral anatomy among individuals. Individual 18F-FDG images were adjusted using proportional scaling to a mean value of 5.0 mg/100 mL/min. For MRI, voxel-based morphometry (VBM) was used (25). After anatomic normalization, the images were automatically segmented using a cluster analysis technique. The image sets of gray matter (GM) were smoothed with an isotropic gaussian filter (12 mm, FWHM), and individual global counts were normalized by proportional scaling to a mean value of 5.0. These PET and MRI datasets from DLB patients, AD patients, and NC subjects were compared on a voxel-by-voxel basis using 1-way ANOVA. For direct comparison between DLB and AD, a 2-sample t test was performed between GM images in DLB and AD groups and between PET images in DLB and AD groups. Significance was accepted if the voxels survived a corrected threshold of P < 0.05 or an uncorrected threshold of P < 0.001.
Volumetry and Relative Glucose Metabolism.
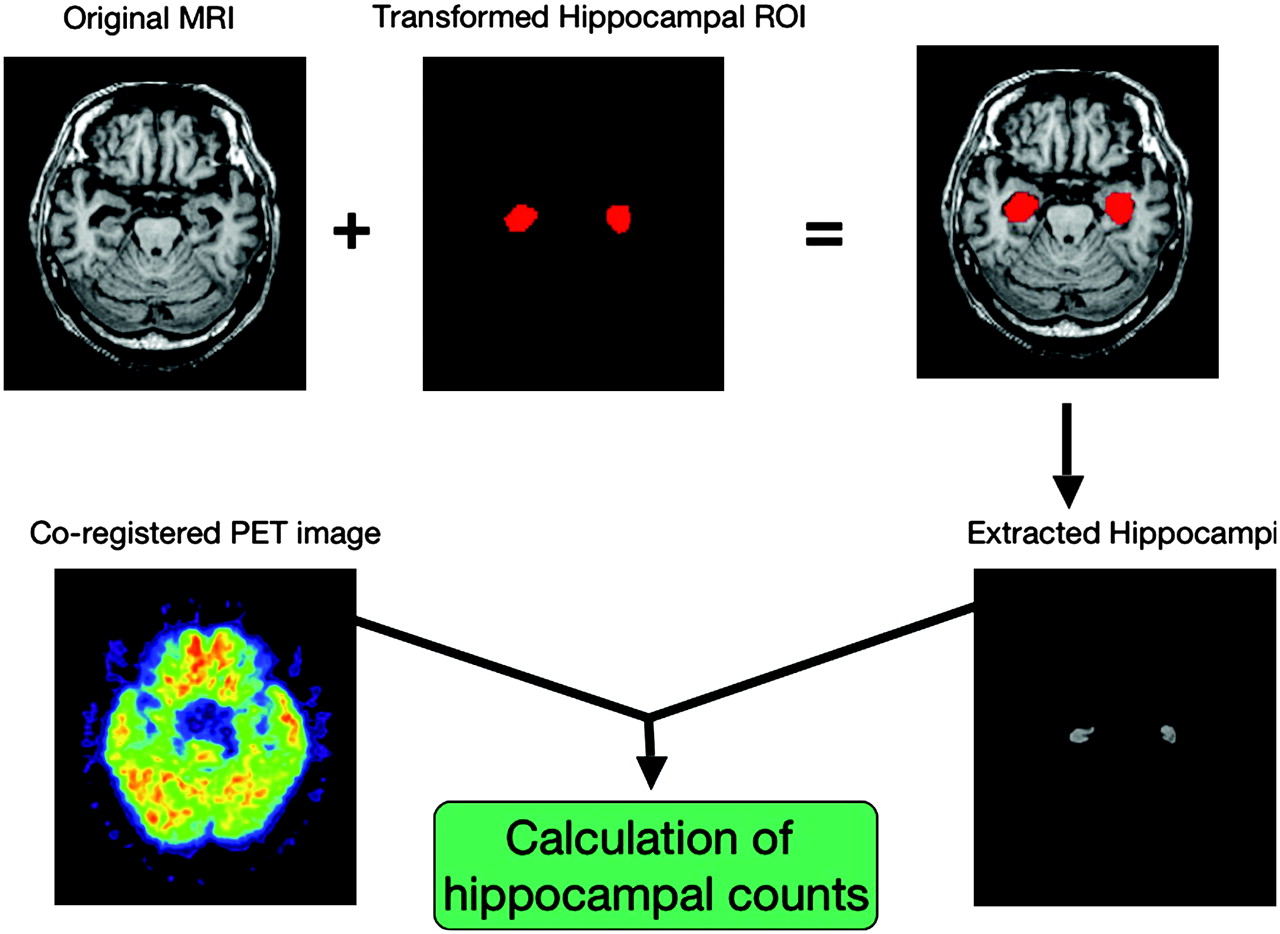
Volumetry and measuring 18F-FDG accumulation were performed with our modified automatic volumetric measurement of segmented brain images system (AVSIS) (26). In brief, before this analysis, voxels of interest (VOIs) templates for intracranial, hippocampi, striata, and occipital lobes were prepared. Each regional VOI template was produced on a digital phantom: the Simulated Brain Database ([SBD] http://www.bic.mni.mcgill.ca/brainweb/) in standard Montreal Neurological Institute (MNI) space, delineating the contours of each structure manually. The occipital lobe's VOI template included Brodmann areas 17, 18, and 19. The process of modified AVSIS is as follows: first, each individual MR image and PET image were coregistered, and then each subject's MR image was segmented into GM, white matter (WM), and cerebrospinal fluid (CSF) with the SPM5 segmentation program. The GM template image derived from the SBD was then spatially transformed into the individual subject's GM image, and a normalization parameter was produced. This is the same as a reversed parameter produced in anatomic normalization of individual brain to standard brain. Using this parameter, the intracranial, hippocampal, striatal, and occipital VOI templates were transformed to the individual subject's space. The total intracranial volume (TIV) area was adjusted with an image derived from the segmented GM, WM, and CSF images. The segmented images were calculated as follows: WM and GM areas were calculated with the voxels in the TIV VOI template, GM volumes in the hippocampi and striata were calculated using the transformed hippocampal and striatal VOI templates, whereas volumes of GM and WM in the occipital lobes were calculated using the transformed occipital VOI template for each subject. Each regional relative volume was calculated by normalization relative to the TIV. Next, hippocampal, striatal, and occipital 18F-FDG uptake counts were calculated by determining the regions of coregistered 18F-FDG images on each extracted area using the described volumetric procedure (Fig. 1). Because pontine and sensorimotor glucose metabolisms are relatively preserved in DLB (1), we used these regions for reference regions for calculating the relative regional cerebral glucose metabolism. Beforehand, 18F-FDG PET images were transformed into the MNI space with SPM5, and then pontine and sensorimotor 18F-FDG uptake counts were determined in the ROIs placed on the pons below 20–22 mm and the sensorimotor area over 38–42 mm from the anterior commissure–posterior commissure plane on the transformed MNI space. Then the extracted regional counts were normalized to the pontine counts or the sensorimotor counts and shown as relative glucose metabolism. Additionally, we calculated the affected region ratio of DLB and AD: for MRI, striatal volume/hippocampal volume (Str/Hipp), and for PET, occipital/hippocampal counts (Occ/Hipp). Differences between groups were assessed using ANOVA followed by the post hoc Scheffé test to correct for multiple comparisons. All statistical tests were regarded as significant at P < 0.05.

Algorithm for calculating regional structural volume and glucose metabolism An example of calculating hippocampal volume and metabolism is shown. Hippocampal VOI template is transformed to individual brain and, using this VOI template on individual segmented MR image, hippocampi are extracted and hippocampal volume is calculated. Then, using extracted hippocampi as a hippocampal VOI for individual coregistered PET image, hippocampal counts representing glucose metabolism are determined.
ROC Analysis for Discriminating DLB from AD.
We also performed a receiver-operating-characteristic (ROC) analysis for discriminating DLB from AD with the obtained relative values for hippocampal and striatal volumes normalized to the TIV (Hipp/TIV and Str/TIV) and hippocampal, striatal, and occipital glucose metabolisms normalized to the pontine or the sensorimotor glucose metabolism (Hipp/pons, Str/pons, and Occi/pons or Hipp/SM, Str/SM, and Occi/SM) and the affected region ratio for discriminating DLB from AD. ROC analysis was performed using ROCKIT software 0.9B (Dr. Charles E. Metz, Department of Radiology, The University of Chicago, Chicago, IL). The areas under the curves and accuracy were calculated.
RESULTS
Voxel-Based Comparison
In the MRI VBM study, the gray matter densities of the left parahippocampal gyrus and the hippocampal complex in the AD group were significantly lower than those in the NC group (P < 0.05, corrected), whereas the gray matter densities of the left putamen and caudate head in the DLB group were significantly lower than those in the NC group (P < 0.05, corrected) (Table 1; Fig. 2A).
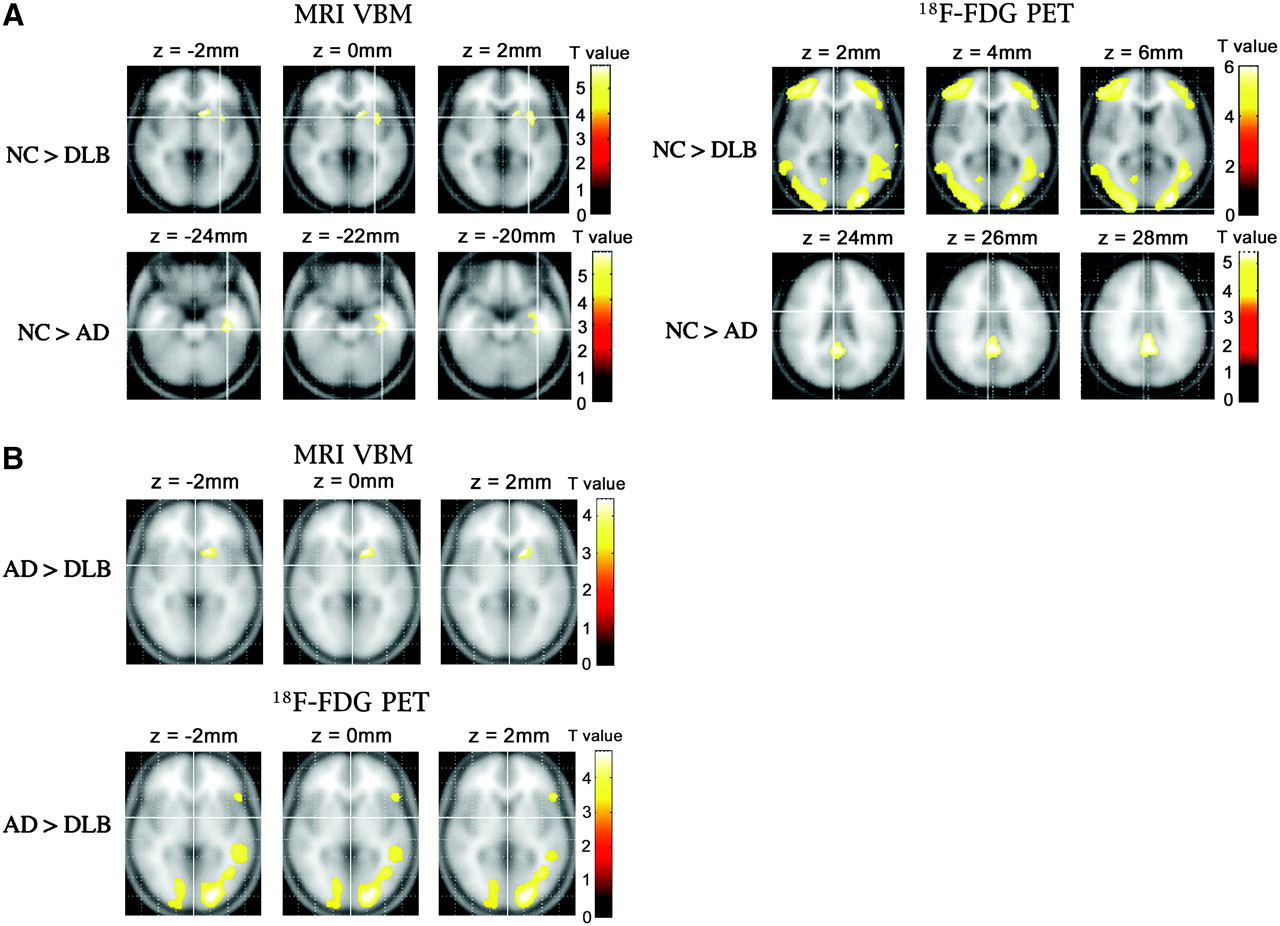
Voxels with significantly lower GM density or glucose metabolism are shown in axial plane of standard brain. (A) Left caudate and putamen GM densities in DLB group were significantly lower than those of NC group (upper left row). Left hippocampal and parahippocampal GM densities in AD group were significantly lower than those of NC group (lower left row). Bilateral occipital, temporoparietal, and frontal glucose metabolisms in DLB group were significantly lower than those in NC group (upper right row), and parietal and posterior cingulated metabolisms were also decreased (not shown). Bilateral posterior cingulate glucose metabolism in AD group was significantly lower than that in NC group (lower right row) (P < 0.05, corrected). (B) Left caudate GM densities in DLB group were significantly lower than those of AD group (upper row). Bilateral occipital glucose metabolism was significantly decreased in DLB compared with that in AD (lower row), and glucose metabolism in bilateral frontal, parietotemporal association cortices and left posterior cingulate gyrus, was also significantly reduced in DLB (not shown) (P < 0.001, uncorrected).
Peak Location of Significant GM Density Decrease of Metabolic Decrease in DLB Group and AD Group Compared with NC Group or Those in DLB Group Compared with AD Group
PET SPM analysis demonstrated that a metabolic reduction was present in the bilateral posterior cingulate gyri in the AD group compared with that of the NC group (P < 0.05, corrected). Furthermore, in the DLB group, occipital, temporal, parietal, and frontal metabolisms were significantly reduced compared with those in the NC group (P < 0.05, corrected) (Table 1; Fig. 2A).
In direct comparison between the DLB and AD groups, VBM demonstrated a reduced left caudate volume in the DLB group compared with that in the AD group but did not show significantly reduced regions in the AD group compared with those in the DLB group (Table 1; Fig. 2B) (P < 0.001, uncorrected). SPM analysis for PET showed significantly reduced metabolism in the bilateral frontal, parietotemporal association cortices, left posterior cingulate gyrus, and bilateral occipital lobes in the DLB group compared with that in the AD group but did not show significantly reduced regions in the AD group compared with that in the DLB group (Table 1; Fig. 2B) (P < 0.001, uncorrected).
Volumetry and Relative Glucose Metabolism
Mean regional volumes in each group are presented in Table 2. TIV, whole brain (WB), and hippocampal volumes in the AD group were significantly smaller than those in the NC group. The AD group's WB volume normalized to TIV did not differ significantly from that of the NC group, but the AD group's hippocampal volume normalized to TIV was significantly smaller than that in the NC group. There were no significant differences in occipital volumes among the DLB, AD, and NC groups for either the absolute or the relative values normalized to TIV. Absolute and relative striatal volumes (Str/TIV) in the DLB group were significantly smaller than those in the NC group, and striatal volumes (Str/TIV) in the DLB group were significantly smaller than those in the AD group.
Mean Volumes and Glucose Metabolism of Each Region
Occipital glucose metabolism normalized to that of the pons or sensorimotor area was significantly reduced in the DLB compared with that of the AD and NC groups. Hippocampal metabolism normalized to that of the pons or sensorimotor area was also significantly reduced in the AD group compared with that of the DLB and NC groups (Table 2).
The affected region ratios of MRI and PET are shown in Table 3. The MRI Str/Hipp ratio in the AD group was significantly higher than that of the DLB and NC groups, and the PET Occ/Hipp ratio in the DLB group was significantly lower than that of the AD and NC groups.
Affected Region Ratios
ROC Analysis for Discriminating DLB from AD
Accuracies and areas under the ROC curve for discriminating DLB from AD by each value are shown in Table 4. The areas under the ROC curve and the accuracy for PET Occ/Hipp were the highest among those of other values, though there were no significant differences in the partial area index for ROC curves among these parameters. Figure 3 shows the ROC curves of the MRI Hipp/TIV, Str/TIV, PET Hipp/pons, and Occ/pons and the affected regional ratio of MRI Str/Hipp and PET Occ/Hipp for discriminating DLB from AD.

ROC curves for PET and MRI diagnostic performances in discriminating DLB from AD. Area under ROC curve of Occ/Hipp by PET (area under the curve [Az] = 0.941) was the largest among all values. (A) Relative regional volumes of hippocampi (Hipp/TIV) and striata (Str/TIV) by MRI. (B) Relative regional glucose metabolism in hippocampi (Hipp/pons) and occipital lobes (Occ/pons) by 18F-FDG PET. (C) Affected regional ratio obtained by PET (Occ/Hipp) and MRI (Str/Hipp). TPF = true-positive fraction = sensitivity; FPF = false-positive fraction = 1 − specificity.
Area Under ROC Curves and Accuracy for Discriminating DLB from AD by Each Value
DISCUSSION
To date, 18F-FDG PET and MR images obtained in mild DLB and NC subjects have been studied separately, not in the same individuals. To our knowledge, our study is the first in which 18F-FDG PET and MR images from the same individuals with mild DLB were studied and compared with those of individual AD subjects. We were able to show that the areas of reduced metabolism and diminished GM volume are not the same in these 2 neurodegenerative diseases.
Voxel-Based Analysis
VBM analysis showed significant striate atrophy in DLB and hippocampal atrophy in AD, even in the mild stages of these diseases, though only on the left side. SPM analysis of 18F-FDG PET findings revealed significant glucose metabolic reductions in the occipital, temporoparietal, and frontal association cortices in the DLB. Thus, even in the mild stage of DLB, glucose metabolic disturbances are widespread compared with those of healthy aged subjects. SPM analysis of mild AD brains also demonstrated posterior cingulate glucose metabolic reduction, an observation that supports previous reports (10,15,16). Our study demonstrated in the DLB brain not only previously identified posterior hypometabolism, including the posterior cingulate and occipital regions, but also frontal hypometabolism. The metabolic reduction pattern of DLB is relatively similar to that of AD, with association of occipital metabolic reduction; however, the degree of metabolic reduction in those areas is larger than that of AD, which has been reported in moderate DLB (1). Our study showed the same pathophysiology even in mild DLB. We emphasized that mild DLB shows abnormalities involving vast portions of the entire cortex compared with mild AD. Thus, it appears that the process of neurodegeneration may be more advanced in the mild DLB group compared with the mild AD group, in spite of comparable neuropsychologic results. There are 2 different aspects: (a) better cognitive reserve in the DLB group or (b) insufficient sensitivity of the applied neuropsychologic testing—MMSE to detect the true extent of neurodegeneration in DLB. In any case, it cannot be excluded that the observed findings may in part be due to different stages of disease in using MMSE scores.
Medial Temporal Lobe
The medial temporal area is histopathologically affected in the early stages of AD. This medial temporal change has been described in previous reports using MRI (7,8) and was confirmed in the present study of patients with very mild AD. Morphologic imaging by MRI clearly demonstrates macropathologic changes in mild AD. However, previous PET studies have shown that medial temporal glucose metabolism and blood flow are preserved in mild-to-moderate AD patients (11,28). Recently, Nestor et al. in 2003 (14) and Mosconi et al. in 2005 (15) suggested that hippocampal metabolism in patients with mild cognitive impairment and AD was reduced, based on results obtained using their technique of drawing ROIs on MR images, and described the voxel-based analysis using SPM as failing to show the hippocampal metabolic reduction. Herein, we verified their findings using our new VOI warping method combined with MRI. In mild AD patients, SPM did not demonstrate hippocampal metabolic reduction, whereas our method showed significantly reduced hippocampal metabolism. However, in mild DLB, neither SPM nor our method demonstrated this reduction in hippocampal metabolism. As to structural change, no hippocampal volume reduction was demonstrated in DLB using either SPM or our method. Therefore, in mild AD, but not mild DLB, both metabolic and structural alterations are present. These findings support previous results obtained by studying functional and morphologic changes separately. There was a 5% reduction in the Hipp/SM ratio in AD compared with NC but there was a 6% increase in this ratio when DLB was compared with NC (Table 1). It seems highly unlikely that DLB is associated with hippocampal hypermetabolism. This suggests that the increase in the ratio is actually due to a decrease in the denominator—that is, there is a degree of SM hypometabolism in DLB consequently due to a widespread metabolic reduction even in the mild DLB brain. Therefore, as the Hipp/pons ratio showed, hippocampal metabolism in mild DLB seems not increased but relatively preserved.
Striatum
In the striatum, dopamine transporter imaging is reportedly useful for distinguishing between DLB and AD because, in the former, dopamine transporter uptake in the striatum is low (29,30). Though low dopamine transporter uptake has been shown in the DLB striatum, to our knowledge, there are no reports indicating that striatal metabolism or perfusion is altered. Glucose metabolism in the striatum was reported to be preserved in DLB, based on measuring absolute glucose metabolism (1). Our study verified that relative striatal metabolism was also preserved in the mild DLB brain. We showed reduced striatal volume in DLB brains compared with those affected by AD and in NC subjects. Barber et al. reported that volumetric MRI analysis of the caudate nucleus does not discriminate among patients with DLB, AD, and vascular dementia (31). Almeida et al. also found that caudate atrophy is not region specific but, rather, is part of generalized brain volume loss (32). On the contrary, Cousins et al. showed that patients with DLB had significantly smaller ratios of putamen volume to TIV than both control subjects and patients with AD and, furthermore, that the AD patients did not differ from control subjects in any measure of the putamen volume (33). Our study supports their findings indicating that striatal volume in the DLB brain is significantly smaller than those in AD and NC brains. It is interesting that, in spite of volume loss of striatum, there is no glucose metabolic reduction in DLB. The pathophysiology of this situation is unclear. This may be due to upregulation of the low dopamine uptake.
Occipital Lobe
In the DLB brain, occipital glucose metabolism is affected despite the absence of morphologic change, though the metabolic and morphologic features have been studied separately. Gross structural changes in the occipital lobe reportedly do not occur in patients with mild-to-moderate DLB or AD, based on results obtained using MRI volumetric techniques (34). Our study demonstrates these findings in individual subjects. On the contrary, using VBM, Burton et al. reported that occipital atrophy in Parkinson disease dementia (PDD) was the only difference between patients with Parkinson's disease and a PDD group (35). Although PDD is thought to be in the same spectrum as DLB, no previous reports have demonstrated significant occipital atrophy in DLB. Our VBM study and volumetric study confirmed the latter findings. Burton et al. also noted that uncertainty remains with regard to the relationships between atrophy, neuropathologic changes, and perfusion deficits in Parkinson's disease with and without dementia (35). Our study confirmed morphologic and functional discrepancies in the same individual DLB brains.
Differential Diagnosis for AD and DLB
For routine clinical examination, conventional ROI placement or a voxel-based technique, identifying reduced occipital glucose metabolism, may be worthwhile because, as shown in the present study, these techniques are moderately useful for distinguishing mild DLB from mild AD. Moreover, our ROC analysis demonstrated that the PET Occ/Hipp value—which was amplified with combination of each DLB's and AD's affected value obtained with 18F-FDG PET—has higher accuracy than other values. Herein, we used software combining 18F-FDG PET and MRI with extraction of regional structures such as the hippocampus.
CONCLUSION
We demonstrated that morphologically and metabolically affected regions differ between very mild stages of DLB and AD. Our findings suggest that a combined morphologic and functional approach using both MRI and PET may improve the accuracy of early diagnosis of very mild DLB and AD. We anticipate further study in a clinical setting to confirm the potential of combining these 2 imaging modalities.
Footnotes
-
COPYRIGHT © 2007 by the Society of Nuclear Medicine, Inc.
References
- Received for publication August 17, 2006.
- Accepted for publication January 29, 2007.


Jump to section
Related Articles
Cited By...
- Motion discrimination in dementia with Lewy bodies and Alzheimer disease
- PET Approaches for Diagnosis of Dementia
- Visual-Statistical Interpretation of 18F-FDG-PET Images for Characteristic Alzheimer Patterns in a Multicenter Study: Inter-Rater Concordance and Relationship to Automated Quantitative Evaluation
- Imaging Approaches for Dementia
- Resting bold fMRI differentiates dementia with Lewy bodies vs Alzheimer disease
- Measurement of Gray and White Matter Atrophy in Dementia with Lewy Bodies Using Diffeomorphic Anatomic Registration through Exponentiated Lie Algebra: A Comparison with Conventional Voxel-Based Morphometry
- Target-Specific PET Probes for Neurodegenerative Disorders Related to Dementia
- Differential Diagnosis of Dementia with Lewy Bodies and Alzheimer Disease Using Combined MR Imaging and Brain Perfusion Single-Photon Emission Tomography
- The 18F-FDG PET Cingulate Island Sign and Comparison to 123I-{beta}-CIT SPECT for Diagnosis of Dementia with Lewy Bodies