


Abstract
Regional myocardial blood flow (MBF) can be measured with 15O-water and PET using the 1-tissue-compartment model with perfusable tissue fraction, which provides an MBF value that is free from the partial-volume effect. Studies with 15O-water have several advantages, such as the ability to repeat a scan. However, because of the short scanning time and the small distribution volume of 15O-water in the myocardium, the image quality of 15O-water is limited, impeding the computation of MBF and perfusable tissue fraction at the voxel level. We implemented the basis function method for generating parametric images of MBF, perfusable tissue fraction, and arterial blood volume (Va) with 15O-water and PET. The basis function method linearizes the solution of the 1-tissue-compartment model, which results in a computationally much faster method than the conventional nonlinear least-squares fitting method in estimating the parameters. Methods: To validate the basis function method, we performed a series of PET studies on miniature pigs (n = 7). After acquisition of the transmission scan for attenuation correction and the 15O-CO scan for obtaining the blood-pool image, repeated PET scans with 15O-water were obtained with varying doses of adenosine or CGS-21680 (selective adenosine A2a receptor agonist). MBF, perfusable tissue fraction, and Va values of the myocardial region for each scan were computed using the basis function method and the nonlinear least-squares method, and the parameters estimated by the 2 methods were compared. Results: MBF images generated by the basis function method demonstrated an increase in blood flow after administration of adenosine or CGS-21680. The MBF values estimated by the basis function method and by the nonlinear least-squares method correlated strongly. Conclusion: The basis function method produces parametric images of MBF, perfusable tissue fraction, and Va with 15O-water and PET. These images will be useful in detecting regional myocardial perfusion abnormalities.
A technique has been proposed to noninvasively measure regional myocardial blood flow (MBF) using 15O-water and PET (1–3). The technique uses a single-tissue-compartment model, and its validity has been confirmed by several investigators, mostly by a comparison with microsphere experiments. One unique feature of this technique is that the model incorporates the concept of water-perfusable tissue fraction, which corrects the underestimation of MBF due to cardiac wall motion and the thinness of the myocardial wall relative to the intrinsic spatial resolution of the PET scanner. Therefore, the MBF value measured by this technique is independent of the PET camera (4). The use of 15O-water with this technique offers several advantages (5), such as its short half-life (2 min), which enables easily repeated scans. Other advantages are that 15O-water is metabolically inert and the synthesis of 15O-labeled compounds is relatively easy. However, a disadvantage of this technique (5), compared with techniques using 13N-ammonia (6), is that because of the short half-life of 15O and the small distribution volume of 15O-water in the myocardium, the tracer rapidly disappears. Consequently, the image quality is limited, making computation of MBF and perfusable tissue fraction at a voxel level by this technique extremely difficult because of the requirement of nonlinear least-squares fitting. Additionally, the myocardium cannot clearly be visualized because of the diffusibility of water.
Gunn et al. proposed a technique to produce the parametric image of binding potential for 11C-raclopride (dopamine D2 receptor ligand) using the basis function method (7). In this method, the nonlinear terms are first computed and the parameters of each voxel are linearly solved, making estimation of the parameters rapid.
We embraced the concept of the basis function method and implemented it to generate parametric images of MBF, perfusable tissue fraction, and arterial blood volume (Va) with 15O-water and PET. PET studies were performed on miniature pigs to evaluate the technique.
The theory of the method is as follows.
The tissue activity curve of the myocardial region observed by PET (Dm(t) [cps/mL]) after the administration of 15O-water can be expressed using MBFp(f) (mL/min/g of perfusable tissue), perfusable tissue fraction (a) (g/mL), and Va fraction (mL/mL) as follows (2):
 Eq. 1
where Ca(t) (cps/mL) is the arterial input function, p is the tissue/blood partition coefficient (assuming a constant of 0.91 mL/g (1)), and λ is the physical decay constant of 15O (0.00567 s−1). ⊗ denotes the convolution operation. Dm(t) and Ca(t) in Equation 1 are not corrected for the physical decay of 15O. The 3 parameters f, α, and Va can be estimated by fitting to Equation 1 using the nonlinear least-squares method.
Eq. 1
where Ca(t) (cps/mL) is the arterial input function, p is the tissue/blood partition coefficient (assuming a constant of 0.91 mL/g (1)), and λ is the physical decay constant of 15O (0.00567 s−1). ⊗ denotes the convolution operation. Dm(t) and Ca(t) in Equation 1 are not corrected for the physical decay of 15O. The 3 parameters f, α, and Va can be estimated by fitting to Equation 1 using the nonlinear least-squares method.
In the basis function method, the nonlinear term in Equation 1 is linearized and Equation 1 is rewritten as follows:
 Eq. 2
where θ1 = Va, θ2 = αf, and θ3 = f/p + λ. The nonlinear term in Equation 2 including θ3 is precalculated as the discrete basis function Bi(t) for the available range of θ3:
Eq. 2
where θ1 = Va, θ2 = αf, and θ3 = f/p + λ. The nonlinear term in Equation 2 including θ3 is precalculated as the discrete basis function Bi(t) for the available range of θ3:
 Eq. 3
Eq. 3
Using the basis function Bi(t), Equation 2 becomes:
 Eq. 4
Eq. 4
Solving Equation 4 is a linear problem against the parameters θ1 and θ2. For each basis function, θ1 and θ2 in Equation 4 are estimated by means of the linear least-squares technique. θ3 is determined by searching the minimum sum of squared residuals between the estimated and observed data among all basis functions. From the determined θ1, θ2, and θ3 values, MBFp, perfusable tissue fraction, and Va can be calculated as f = (θ3 − l)·p, α = θ2/f, and Va = θ1. These computations are done for each voxel, and parametric images of MBFp, MBFt (MBFp·α), perfusable tissue fraction (α), and Va are generated.
In this study, the range of θ3 was set to 0.00567 (decay constant of 15O) < θ3 ≤ 0.1, and 300 discrete basis functions were generated.
Because of heart motion and the limited spatial resolution of PET, the arterial input function, Ca(t) in Equations 1 and 3, cannot be derived directly from the PET image. To obtain Ca(t), we used the following equations (2,3):
 Eq. 5
Eq. 5
 Eq. 6
where Dl(t) is the tissue activity curve for the left ventricle and β is the recovery coefficient of the left ventricular region of interest (ROI) (0.0 < β ≤ 1.0). To obtain Dm(t) and Dl(t), we drew ROIs on the left ventricle and the myocardium. By fitting Dm(t) to Equation 5, we estimated f, α, and Va. Using the estimated parameters, Ca(t) was computed using Equation 6.
Eq. 6
where Dl(t) is the tissue activity curve for the left ventricle and β is the recovery coefficient of the left ventricular region of interest (ROI) (0.0 < β ≤ 1.0). To obtain Dm(t) and Dl(t), we drew ROIs on the left ventricle and the myocardium. By fitting Dm(t) to Equation 5, we estimated f, α, and Va. Using the estimated parameters, Ca(t) was computed using Equation 6.
MATERIALS AND METHODS
Subjects
To validate the present technique, we performed PET studies on 7 miniature pigs (6 mo old, weighing 16.5–21.0 kg). The pigs were anesthetized by introduction of pentobarbital followed by continuous inhalation of propofol (4 mg/kg/h) and were placed supine on the bed of the scanner.
PET Scanning
The scanner used was an ECAT EXACT HR (CTI/Siemens) (8), which has an imaging field of view 55 cm in diameter and 15 cm in axial length. The spatial resolution of the scanner is 5.8 mm in full width at half maximum at the center of the field of view. After obtaining a 10-min transmission scan for attenuation correction, we obtained a blood-pool image with a 4-min PET scan after a 30-s inhalation of 2.7 GBq 15O-CO by the pigs. Arterial blood samples were taken every minute during the 15O-CO scanning, and the radioactivity concentration in the whole blood was measured using a NaI well counter, which was calibrated against the PET scanner. Subsequently, 14 or 15 PET scans with 15O-water were obtained with administration of various doses of adenosine or the selective adenosine A2a receptor agonist CGS-201680 (9) (6 scans with adenosine [25, 50, 100, 200, 400, and 800 mg/kg/min] and 6 scans with CGS-21680 [0.5, 1, 2, 5, 10, and 20 μg/kg], with the addition of 2 or 3 scans under resting conditions). The total number of PET scans with 15O-water was 100 for the 7 pigs. The interval between scans was more than 15 min to allow for physical decay of 15O radioactivity to the background level. 15O-water was injected into the right femoral vein for 30 s at an infusion rate of 10 mL/min (injected radioactivity was about 700 MBq). Immediately after injection of water, PET data were acquired for 6 min, with 26 dynamic frames: 12 × 5 s, 8 × 15 s, and 6 × 30 s. All acquisitions were in 2-dimensional mode (septa extended).
Additional scanning was performed in list mode on a miniature pig for 6 min. The scan was obtained under resting condition. This dataset was used to evaluate the voxelwise noise property of the functional images produced by the technique.
Image Processing
A filtered backprojection algorithm with a 6-mm gaussian filter was used for image reconstruction. The reconstructed images had a matrix size of 128 × 128 × 47 and a voxel size of 1.84 × 1.84 × 3.38 mm, and all image datasets were resliced into short-axis images with 20 slices across the left ventricle.
For the list-mode dataset, each event of the list-mode data was normalized, correcting for both detector efficiency and geometry, as well as crystal interference (10). Then, the list-mode data were sorted into 30 subsinogram datasets, and 10 replicated sinogram datasets were generated from the subsinogram datasets using the nonparametric bootstrap technique (11). Each set of sinogram data was reconstructed in the manner previously described. The obtained images thus represented 10 statistically independent replicates of the scan.
Data Analysis
All data analysis was performed on a personal computer (Linux operating system [version 2.4.18] installed on a 2.2-GHz Pentium 4 processor [Intel Corp.] with 1 GB of memory). The interactive modeling and data analysis system called BLD (12) (porting to Linux) was used to estimate parameters by the nonlinear least-squares method. Programming for the basis function method was written in C language (version 3.2; GNU Compiler Collection).
Templates of ROIs for the left ventricle and the myocardium were drawn on the blood-pool image with 15O-CO and washout phase of water (average ROI sizes for the 7 pigs were 0.922 ± 0.313 cm3 and 9.80 ± 2.56 cm3 for left ventricle and myocardium, respectively). The templates of the ROIs were superimposed on the dataset for each scan, and tissue activity curves for the left ventricle and the myocardium were generated for each scan. The 4 parameters MBFt, MBFp, α, and Va for the myocardium were estimated by using the 2 tissue activity curves and fitting to Equation 5 by means of the nonlinear least-squares method. Further, the 2 tissue activity curves were used to estimate the arterial input function Ca(t) using Equation 6. To avoid computing the unwanted region (such as liver), we generated a mask image from the washout image by thresholding 50% of the voxel value. The estimated Ca(t) was used for the basis function method, and the parametric images of MBFt, MBFp, perfusable tissue fraction, and Va were generated. Average values of the parameters inside the ROI template for the myocardium were computed for each parametric image, and these values were compared with the estimated parameters using the nonlinear least-squares method.
For the list-mode dataset, from the 10 statistically independent replicates of the images, 10 functional images of MBFt, MBFp, perfusable tissue fraction, and Va by the basis function method were computed. The voxelwise mean image and coefficient-of-variance image were then produced.
To evaluate the computational benefits of the basis function method against the nonlinear least-squares method, we analyzed 1 dynamic image of a pig (under resting condition) in depth. Five hundred voxels were randomly chosen in the heart region, and 500 tissue activity curves were taken from each voxel. Using the input function and the tissue activity curves, we estimated MBFt, MBFp, perfusable tissue fraction, and Va using the nonlinear least-squares method. We also computed the parametric maps for the corresponding voxels using the basis function method. These calculations were repeated 10 times, and the computation times for the 2 methods were compared.
RESULTS
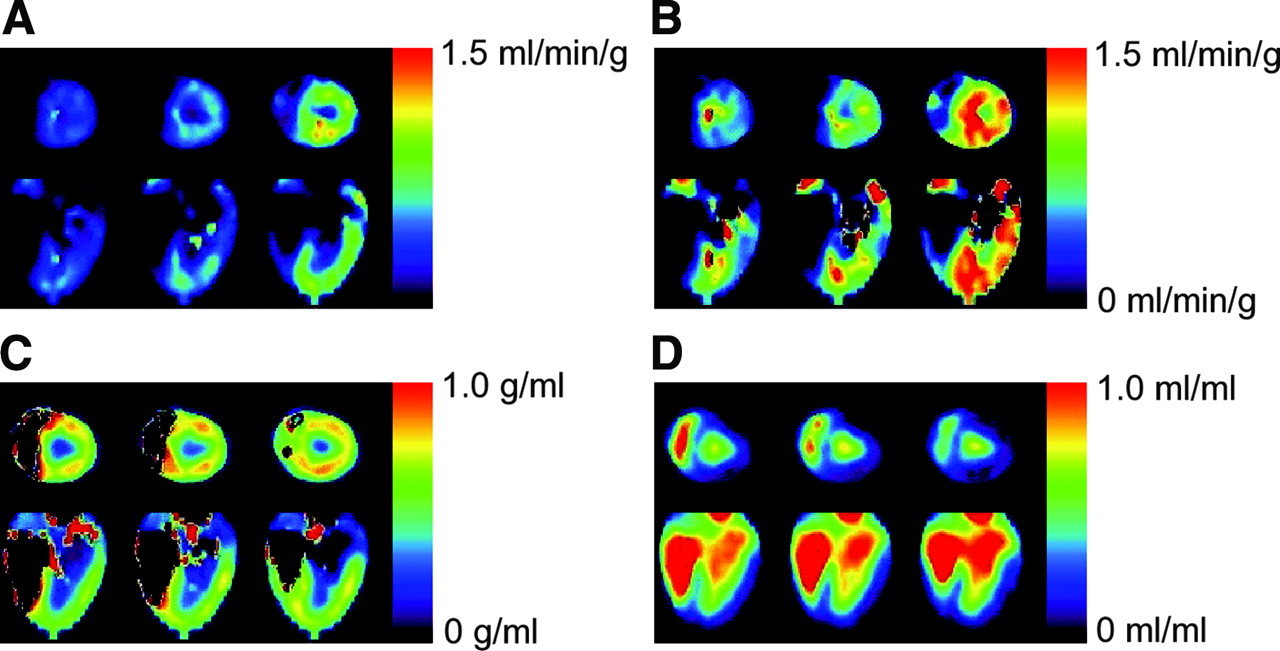
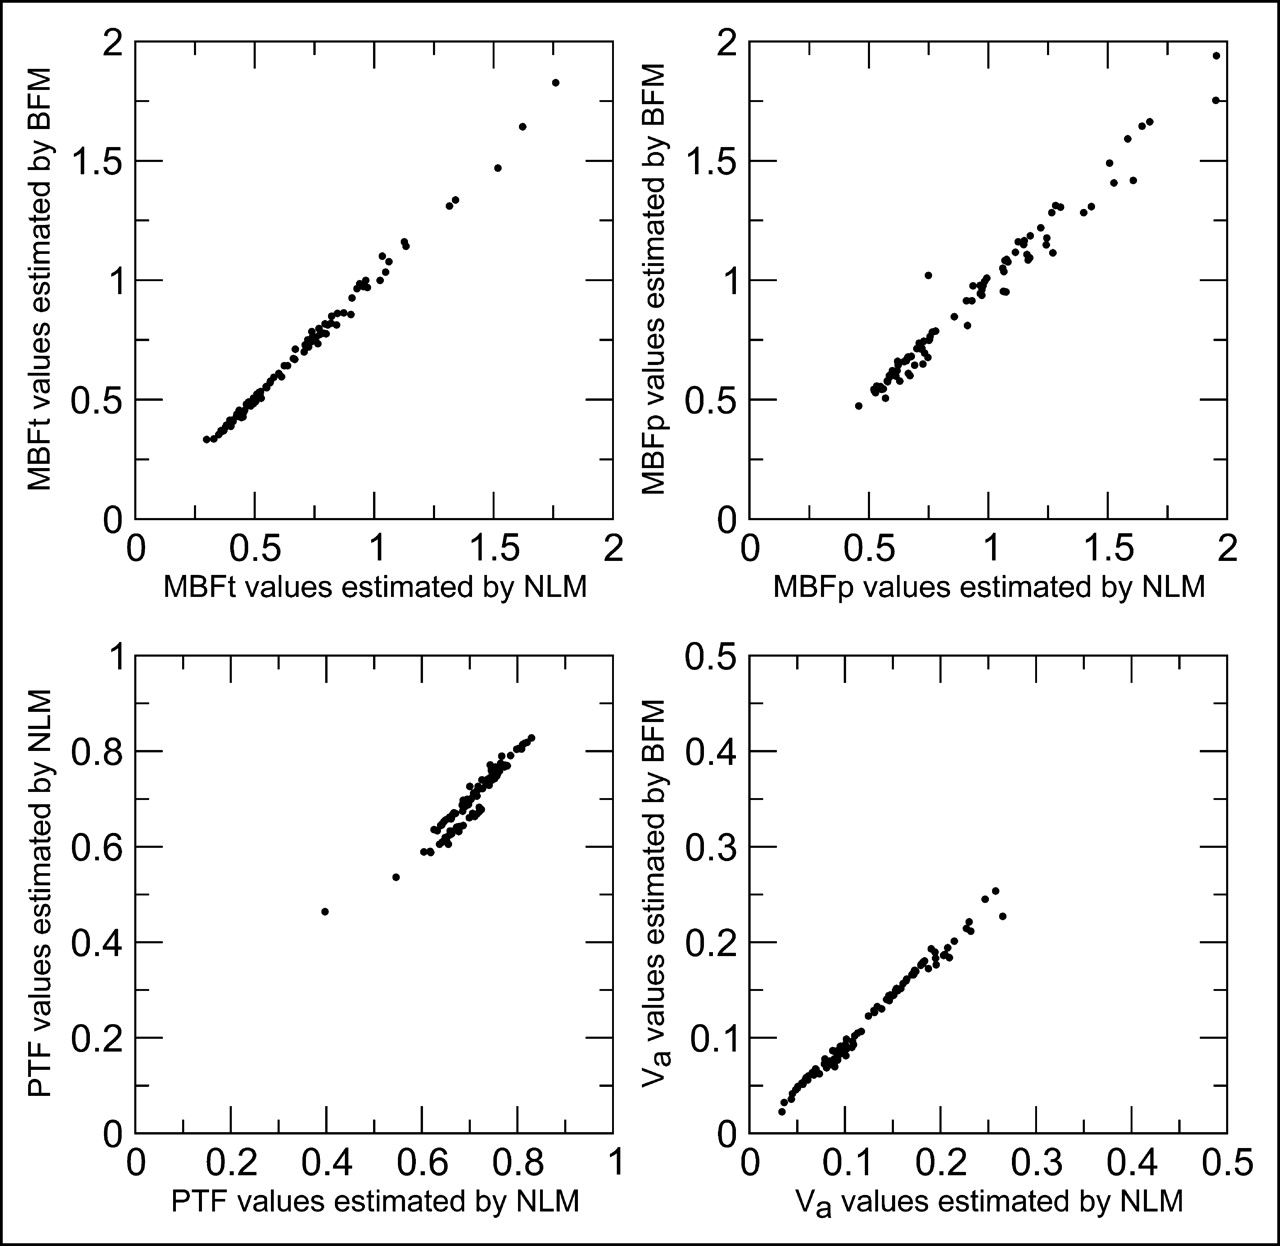
Figure 1 shows examples of parametric images of MBFt, MBFp, perfusable tissue fraction, and Va under resting condition and under a 1 or 5 μg/kg/min dose of CGS-21680. It took about 90 s to produce parametric images of MBFt, MBFp, perfusable tissue fraction, and Va (51,512 voxels for each image). As shown in this figure, MBFt and MBFp images clearly depicted the myocardial region and MBFt, and MBFp values increased as the dose of CGS-21680 increased. On the other hand, perfusable tissue fraction and Va values stayed constant between scans. Figure 2 and Table 1 compare the parameters as estimated by the basis function method and by the nonlinear least-squares method. As shown in this figure, all parameters estimated by the 2 methods correlated strongly.

Examples of parametric images of MBFt (A), MBFp (B), perfusable tissue fraction (C), and Va (D) under resting conditions (left) and under a 1 μg/kg/min (center) or 5 μg/kg/min (right) dose of CGS-21680.

Comparison of MBFt (top left), MBFp (top right), perfusable tissue fraction (bottom left), and Va (bottom right) values estimated using nonlinear least-squares method (NLM) with those estimated using basis function method (BFM).
Parameters Estimated with PET Using the 2 Methods for 7 Miniature Pigs
Figure 3 shows the mean images and coefficient-of-variance images of MBFt, MBFp, perfusable tissue fraction, and Va computed using the basis function method and the nonparametric bootstrap technique. The averaged coefficient-of-variance percentages inside the ROI (3,210 voxels, 10.1 cm3) placed on the myocardium were 14.2%, 16.2%, 5.27%, and 29.9% for MBFt, MBFp, perfusable tissue fraction, and Va, respectively.

Four representative slices of functional images (MBFt, MBFp, perfusable tissue fraction [PTF], and Va) obtained by basis function method (BFM) and nonparametric bootstrap technique. Mean images (left) and coefficient-of-variance images (%COV, right) were generated from 10 statistically independent replicates.
For the nonlinear least-squares method, it took 66.1 ± 4.6 s to compute MBFt, MBFp, perfusable tissue fraction, and Va for the 500 voxels. In 35% of the 500 voxels, the nonlinear least-squares method aborted the estimation before the convergence. The basis function method completed computation of the parametric map for the 500 voxels in 3.4 ± 0.8 s (20 times faster than the nonlinear least-squares method).
DISCUSSION
In this paper, we have presented an approach to producing quantitative MBF and perfusable tissue fraction images using 15O-water and PET. The basis function method has 2 main advantages over the nonlinear least-squares method. One is the ability to produce a voxel-by-voxel quantitative parametric map, and the other is faster computing speed. We are currently studying the use of 15O-water and PET to evaluate skeletal myoblast transplantation for repair of myocardial necrosis in pigs. In these studies, 1 pig is scanned repeatedly under different conditions. For these studies, voxel-by-voxel analysis is preferred to ROI-based analysis because the operator can independently define ROIs to improve reproducibility, and faster computations are important for analyzing plenty of datasets.
Kinetic parameters estimated by the nonlinear least-squares method agreed well with those estimated by the basis function method, as shown in Figure 2. Although superior to the nonlinear least-squares method in terms of computing speed and ability to generate parametric maps, the basis function method shares the same source of errors as the nonlinear least-squares method because they use the same model and assumption. For instance, assumption of a constant value of 0.91 mL/g for the partition coefficient of water might be a problem, especially for diseased tissue. Motion of a patient during a study (13), flow heterogeneity (14), and spillover from the right ventricle (15) are sources of error for parameters estimated by both the nonlinear least-squares method and the basis function method. Using the nonlinear least-squares method, Iida et al. (3) reported that as the noise level increases, the statistical fluctuation and the systematic bias in the estimated parameters increase. This phenomenon could occur in the parameters estimated by the basis function method. To suppress the statistical fluctuation and the systematic bias, one must increase count statistics on each voxel. Although our study, shown in Figure 3, indicates that the statistical fluctuations on the functional images by the basis function method are within an acceptable range, further consideration is required to apply the basis function method to a human study because image quality is worse in studies on humans than in studies on miniature pig. Three-dimensional acquisition is a possible. The analytic model can be modified to improve the accuracy of the basis function method. For instance, Hermansen et al. (15) proposed a model that included spillover from both the left and the right ventricular cavities with 4 parameters. Their approach is easily adapted to the basis function method, although the increased number of estimated parameters (from 3 to 4) might increase the error of the parameters.
Because the basis function method produces voxel-based functional images, quantification errors caused by subject motion might be more severe with this method than with the ROI-based technique. Although several techniques have corrected for subject motion during brain PET (18–20), motion correction during heart PET is still challenging because of the required nonrigid or nonlinear transformation of images.
Voxel-based perfusable tissue index can be calculated using the perfusable tissue fraction image, the basis function method, and the anatomic tissue fraction (21). The perfusable tissue index is theoretically unaffected by partial-volume effects and wall motion and could be a marker of viable myocardium (22). However, using computer simulations, Herrero et al. (14) demonstrated that flow heterogeneity caused the perfusable tissue index to be underestimated. Compared with the ROI-based perfusable tissue index, the voxel-based perfusable tissue index obtained by the basis function method could minimize flow heterogeneity, suppressing the bias on the perfusable tissue index. On the other hand, misalignment between the transmission image, CO image, and water image could produce a significant error in the voxel-based perfusable tissue index. Moreover, Iida et al. pointed out that spillover artifacts on the anatomic tissue fraction produced the error in the perfusable tissue index (13). A detailed comparison between the perfusable tissue index image and the histologic image will be required to investigate the feasibility of the voxel-based perfusable tissue index.
The present method requires the operator to draw the ROI on the left ventricular and myocardial regions to obtain the arterial input function, possibly resulting in an additional source of error. Factor analysis (23) is an attractive approach to decreasing the effect of operator variability. Alternatively, the arterial input function can be obtained from the aortic region (24).
The inverse of the Fisher information matrix (25) can be used to evaluate the noise in the functional images. However, this approach relies on the definition of the compartment model, and the high random and scatter counts in the heart PET study might distort the statistical distribution in the PET image. Thus, we used list-mode acquisition and the nonparametric bootstrap technique to estimate noise.
Compared with a study on miniature pigs, a study on humans would encounter worse problems if the basis function method were applied, because of the deterioration of the raw data (i.e., fewer count statistics and increased photon scatter, random coincidences, and attenuation). New generations of PET detectors (new crystals and faster electronics) are expected to help overcome these problems.
CONCLUSION
The basis function method was implemented to generate parametric images of MBF, perfusable tissue fraction, and blood volume with 15O-water and PET. The method could compute the parametric images much more quickly than could the conventional nonlinear fitting approach. The MBF image and the perfusable tissue fraction image with 15O-water may give additional information on the detection of regional myocardial perfusion abnormalities.
Acknowledgments
This study was supported by the Program for Promotion of Fundamental Studies in Health Science of the Organization for Pharmaceutical Safety and Research (of Japan).
Footnotes
Received Sep. 7, 2004; revision accepted Mar. 17, 2005.
For correspondence or reprints contact: Hiroshi Watabe, PhD, Department of Investigative Radiology, National Cardiovascular Center Research Institute, 5-7-1 Fujishirodai, Suita, Osaka 565-8565.
E-mail: watabe{at}ri.ncvc.go.jp
REFERENCES
In this issue


Jump to section
Related Articles
Cited By...
- Total-Body Quantitative Parametric Imaging of Early Kinetics of 18F-FDG
- Parametric Net Influx Rate Images of 68Ga-DOTATOC and 68Ga-DOTATATE: Quantitative Accuracy and Improved Image Contrast
- Use of a Single 11C-Meta-Hydroxyephedrine Scan for Assessing Flow-Innervation Mismatches in Patients with Ischemic Cardiomyopathy
- In Vivo Visualization of Amyloid Deposits in the Heart with 11C-PIB and PET
- Parametric Images of Myocardial Viability Using a Single 15O-H2O PET/CT Scan
- Quantitative Parametric Perfusion Images Using 15O-Labeled Water and a Clinical PET/CT Scanner: Test-Retest Variability in Lung Cancer
- Low-Dose Quantitative Myocardial Blood Flow Imaging Using 15O-Water and PET Without Attenuation Correction