


Abstract
The purpose of this study was to evaluate myocardial electrocardiography (ECG)-gated 13N-ammonia (13N-NH3) PET for the assessment of cardiac end-diastolic volume (EDV), cardiac end-systolic volume (ESV), left ventricular (LV) myocardial mass (LVMM), and LV ejection fraction (LVEF) with gated 18F-FDG PET as a reference method. Methods: ECG-gated 13N-NH3 and 18F-FDG scans were performed for 27 patients (23 men and 4 women; mean ± SD age, 55 ± 15 y) for the evaluation of myocardial perfusion and viability. For both 13N-NH3 and 18F-FDG studies, a model-based image analysis tool was used to estimate endocardial and epicardial borders of the left ventricle on a set of short-axis images and to calculate values for EDV, ESV, LVEF, and LVMM. Results: The LV volumes determined by 13N-NH3 and 18F-FDG were 108 ± 60 mL and 106 ± 63 mL for ESV and 175 ± 71 mL and 169 ± 73 mL for EDV, respectively. The LVEFs determined by 13N-NH3 and 18F-FDG were 42% ± 13% and 41% ± 13%, respectively. The LVMMs determined by 13N-NH3 and 18F-FDG were 179 ± 40 g and 183 ± 43 g, respectively. All P values were not significant, as determined by paired t tests. A significant correlation was observed between 13N-NH3 imaging and 18F-FDG imaging for the calculation of ESV (r = 0.97, SEE = 14.1, P < 0.0001), EDV (r = 0.98, SEE = 15.4, P < 0.0001), LVEF (r = 0.9, SEE = 5.6, P < 0.0001), and LVMM (r = 0.93, SEE = 15.5, P < 0.0001). Conclusion: Model-based analysis of ECG-gated 13N-NH3 PET images is accurate in determining LV volumes, LVMM, and LVEF. Therefore, ECG-gated 13N-NH3 can be used for the simultaneous assessment of myocardial perfusion, LV geometry, and contractile function.
Scintigraphic assessment of myocardial perfusion, metabolism, and cardiac function is commonly used in patients with proven or suspected cardiac disorders. Electrocardiography (ECG)-gated SPECT is routinely used for the determination of left ventricular (LV) function (1–3). PET with different tracers is a well-established method for the noninvasive assessment of myocardial perfusion and viability. Previously, gated 18F-FDG PET was demonstrated to accurately determine LV volumes and contractile function (4–9). Cardiac 13N-ammonia (13N-NH3) PET is frequently used to assess myocardial blood flow and coronary flow reserve (10–12). However, gated cardiac 13N-NH3 imaging is currently not used for the estimation of LV function. The feasibility of a nearly simultaneous assessment of myocardial perfusion and contractile function through a combination of dynamic and ECG-gated acquisition protocols for 13N-NH3 PET was reported earlier (13).
In a previous study, we used a model-based approach to gated cardiac 18F-FDG imaging, in which the blurring effect in PET images is compensated for by computer-based modeling and estimates of systolic and diastolic cardiac volumes, LV ejection fraction (LVEF), and LV myocardial mass (LVMM) are derived. The accuracy of the results of gated 18F-FDG studies was evaluated with measurements obtained from ECG-gated MRI as a reference method (8). Because the myocardial uptake of 13N-NH3 and the myocardial uptake of 18F-FDG are based on different principles (perfusion vs. metabolism) and because 13N-NH3 images exhibit higher extracardiac activities, it remains undetermined whether a model-based image analysis also can be used for gated 13N-NH3 PET images to derive accurate measurements of cardiac geometry and function.
Thus, it was the purpose of the present study to use model-based image analysis for ECG-gated 13N-NH3 images to assess cardiac end-diastolic volume (EDV), cardiac end-systolic volume (ESV), LVMM, and LVEF and to compare these results with measurements obtained from ECG-gated 18F-FDG images.
MATERIALS AND METHODS
Patient Population
The patient population included 27 patients (23 men and 4 women; mean ± SD age, 55 ± 15 y) who had coronary artery disease and who underwent gated 13N-NH3 and 18F-FDG imaging as part of a 1-d study protocol for the evaluation of myocardial perfusion and viability between September 2001 and April 2005. One patient was excluded from the study because of poor quality of the gated 13N-NH3 images. All patients had a clinical history of myocardial infarction. As determined by visual analysis of PET images, 19 patients had an anterior myocardial infarction (8 small and 11 moderate or large) and 7 patients had an inferior myocardial infarction (3 small and 4 moderate or large). One patient presented with a normal tracer distribution on PET. Nine of the 27 patients (33%) showed a PET perfusion–metabolism mismatch.
PET Imaging
A high-spatial-resolution full-ring dedicated PET scanner (ADVANCE; GE Healthcare) was used to acquire gated images for both 13N-NH3 and 18F-FDG during 8 cardiac phases covering the entire RR interval. After a 1-min scout scan for patient positioning, a 10-min transmission scan was obtained. For 13N-NH3 imaging, after an intravenous injection of 740 MBq of 13N-NH3, a 5-min dynamic acquisition and then a 20-min gated acquisition were performed. For 18F-FDG imaging, patients received a 75-g oral glucose load to enhance myocardial 18F-FDG uptake and to increase the ratio of myocardial activity to background activity. Patients with diabetes were excluded from the glucose load. When the blood sugar level exceeded 140 mg/dL at 40 min after glucose loading, 2–8 IU of insulin were injected intravenously (2 IU for each 20 mg of glucose per deciliter over the level of 140 mg/dL). 18F-FDG at 370 MBq was injected immediately thereafter. At 40 min after 18F-FDG injection, ECG-gated image acquisition was performed for 20 min.
Transaxial gated 13N-NH3 and 18F-FDG images were reconstructed with filtered backprojection by use of a Shepp Logan filter with a cutoff frequency of 0.48 cycle per centimeter, yielding an in-plane image resolution of 10 mm full width at half maximum. The reconstruction matrix was 128 × 128 pixels with a 2-mm pixel size. The short-axis views of both studies were created with GE Healthcare image processing software and were transferred to an image processing workstation (Onyx; Silicon Graphics) for further processing.
Image Analysis
Image analysis was performed with a semiautomated model-based method (8) that estimates endocardial and epicardial borders on a set of short-axis images and derives measurements of systolic and diastolic cardiac volumes. Processing tools and the graphical user interface for gated PET image analysis were developed with Interactive Data Language (IDL) software (CREASO).
The model-based method was based on a mathematic model of a radial activity profile obtained from cardiac short-axis images, incorporating the partial-volume effect, and therefore correcting the blurring effect on cardiac PET images. This model is fully specified by the blurring effect of the PET scanner (full width at half maximum) and 5 parameters that are obtained from cardiac short-axis images: the LV radius, the LV wall thickness, and tracer activities in the blood pool, the myocardium, and the background (8).
For image processing, gated images that showed the smallest and largest LV cavities during a cardiac cycle were selected by visual inspection as end-systolic and end-diastolic frames. In both image sets, the most apical and basal slices were defined to indicate the range of images for further volume calculations. 13N-NH3 and 18F-FDG image sets were analyzed by the same operator on separate days.
A circular region of interest was drawn with its center in the LV cavity of each selected short-axis slice, and 60 profiles then were generated along radial rays from the center of the left ventricle to the boundary of the circular region. Nonlinear regression analysis (14) was applied to fit the observed radial profile to the mathematic model and to obtain estimates for the LV radius and the LV wall thickness. Endocardial and epicardial contours were derived from the estimates of the LV radius and the LV wall thickness (Fig. 1). From these estimated borders, the endocardial and epicardial areas were calculated, and ESV and EDV were obtained by use of Simpson’s rule. From the calculated volumes, global LVEF and LVMM were derived.
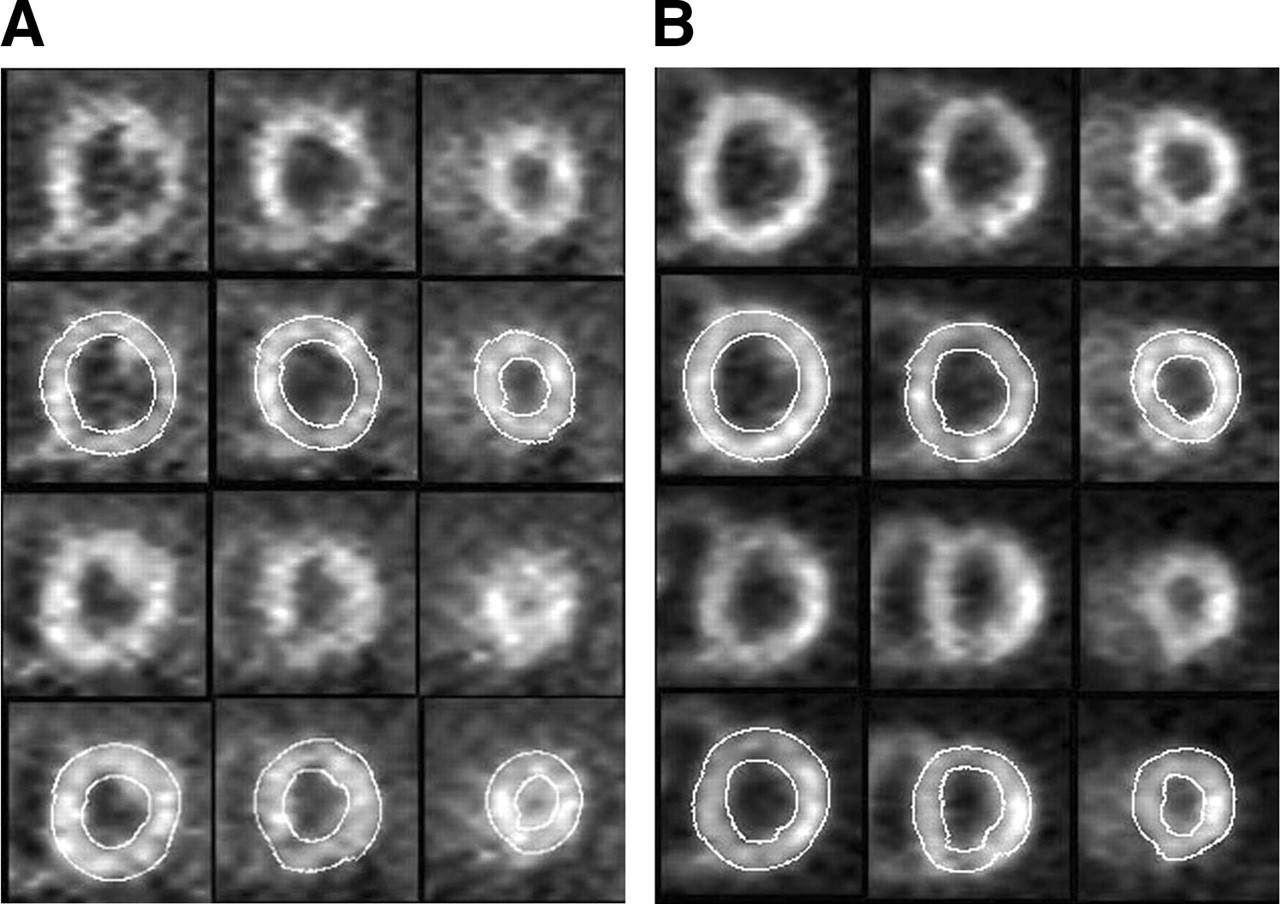
Example of model-based parameter estimation of cardiac geometry. Short-axis images obtained at basal, midventricular, and apical levels (left to right) were derived from 13N-NH3 (A) and 18F-FDG (B) PET studies for end-diastolic (upper 2 rows) and end-systolic (lower 2 rows) time points. Second and fourth rows depict short-axis views with overlays of estimated endocardial and epicardial contours.
Statistical Analysis
Values are expressed as mean ± SD. Group comparisons between 13N-NH3 and 18F-FDG were performed by use of paired t tests. Regression analysis and Bland–Altman analysis (15) were used to elucidate the relationships between measurements from the 2 imaging methods. A P value of <0.05 was considered to indicate statistical significance.
RESULTS
Calculated LV volumes determined by 13N-NH3 and 18F-FDG were 108 ± 60 mL and 106 ± 63 mL, respectively, at end systole and 175 ± 71 mL and 169 ± 73 mL, respectively, at end diastole. The LVEFs determined by 13N-NH3 and 18F-FDG were 42% ± 13% and 41% ± 13%, respectively. The LVMMs determined by 13N-NH3 and 18F-FDG were 179 ± 40 g and 183 ± 43 g, respectively. The difference between measurements from the 2 imaging methods was not significant, as determined by paired t tests (Table 1).
ESV, EDV, LVEF, and LVMM Determined from 13N-NH3 and 18F-FDG Images*
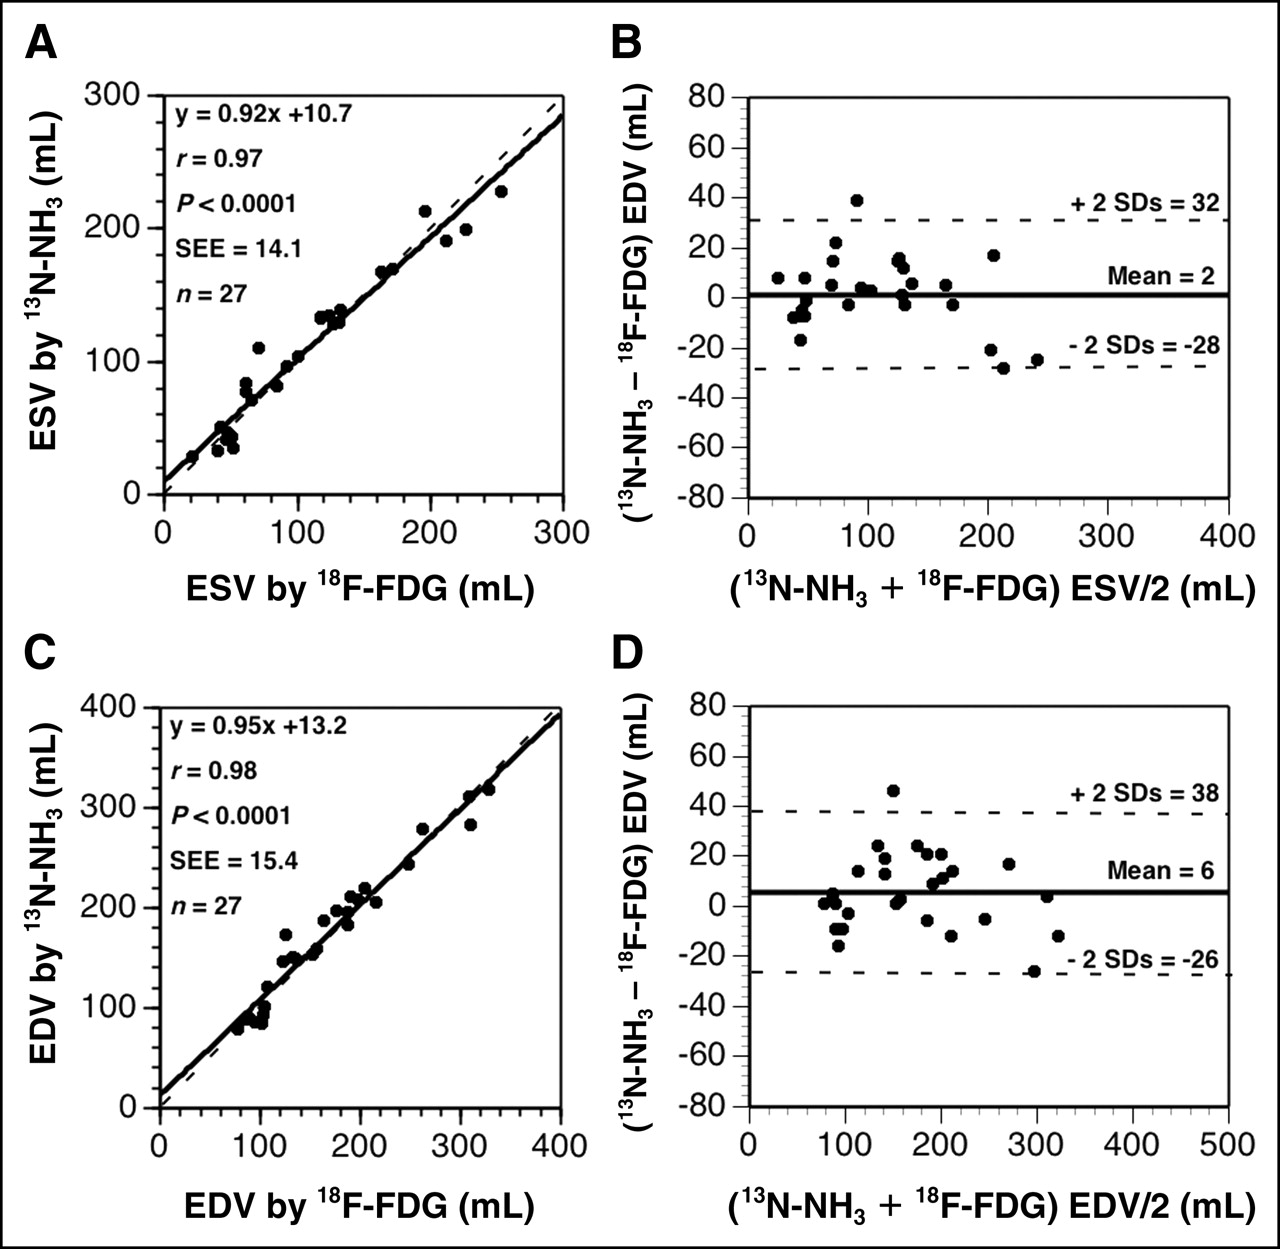
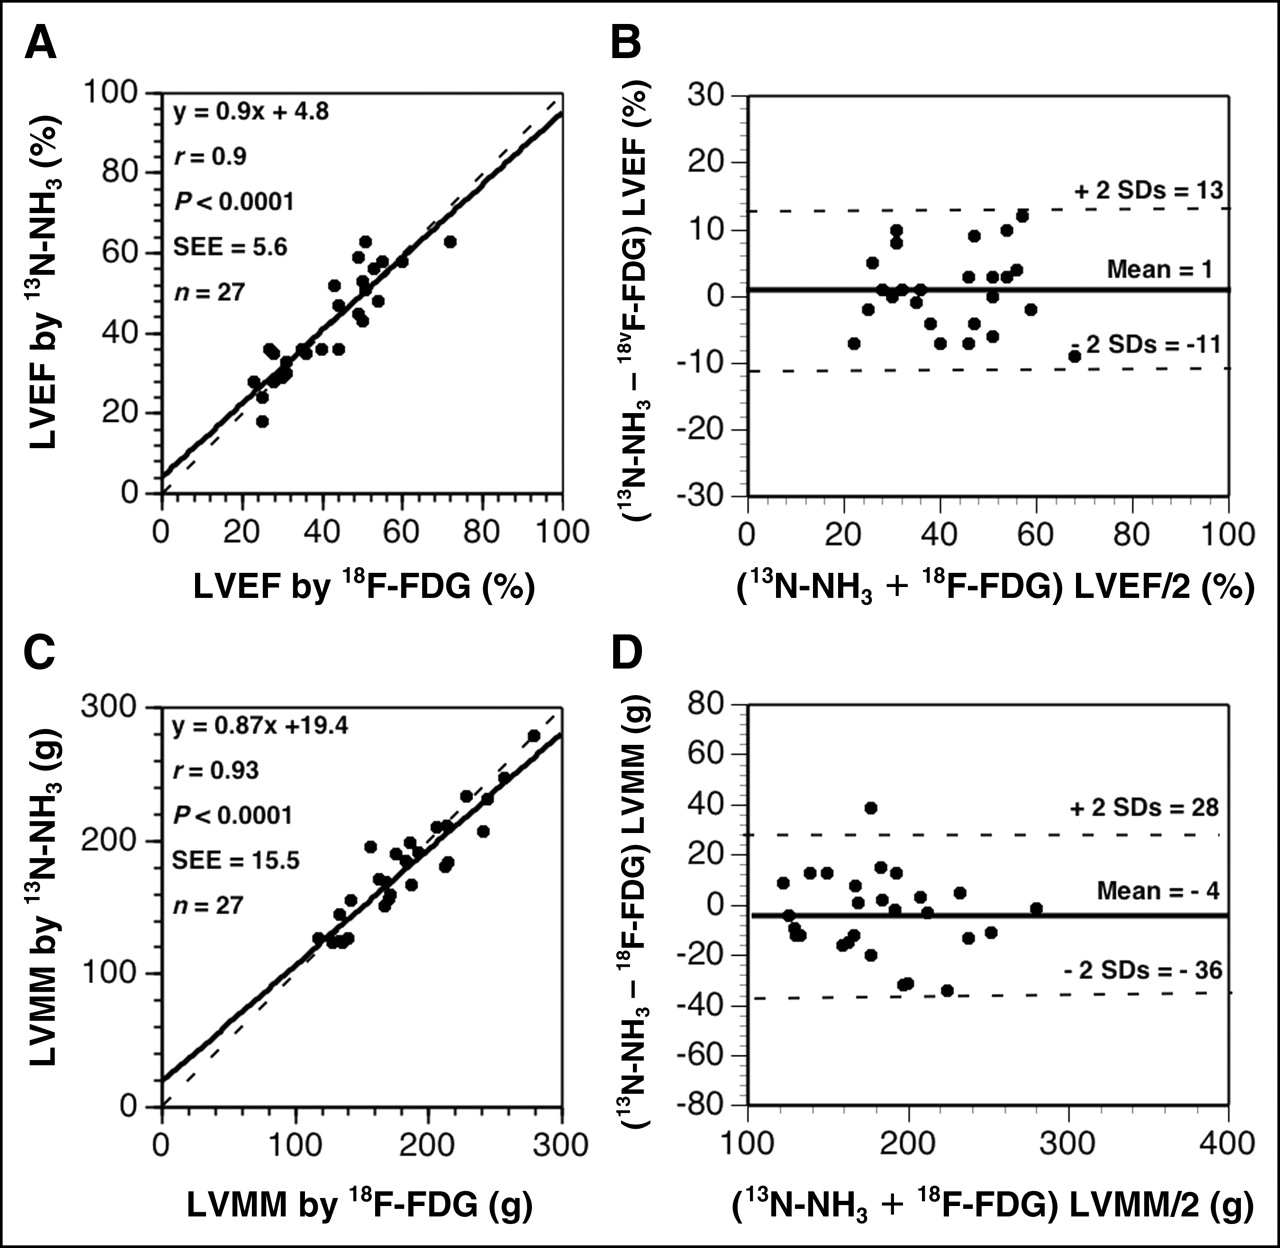
A significant correlation was observed between 13N-NH3 and 18F-FDG studies for the calculation of ESV (ESV determined by 13N-NH3 = 0.92ESV determined by 18F-FDG + 10.7; r = 0.97, SEE = 14.1, P < 0.0001) (Fig. 2A), EDV (EDV determined by 13N-NH3 = 0.95EDV determined by 18F-FDG + 13.2; r = 0.98, SEE = 15.4, P < 0.0001) (Fig. 2C), LVEF (LVEF determined by 13N-NH3 = 0.9LVEF determined by 18F-FDG + 4.8; r = 0.9, SEE = 5.6, P < 0.0001) (Fig. 3A), and LVMM (LVMM determined by 13N-NH3 = 0.87LVMM determined by 18F-FDG + 19.4; r = 0.93, SEE = 15.5, P < 0.0001) (Fig. 3C).

Regression analysis and Bland–Altman plots of ESV (A and B) and EDV (C and D) determined from 13N-NH3 and 18F-FDG PET images. Dashed lines in A and C are lines of identity (13N-NH3 value equals 18F-FDG value). Mean differences and 95% confidence limits (±2 SDs) in B and D are represented by solid and dashed lines, respectively.

Regression analysis and Bland–Altman plots of LVEF (A and B) and LVMM (C and D) determined from 13N-NH3 and 18F-FDG PET images. Dashed lines in A and C are lines of identity (13N-NH3 value equals 18F-FDG value). Mean differences and 95% confidence limits (±2 SDs) in B and D are represented by solid and dashed lines, respectively.
Bland–Altman analysis (Figs. 2B, 2D, 3B, and 3D) showed an excellent concordance between 13N-NH3 and 18F-FDG data; 13N-NH3 yielded slightly higher values for volumes (2 ± 15 mL for ESV and 6 ± 16 mL for EDV) and LVEF (1% ± 6%) but slightly lower values for LVMM (−4 ± 16 g).
Measurements of LVEF obtained for subgroups of patients with a small perfusion defect (47% ± 12% by 13N-NH3 vs. 46% ± 13% by 18F-FDG) and with a moderate or large perfusion defect (38% ± 15% by 13N-NH3 vs. 38% ± 11% by 18F-FDG) showed no significant difference between the 2 imaging methods. Moreover, when measurements of LVEF were compared for subgroups of patients with a perfusion–metabolism match (37% ± 11% by 13N-NH3 vs. 37% ± 11% by 18F-FDG) or a perfusion–metabolism mismatch (52% ± 11% by 13N-NH3 vs. 50% ± 9% by 18F-FDG), no significant difference between measurements obtained by 13N-NH3 and those obtained by 18F-FDG was found.
DISCUSSION
In this study, we compared ECG-gated 13N-NH3 and 18F-FDG PET for the assessment of LV volumes, LVEF, and LVMM in patients with coronary artery disease. The results demonstrated excellent agreement between measurements from the 2 imaging methods. A direct comparison between 13N-NH3 and 18F-FDG by Bland–Altman analysis showed excellent concordance between the estimates of LV volumes, LVEF, and LVMM obtained by the 2 methods.
For both gated 13N-NH3 and 18F-FDG studies, we used a semiautomated model-based method that had been evaluated for gated 18F-FDG in a previous study with measurements obtained from ECG-gated MRI as a reference method (8). That study showed that analysis of gated 18F-FDG PET images with a model-based method yields measurements of LVEF, ESV, EDV, and LVMM similar to those derived from MRI. Other investigators evaluated ECG-gated 18F-FDG PET with different image processing tools and radionuclide angiography (4,7), left ventriculography (5), or MRI (6,9) as a reference method and demonstrated that gated 18F-FDG imaging is an accurate method for assessing LV volumes and contractile function.
In clinical practice, 13N-NH3 is an established method for the quantitative imaging of myocardial blood flow at rest and under stress conditions and for measuring coronary flow reserve to evaluate the significance of coronary artery stenoses (16) as well as to detect microvascular disease (17). In addition, quantification of global LV function and its changes from rest to stress provides important prognostic information in coronary artery disease. In comparison, MRI is considered the reference method for the determination of ventricular geometry and is used in clinical practice to assess myocardial viability by imaging of delayed contrast enhancement (18–20). However, in contrast to PET, MRI currently cannot provide reliable and accurate quantification of myocardial blood flow and cannot be used for patients with implanted devices, such as pacemakers or automatic defibrillators.
Simultaneous assessment of ventricular function and myocardial blood flow in the same imaging study is already in clinical use in myocardial perfusion SPECT and has been shown to offer important information beyond that provided by perfusion imaging alone. In fact, reduced LVEF increases the risk of cardiac death irrespective of the perfusion data, and the addition of ESV data further increases the diagnostic potential of gated SPECT (21). Although myocardial perfusion determined by SPECT is an established method that is performed frequently when ischemic cardiomyopathy is suspected, the inability of myocardial SPECT to quantify blood flow assigns PET a unique role in the assessment of ischemic cardiomyopathy. Thus, the capability of dynamic and ECG-gated 13N-NH3 PET for the nearly simultaneous quantitative assessment of myocardial perfusion, coronary flow reserve, and contractile function should provide important information for patient management and risk stratification.
Okazawa et al. demonstrated the feasibility of assessing perfusion and function by using a single dose of 13N-NH3 in a group of healthy volunteers and in patients with cardiovascular disease (13). In that study, the calculated LVEF was compared with blood-pool imaging by C15O PET and left ventriculography; good agreement among these methods was found for patients with normal perfusion, whereas an underestimation of LVEF was found for patients with perfusion defects.
The reliability of estimation of endocardial and epicardial borders of the myocardium and calculation of LV volumes by model-based methods and by other methods based on myocardial tracer activity strongly depends on the quality of ECG-gated images. Acquisition of high-quality ECG-gated images requires a stable and regular cardiac rhythm throughout the entire acquisition period, a requirement that may not be fulfilled in patients with heartbeat irregularities, such as atrial fibrillation or multiple extrasystoles.
In studies with limited image quality or with segments with reduced tracer uptake, contour interpolation was used to estimate the LV radius and the LV wall thickness. This method leads to acceptable results for small defects and for larger regions with reduced tracer uptake. However, estimation of endocardial and epicardial borders in studies with large defects in tracer uptake leads to unreliable results (8). In particular, image quality is of major relevance for the estimation of wall thickness. Decreased regional count activity and segmental interpolation may result in incorrect estimates of regional wall thickness and LVMM. However, global parameters of LV function, such as calculation of LV volumes or LVEF, can be assessed accurately, as these parameters are less affected by low image quality or large defects in tracer uptake.
CONCLUSION
In conclusion, LV volumes, LVMM, and contractile function can be accurately measured from ECG-gated cardiac 13N-NH3 images by use of a model-based analysis technique to determine endocardial and epicardial borders. Cardiac 13N-NH3 PET with static, dynamic, and ECG-gated image acquisition thus offers a nearly simultaneous assessment of myocardial perfusion and contractile function.
Acknowledgments
The authors thank the technologists of the PET Center of the Department of Nuclear Medicine for their technical assistance in performing the cardiac PET studies. This work was partly supported by a research grant provided by the Verein zur Förderung der Wissenschaftlichen Forschung am Rudolfinerhaus.
Footnotes
Received Jul. 15, 2005; revision accepted Sep. 14, 2005.
For correspondence or reprints contact: Aliasghar Khorsand, PhD, Department of Cardiology, Medical University of Vienna, Waehringer Guertel 18-20, A1090 Vienna, Austria.
E-mail: aliasghar.khorsand{at}meduniwien.ac.at
REFERENCES
In this issue


Jump to section
Related Articles
Cited By...
- Measurement of LV Volumes and Function Using Oxygen-15 Water-Gated PET and Comparison With CMR Imaging
- Cardiac PET: A Versatile, Quantitative Measurement Tool for Heart Failure Management
- Comparison of Measures of Left Ventricular Function from Electrocardiographically Gated 82Rb PET with Contrast-Enhanced CT Ventriculography: A Hybrid PET/CT Analysis