


Abstract
Because of the ultrashort tracer half-life and high positron energy of 82Rb, PET images acquired with this tracer are noisier and of lower resolution than those obtained with other PET tracers. The validity of electrocardiographic gating using 82Rb for assessment of left ventricular (LV) function is not well established. To support feasibility, we compared functional parameters from gated 82Rb PET with simultaneous high-resolution contrast-enhanced CT ventriculography, obtained as a byproduct a CT coronary angiography during hybrid cardiac PET/CT. Methods: A total of 24 patients underwent PET/CT, consisting of rest and dipyridamole 82Rb perfusion studies and contrast-enhanced CT angiography, using a 64-slice scanner, for the workup of coronary artery disease. From gated PET images, LV ejection fraction (EF), end-diastolic volume (EDV), and end-systolic volume (ESV) were calculated using 2 commercial products. For functional CT analysis, commercial software using endocardial contour detection was applied. Results: Inter- and intraobserver agreement was good for all methods. On CT, EF was 66% ± 13%, ESV was 41 ± 29 mL, and EDV was 115 ± 36 mL. On PET, EF during dipyridamole was 56% ± 15% and 52% ± 15% using the 2 commercial products (P < 0.05 vs. CT), ESV was 36 ± 28 and 47 ± 35 mL (P = not significant vs. CT), and EDV was 75 ± 30 and 91 ± 33 mL (P < 0.05 vs. CT). Correlations with CT were 0.85 and 0.87 for EF using commercial software, 0.76 and 0.88 for ESV, and 0.60 and 0.68 for EDV (P < 0.01 for all). Bland–Altman analysis confirmed systematic underestimation of EF and EDV by PET versus CT but did not show a significant deviation from linearity. Conclusion: Global LV function can be measured reproducibly from gated 82Rb PET, using different available software products. However, underestimation of EF by 82Rb PET, compared with CT ventriculography, is present, which is a result of underestimation of EDV from count-poor ED frames. This underestimation needs to be considered for clinical interpretation of 82Rb PET.
Myocardial perfusion PET with 82Rb is increasingly used because it provides improved diagnostic quality, certainty, and accuracy over conventional SPECT (1–4). The prognostic value in predicting adverse cardiac outcomes has also been demonstrated in an increasing number of studies (5–7). Current PET systems allow for routine electrocardiograph-gated acquisition, which may provide incremental value to perfusion. Functional parameters from gated PET have been validated against several independent measures (nuclear imaging, echocardiography, cardiac MRI, and contrast ventriculography) for both the metabolic tracer 18F-FDG and the perfusion tracer 13N-ammonia (8–10). These validation studies, however, cannot necessarily be extrapolated to gated 82Rb datasets. 82Rb PET images have fewer counts because of the ultrashort half-life of the tracer, and they have lower spatial resolution because of the high positron energy of 82Rb. Some recent studies have suggested that the functional response to vasodilator stress can be identified with rest–stress 82Rb PET as an additional diagnostic parameter in the assessment of coronary artery disease (CAD) (11,12), but those studies using gated 82Rb PET did not include independent functional reference techniques.
The new generation of PET/CT systems, which combine PET with multislice CT, provide a unique opportunity for validation of gated 82Rb PET data. In patients who receive contrast-enhanced CT angiography in addition to PET perfusion imaging, CT can be used as an almost simultaneously acquired reference technique to validate gated PET. Helical CT angiography, performed with retrospective gating, has been shown to provide accurate measures of left ventricular (LV) volumes and ejection fraction (EF) at high spatial resolution (13–15), and it has been successfully compared with gated SPECT (16).
We sought to make use of this opportunity and compared functional parameters derived from 82Rb cardiac PET with those from retrospectively gated contrast-enhanced CT angiography, obtained during the same PET/CT session.
MATERIALS AND METHODS
Patients and Study Design
Data were compiled from 24 consecutive patients (mean age ± SD, 54 ± 12 y; 13 male and 11 female), who were referred clinically for combined PET/CT assessment of coronary morphology and myocardial perfusion because of chest pain and suspected hemodynamically relevant CAD. Cardiovascular risk factors were distributed as follows (n, percentage): history of CAD (3, 13%), known prior infarction (3, 13%), hypertension (12, 50%), diabetes (3, 13%), dyslipidemia (8, 33%), smoking (12, 50%), family history of premature CAD (8, 33%). Patients with arrhythmia, or contraindications to radiographic contrast or dipyridamole stress, were excluded.
The retrospective analysis of clinical cardiac PET/CT for this project was granted exempt status by the Johns Hopkins Institutional Review Board.
PET/CT Acquisition
PET.
All patients fasted for more than 4 h before testing. Abstinence from caffeine for more than 12 h and from theophylline-containing medications or vasodilators for more than 24 h was required. Patients were imaged using a Discovery STRx PET/CT system (GE Healthcare), equipped with an integrated lutetium yttrium orthosilicate (LYSO)-crystal PET component and a 64-slice CT component. Perfusion PET constituted the first part of the PET/CT session. A large intravenous line (20 gauge) was placed in an antecubital vein before imaging in all patients, and appropriate history and informed consent were secured. Individuals were then positioned with the help of a CT topogram, and a low-dose CT scan (120 kV, 40 mA) for attenuation correction of PET emission data was performed during shallow breathing. Then, 1,480–1,850 MBq (40–50 mCi) of 82Rb-chloride were infused intravenously from a strontium–rubidium generator as a slow bolus over 30 s, and a 2-dimensional list-mode PET scan was performed over 8 min. After rest acquisition, infusion of dipyridamole was started (0.56 mg/kg, 4 min). A second dose of 1,480–1,850 MBq (40–50 mCi) of 82Rb-chloride was infused 4 min after the end of dipyridamole, followed by an 8-min 2-dimensional list-mode acquisition. The rest and stress PET data were checked for accurate alignment with the low-dose CT scan, and software-based realignment was performed for attenuation correction if necessary (17). List-mode data were resampled to static (90-s prescan delay) and gated (8 bins for the cardiac cycle) images (11). To counteract the effects of dipyridamole, aminophylline (100–150 mg) was given at the end of PET. None of the patients showed significant ST-segment depressions suggestive of ischemia during and after dipyridamole stress.
Contrast-Enhanced CT.
The CT part of the study was initiated immediately after the end of PET. To reduce heart rate below a target of 65 beats/min, patients were premedicated with oral metoprolol (50–100 mg, 30 min before the start of PET/CT). CT acquisition was started with a localizer scan to determine start and end positions. For optimal timing of contrast delivery, a test bolus acquisition with repeated imaging of the aortic root after injection of 20 mL (5 mL/s) of intravenous contrast (Visipaque; GE Healthcare), followed by a 20-mL saline chaser, was performed. Then, 0.2 g of nitroglycerin was given sublingually for coronary vasodilation, and helical CT angiography was performed, to cover the area from below the tracheal bifurcation to the diaphragm (70 mL of contrast at 5 mL/s, followed by a 50-mL saline chaser; rotation time, 0.35 s; 0.625-mm slice thickness; pitch, 0.2–0.24, set automatically dependent on heart rate; 120 kV; amperage modulated with a maximum of 600–800 mA during 60%–85% phase and a minimum of 400 mA).
Data Analysis
PET.
Attenuation-corrected PET images were reconstructed by an iterative algorithm (ordered-subset expectation maximization, 2 iterations, 21 subsets), with postprocessing filtering (Butterworth, order 10; cutoff, 0.25 cycles/bin). Two commercially available software products, the QGS package (Cedars-Sinai) and the CardIQ Physio package (GE Healthcare), were used for further analysis of electrocardiograph-gated datasets. Two independent observers, unaware of prior clinical interpretation, performed analysis. This analysis included oblique reorientation, definition of valve plane, quality control of automated contour detection, and software-derived calculation of LV end-diastolic volume (EDV), end-systolic volume (ESV), and EF from rest and stress datasets. One reader repeated the analysis to determine intraobserver variability. In addition to global function, regional wall motion was visually scored (0, normal; 1, hypokinetic; 2, akinetic; and 3, dyskinetic) for 5 wall segments (apical, lateral, anterior, septal, and inferior) by a single reader.
Contrast-Enhanced CT.
Volumetric, retrospectively gated CT datasets were reconstructed with different phase delays to cover the whole cardiac cycle in 10 sets of images (5%–95% phase, steps of 10%). Those datasets were uploaded into commercially available CardIQ express analysis software, and volumetric functional analysis was performed by 2 independent observers. Volumetric functional analysis included definition of cardiac long axis and valve planes, density-based automated detection of LV cavity and endocardial contours (without papillary muscles), and quality control of EDV and ESV as defined by the segmentation algorithm of the software. Figure 1 shows representative gated PET and CT images. LV EDV, ESV, and EF were calculated. One reader repeated the analysis to calculate intraobserver variability. In a manner similar to how PET regional wall motion was derived, regional contractile function was determined visually from reangulated cine images using a wall motion score (0, normal; 1, hypokinetic; 2, akinetic; and 3, dyskinetic) for 5 wall segments (apical, lateral, anterior, septal, and inferior) by a single reader.
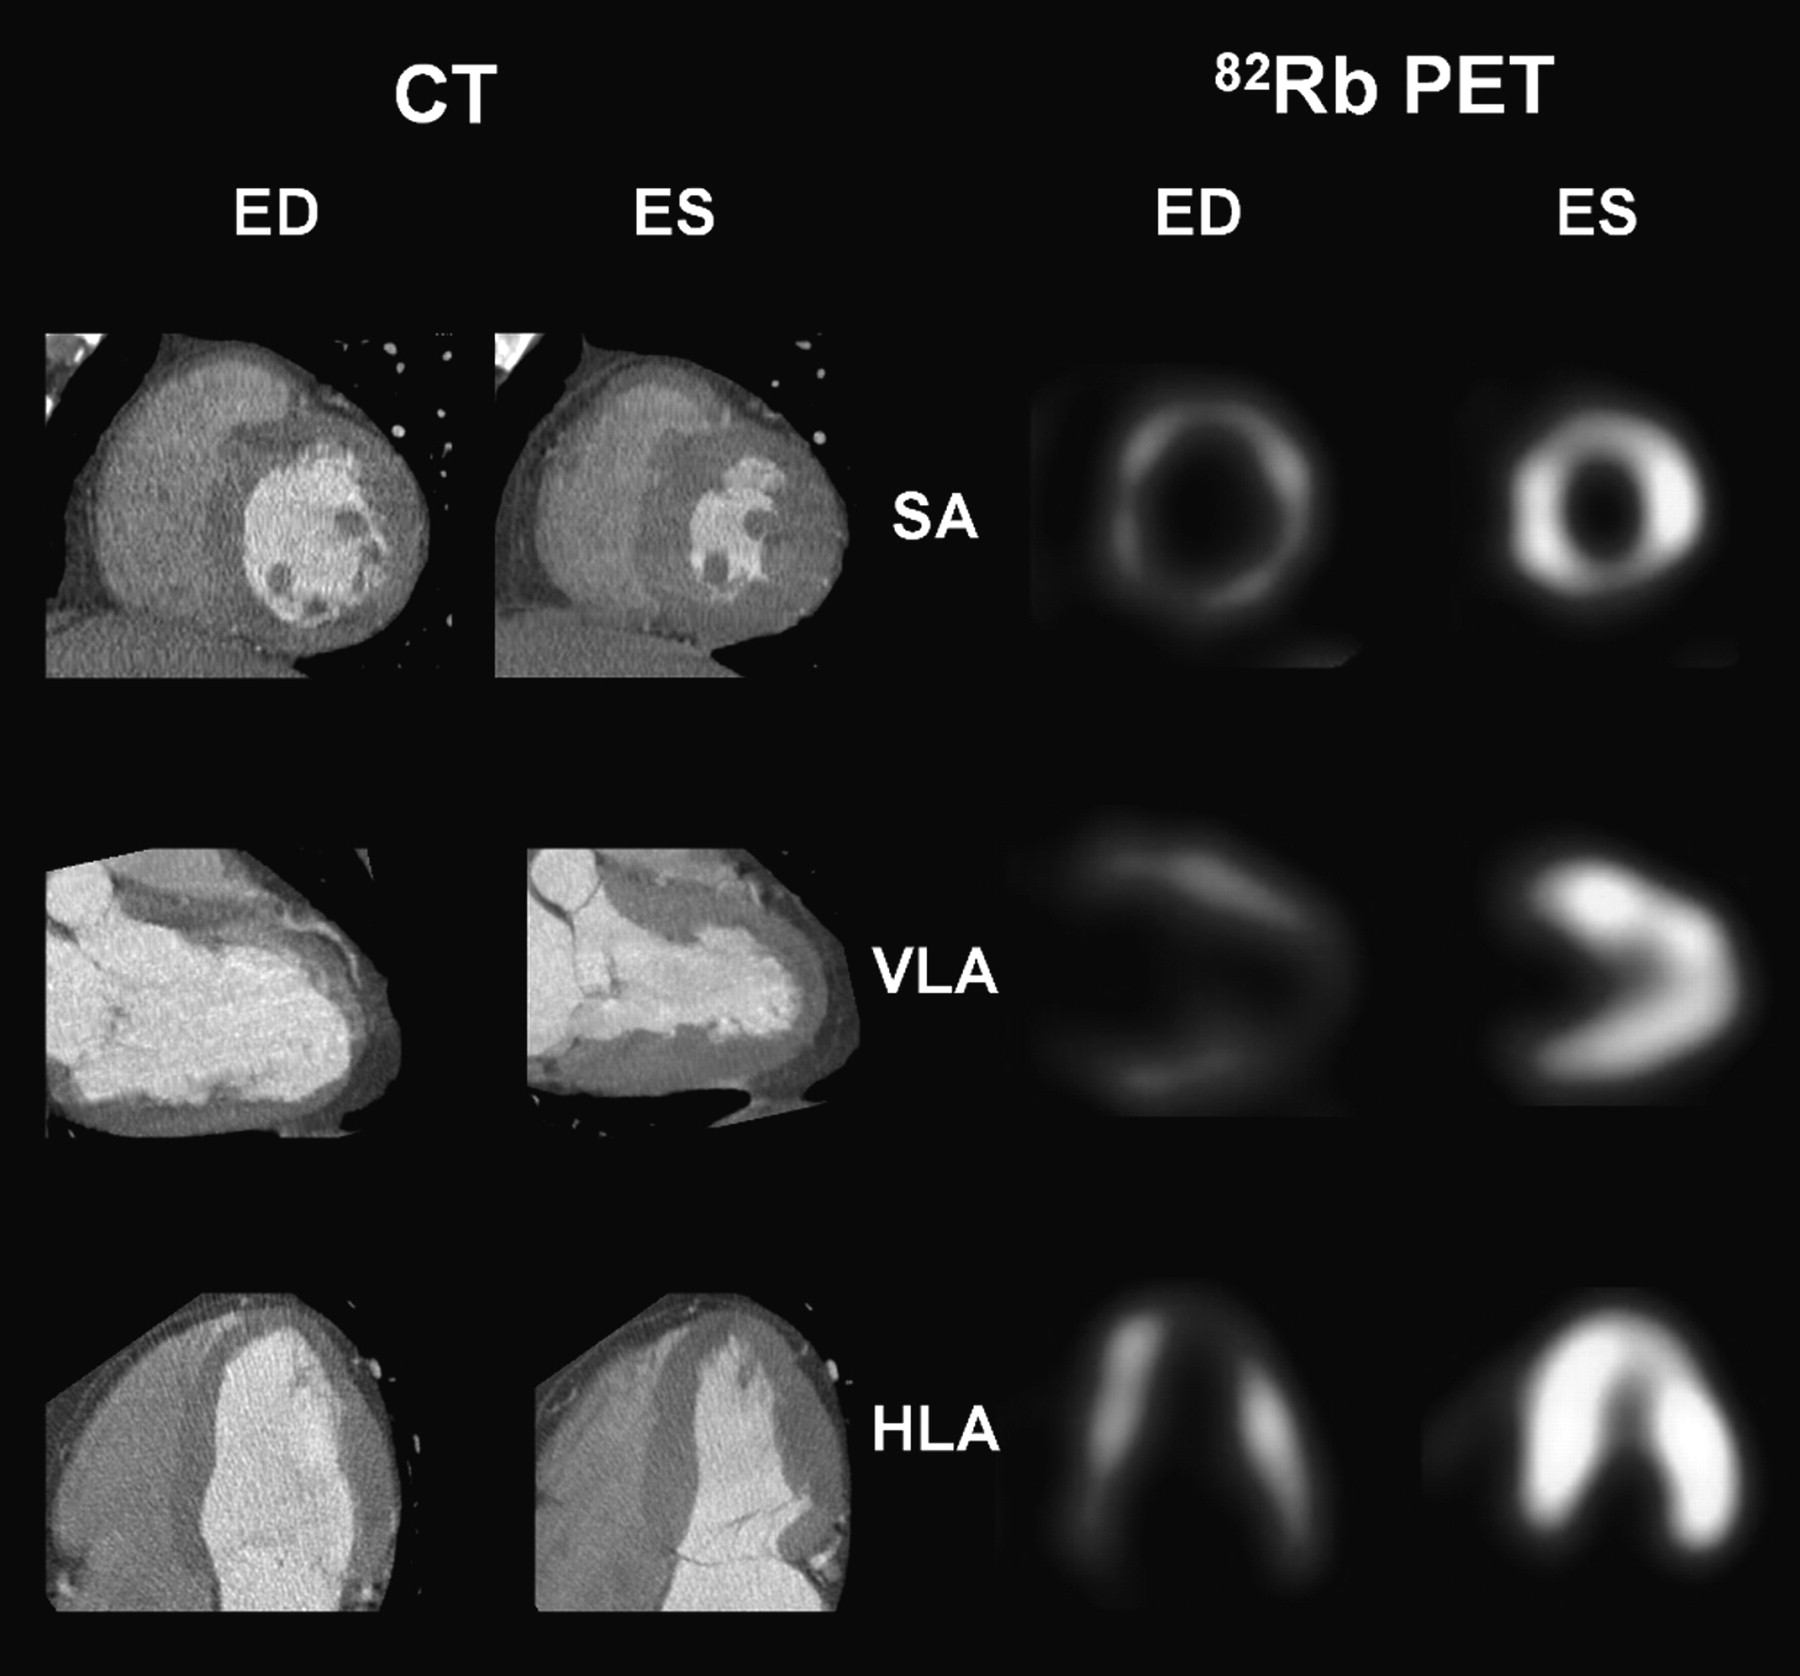
Representative reangulated images of contrast-enhanced CT ventriculography and gated 82Rb PET images at end-diastole (ED) and end-systole (ES). SA = short axis; VLA = vertical long axis; HLA = horizontal long axis.
Statistical Analysis
Data are presented as mean ± SD. The Med-Calc statistical software package (version 9.3.0.0; Mariakerke) was used. Two-tailed, paired t tests were used to assess differences between continuous variables. Pearson correlation coefficients were calculated with Fisher r-to-z conversion to determine significance, and Bland–Altman analysis was used to define the relationship between PET and CT parameters. Passing–Bablok regression analysis and cumulative sum were used for measuring deviation from linearity. For characterization of inter- and intraobserver variability, coefficients of variability (SD of the difference between 2 measurements over the mean of the 2 measurements, expressed as percentage) were determined. A result of P less than 0.05 was used to define statistical significance.
RESULTS
Clinical Perfusion PET and CT Angiography Results
Perfusion PET results were obtained from prior clinical reports and were classified as normal (n = 18, 75%), reversible defect/ischemia (n = 3, 12.5%), or fixed defect/infarction (n = 3, 12.5%).
Clinical reports classified CT angiography results as normal (n = 11, 45%), nonobstructive atherosclerosis (n = 10, 42%), or obstructive atherosclerosis (n = 3, 13%; obstructive was defined as luminal stenosis of 50% or more by visual judgment).
Of the 3 patients with obstructive atherosclerosis on CT, 2 had severe perfusion abnormalities (1 fixed defect, 1 reversible defect), and 1 had no perfusion abnormalities. Of the 6 patients with PET perfusion abnormalities, 2 had obstructive atherosclerosis; 2 had a history of reperfusion therapy for prior myocardial infarction and had a fixed perfusion defect associated with nonobstructive atherosclerosis; 1 had several coronary segments in the artery supplying the perfusion defect, which were technically not evaluable on CT angiography; and 1 was judged to have nonobstructive atherosclerosis on CT despite the presence of a perfusion defect.
CT Measures of LV Function
CT-derived volumes and EFs are summarized in Table 1. EDV ranged from 64 to 203 mL, ESV from 11 to 144 mL, and EF from 29% to 85%. Regional wall motion abnormalities were observed in only 3 patients (2 with large fixed perfusion defects and 1 with nonischemic dilated cardiomyopathy and left bundle branch block).
Measures of Global LV Function
PET Measures of LV Function
Global LV volumes and EFs are summarized in Table 1. Average EF increased from rest to stress (P < 0.01), as a consequence of an increase of EDV (P < 0.01) but not ESV (P = not significant), but rest and stress values for EF, ESV, and EDV generally correlated well for both PET analysis techniques (r > 0.9 for CardIQ Physio and r > 0.8 for QGS). Regional wall motion abnormalities were observed concordantly at stress, in the same 3 patients as on CT. No significant differences were observed between men and women, except for EDV at rest, which was significantly higher in men (P < 0.05).
Agreement of measures from both sets of PET analysis software was excellent at stress, with significant Pearson correlation coefficients of r = 0.97 for EF, r = 0.89 for ESV, and r = 0.87 for EDV, respectively. At rest, correlation between both PET techniques was somewhat lower but still good, with r = 0.87 for EF, r = 0.89 for ESV, and r = 0.83 for EDV. A statistically significant overestimation of ESV and EDV and underestimation of EF was seen with QGS versus CardIQ Physio (Table 1). Bland–Altman analysis confirmed a systematically higher EF by CardIQ Physio at stress and rest and wider limits of agreement at rest, but Passing–Bablock regression confirmed no deviation from linearity (Fig. 2).
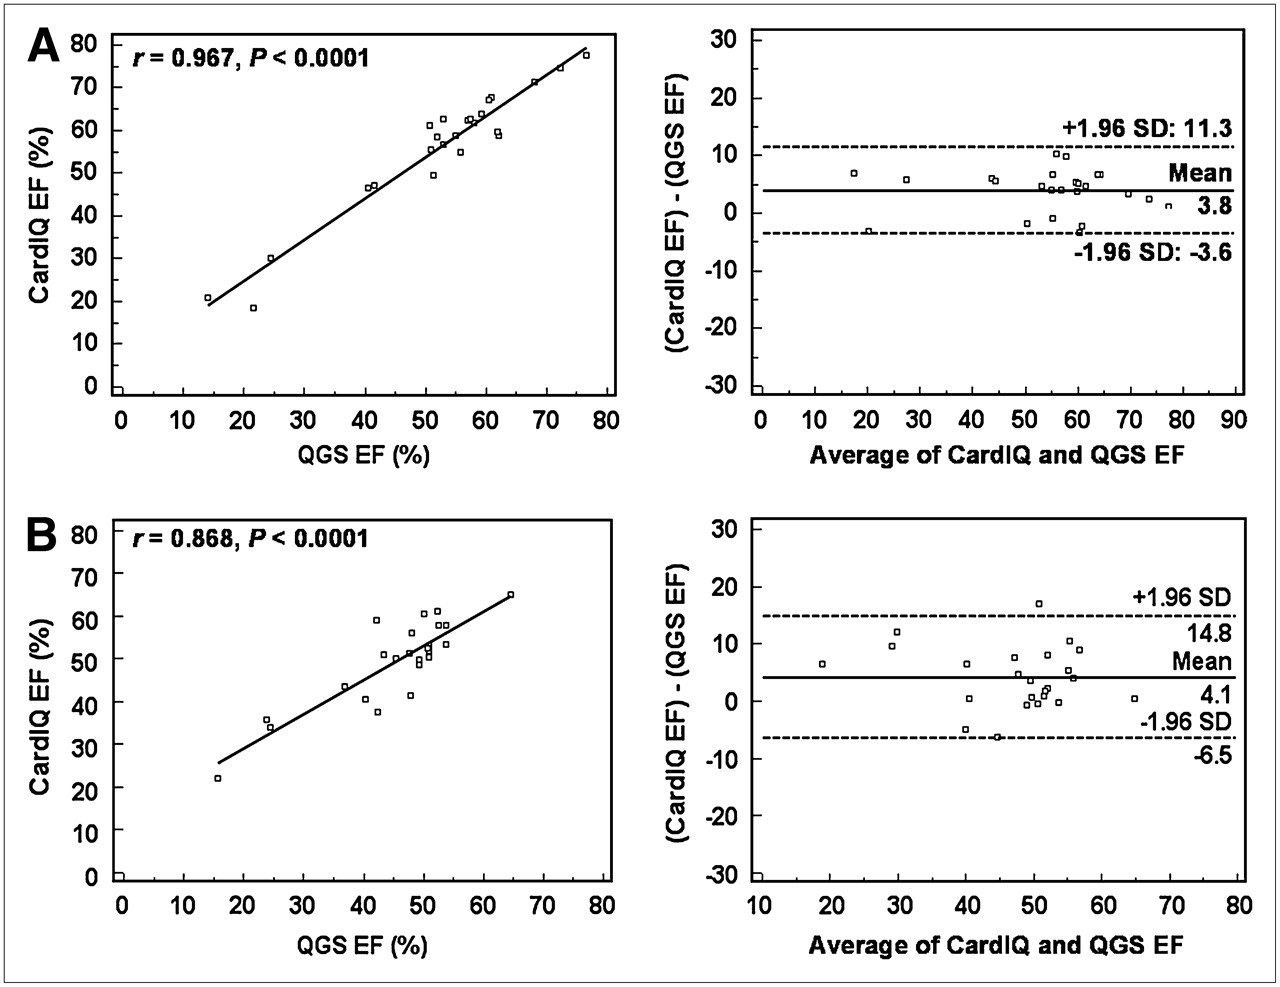
Linear regression plots and Bland–Altman plots for EF measurements by both PET techniques, CardIQ Physio and Cedars-Sinai QGS, during vasodilation (A) and at rest (B).
Comparison of PET and CT
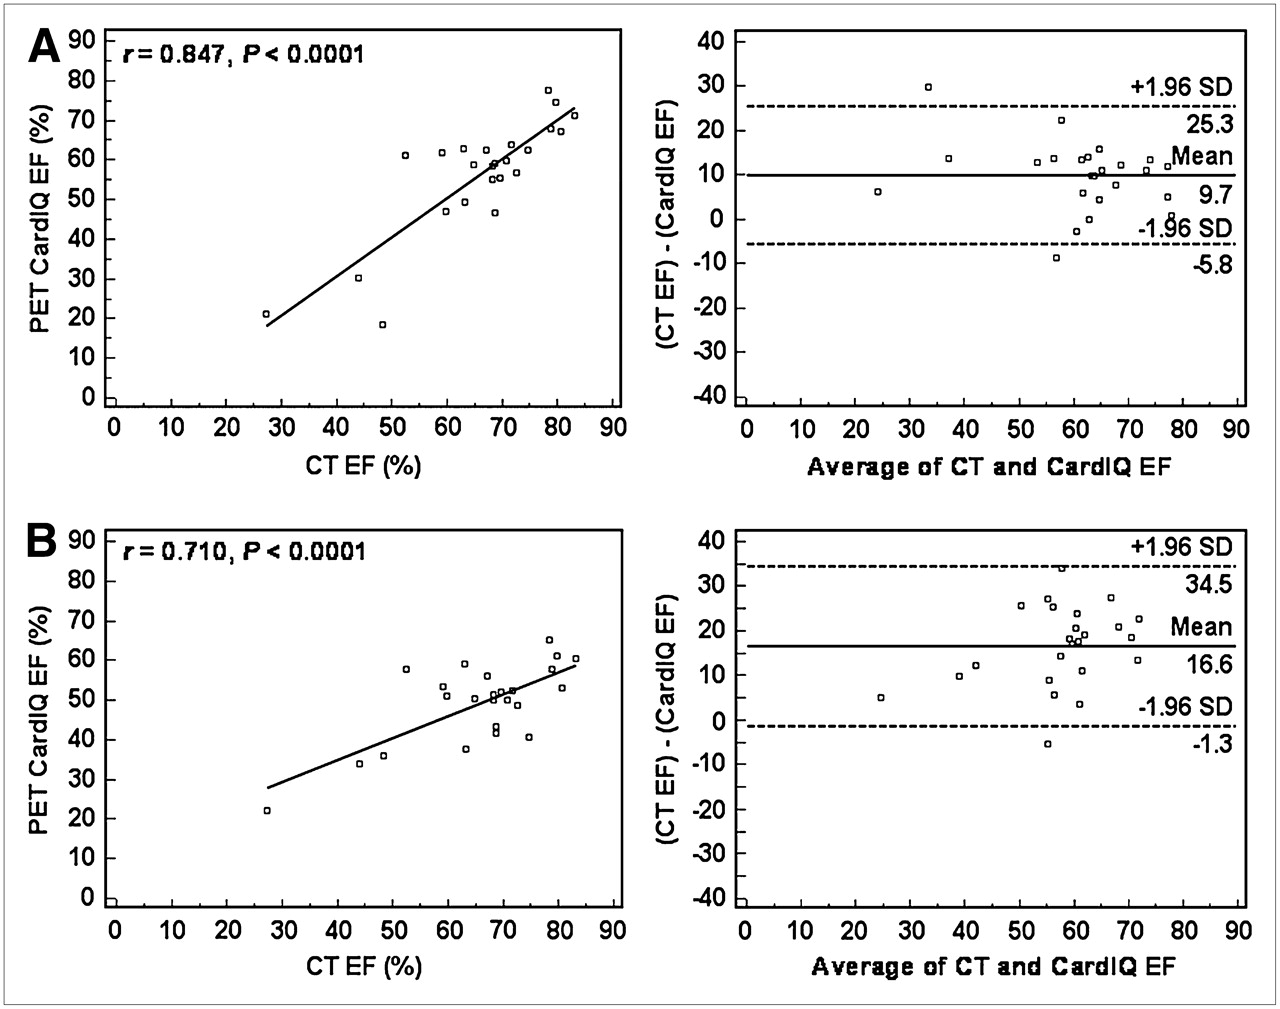
Figures 3 and 4 show linear regression and Bland–Altman plots for EF at stress and rest from both PET techniques versus CT. EF from PET correlated significantly with CT, using stress (r = 0.87 and r = 0.85 for QGS and CardIQ Physio, respectively) and, to a somewhat lesser degree, also rest measures (r = 0.77 and r = 0.71 for QGS and CardIQ Physio, respectively). Bland–Altman analysis showed systematic underestimation of EF by PET (mean deviation for QGS, 13.6% ± 7.4% at stress and 20.7% ± 8.3% at rest; mean deviation for CardIQ, 9.7% ± 7.9% at stress and 16.6% ± 9.1% at rest), but Passing–Bablock analysis showed no significant deviation from linearity. Limits of agreement for EF were generally narrower for stress PET than for rest PET.
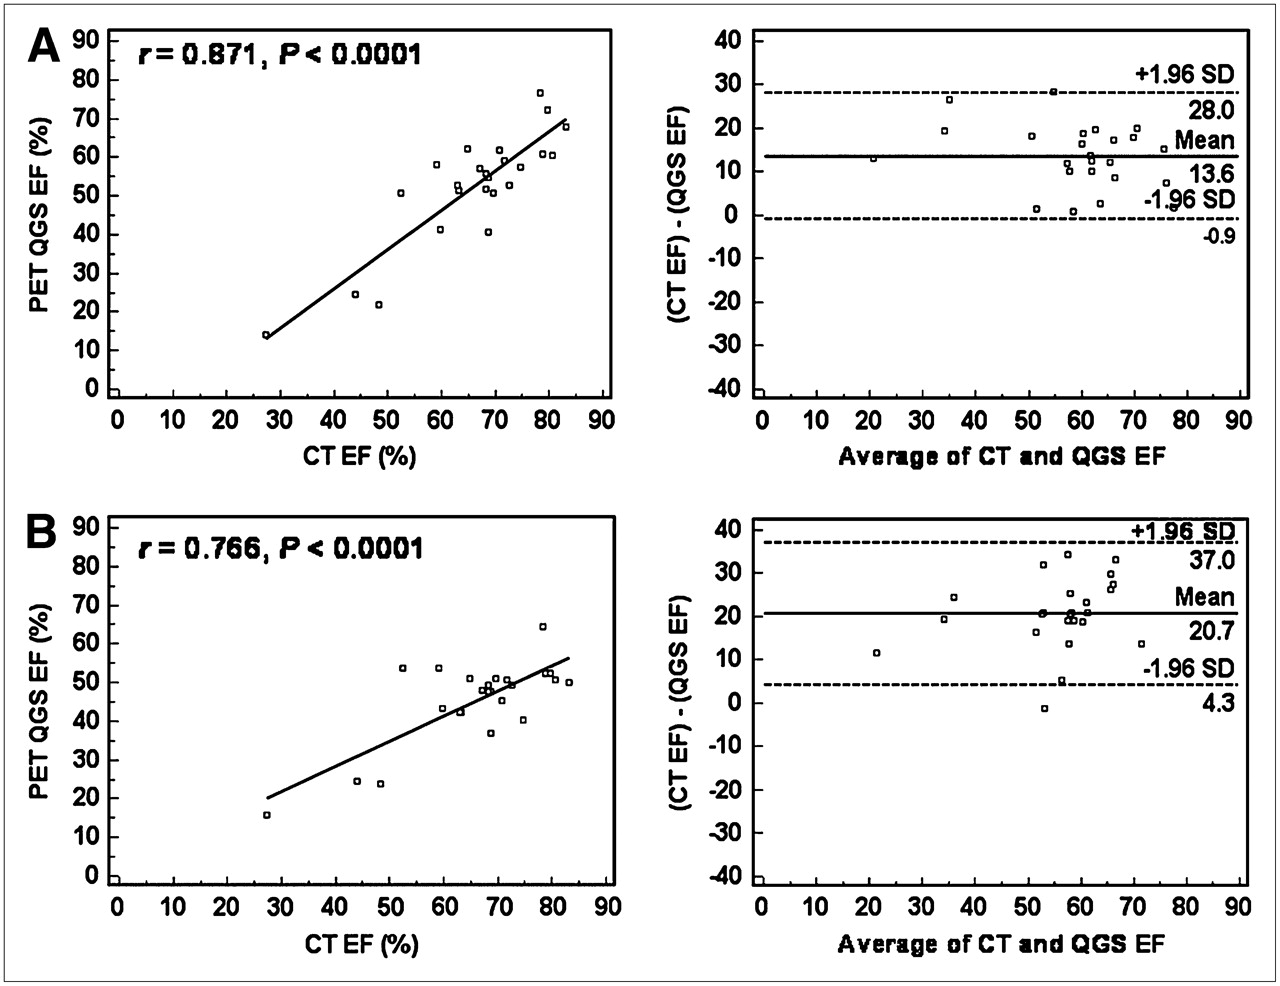
Linear regression plots and Bland–Altman plots for EF measurements by QGS (PET) and CT ventriculography for PET during vasodilation (A) and for PET at rest (B).

Linear regression plots and Bland–Altman plots for EF measurements by CardIQ Physio (PET) and CT ventriculography for PET during vasodilation (A) and for PET at rest (B).
Figure 5 shows representative regression plots for volumes from CT and PET. ESV from PET also correlated significantly with CT, for both PET techniques using stress (r = 0.88 and r = 0.76 for QGS and CardIQ Physio, respectively) and rest measures (r = 0.90 and r = 0.93). Bland–Altman analysis showed agreement. Mean deviation for QGS was −6.2 ± 16.3 mL at stress and −6.1 ± 14.0 mL at rest; mean deviation for CardIQ was 5.4 ± 19.7 mL at stress and 9.1 ± 11.4 mL at rest. Passing–Bablock analysis showed no significant deviation from linearity.
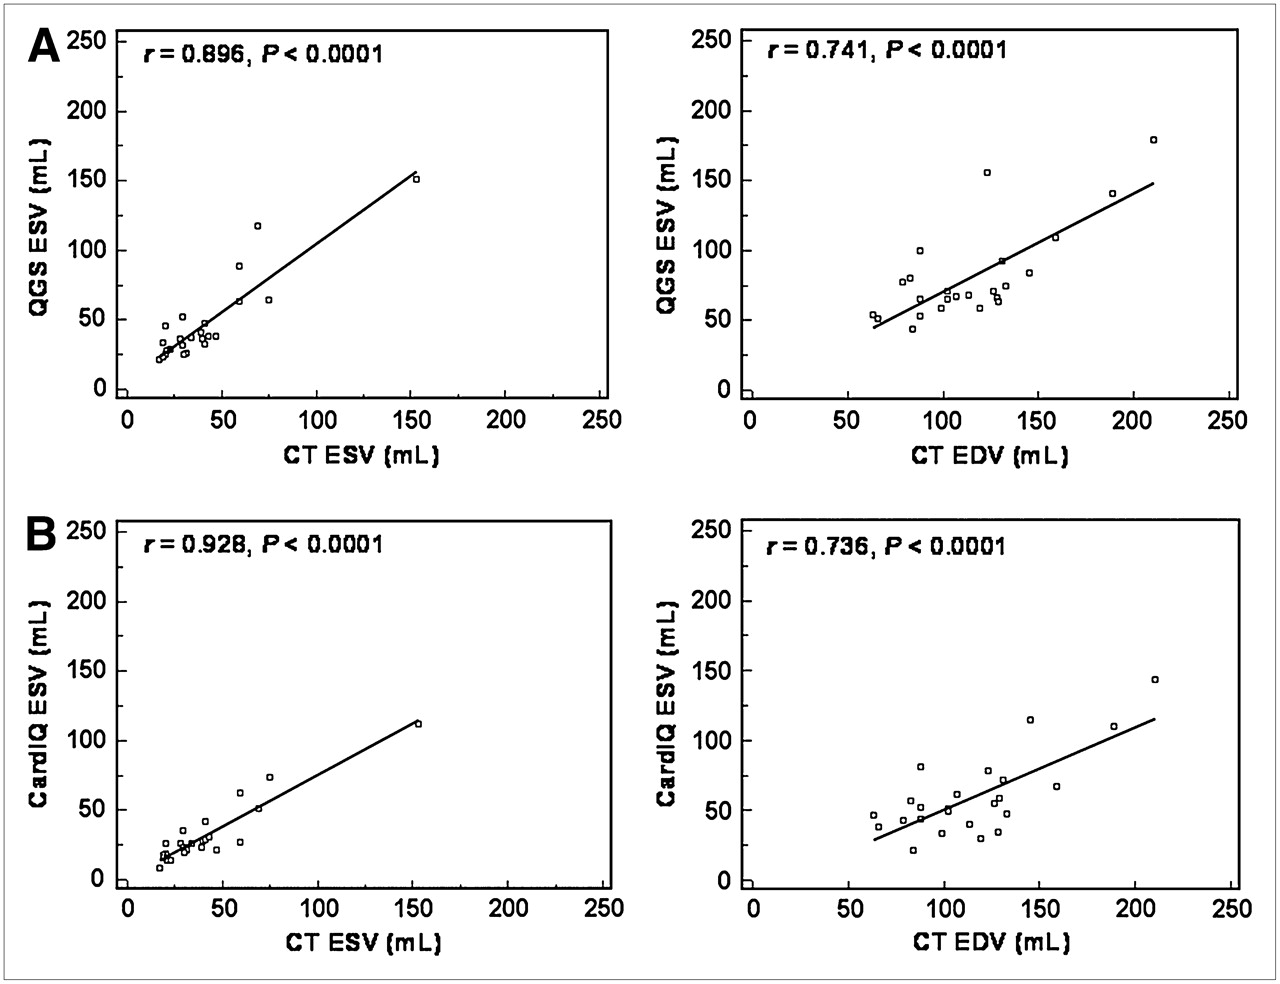
Linear regression plots for ESV and EDV at rest by both PET techniques, QGS (A) and CardIQ Physio (B), vs. by CT ventriculography.
Finally, EDV showed significant, but somewhat lower, agreement with CT using stress (r = 0.69 and r = 0.60 for QGS and CardIQ Physio, respectively) and rest measures (r = 0.74 and r = 0.74). Bland–Altman analysis showed systematic underestimation of EDV by PET (mean deviation for QGS was 23.4 ± 27.6 mL at stress and 33.5 ± 25.2 mL at rest; mean deviation for CardIQ was 40.3 ± 30.2 mL at stress and 55.2 ± 24.4 mL at rest), but Passing–Bablock analysis showed no significant deviation from linearity.
Reproducibility of Functional Measurements
Interobserver agreement for EF, ESV, and EDV by both PET techniques and CT was excellent. Pearson correlation coefficients were above 0.9 and statistically significant for all measurements, except for rest EF by PET using CardIQ Physio (r = 0.81). Coefficients of variability were below 10% for all measurements.
Intraobserver agreement was also excellent. Pearson correlation coefficients were above 0.9 and significant for all measurements. Coefficients of variability were below 10% for all measurements, except for ESV at stress with QGS (10.6%).
DISCUSSION
Our study shows that functional parameters from gated 82Rb PET are robust, because measurements at rest and stress and measurements with different software packages generally correlated well and because observer agreement was excellent. Comparison with CT ventriculography, as obtained during the same PET/CT session, also yielded excellent correlation. The comparison, however, also showed that values for EDV and EF are systematically lower with PET, suggesting that functional data from PET and CT cannot be used interchangeably. These findings have important implications for clinical interpretation of gated 82Rb PET functional data.
First, our study supports the reliability of functional measurements from gated 82Rb PET. The usefulness of gated PET has been shown using other tracers and additional software packages (8,10,18,19), but our study is the first, to our knowledge, to compare gated data from 82Rb with an independent reference method. Our data also further support the usefulness of repeated functional measurements from 82Rb injections at rest and during vasodilation, to determine functional reserve. An impaired functional response to pharmacologic vasodilation during myocardial perfusion PET has previously been shown to be associated with the presence of ischemia and has been proposed as a useful additional diagnostic tool in the assessment of the presence and severity of CAD (11,12). Our study showed consistently lower EFs for 82Rb PET than did contrast-enhanced CT. This is not relevant for the aforementioned approach of determining functional reserve by PET, where rest and stress EF are determined by the same technique, but it is highly relevant for comparison of 82Rb PET–derived functional data with those measured by other techniques. Our study suggests that these cannot be used interchangeably. Establishment of reference values for gated 82Rb PET results from individuals with a low likelihood of coronary disease is thus highly desirable to improve clinical interpretation in the future. The patients included in this study mostly had an intermediate likelihood of disease, which is why they were not suitable for creating reference values.
There may be several reasons for the observed underestimation of EDV and EF by 82Rb PET. Because of an ultrashort tracer half-life of 78 s, 82Rb studies are generally count-poor when compared with PET studies using other tracers (20). The rejection of bad beats during resampling of gated datasets may additionally contribute to count poverty. Sampling to more than 8 gates is not practical for 82Rb, because of low counts, and it is known that a smaller number of gates generally contributes to underestimation of EF (21). Because of more pronounced partial-volume effects due to a thinner wall, end-diastolic images are usually noisier and more heterogeneous (22). It is likely that this noise, a reduced contrast versus blood pool in the LV cavity, and impaired contour detection all contributed to an underestimation of EDV, which in turn resulted in underestimation of EF. ESV is expected to be less influenced because walls are thickened and counting rates are higher. Other results of our study are in line with the hypothesis of an adverse effect of count poverty on functional measurements, including less correlation of EDV versus ESV in PET versus CT; fewer good correlations; and wider margins of agreement for gated PET and CT and between gated PET analysis techniques at rest (where flow is low and myocardial counts are, thus, fewer) versus vasodilation. Finally, contour-detection algorithms differ between PET and CT and may contribute to inclusion of less volume of the outflow tract by definition of a different valve plane for PET versus CT (where spatial resolution is much higher and membraneous parts of the septum and valves are visualized). Papillary muscles were excluded from volume measurements at CT, during which they are easily visualized, but they were not visualized and thus not excluded at PET. Nevertheless, volumes on CT were larger. The difference in handling the papillary muscles, therefore, cannot serve as an explanation for volume differences.
Contrast-enhanced cardiac CT was used as a reference method in this study to validate measures from gated 82Rb PET. Measures of LV function were obtained as a byproduct of helical CT coronary angiography, which was acquired in addition to PET during the same PET/CT session. Retrospective electrocardiographic gating of helical CT data allows for image reconstruction in any phase of the cardiac cycle. Thus, end-systolic and end-diastolic images can be produced to assess ventricular volumes and function using the high spatial resolution of CT. Despite lower temporal resolution than MRI, the ability of CT ventriculography to assess EF and volumes is preserved. For the assessment of cardiac function, CT has been shown to be in agreement with echocardiography, cineventriculography, SPECT, and MRI (13–16,23). These prior studies mostly showed no significant differences for EF between CT and other techniques. CT can, therefore, be considered as a useful reference technique for evaluation of gated PET. Comparison and cross-validation may be especially important because new trends in CT angiography have led to the establishment of prospective gating algorithms that allow for drastic reduction of radiation exposure (24,25). This establishment of prospective gating algorithms will result in a more liberal inclusion of CT angiography in cardiac PET/CT protocols, but because acquisition is prospectively limited to 1 phase of the cardiac cycle, CT will not be able to measure LV function anymore. PET functional data can then be used to substitute for CT functional data in the PET/CT environment.
Two different software algorithms for gated PET analysis were tested in our study. QGS is a software package originally developed for SPECT, but it has been used successfully for gated 18F-FDG PET analysis, in which it was validated against MRI (10), and it has been used for analysis of gated 82Rb studies (11) but has not been validated against an independent technique. CardIQ Physio is recently introduced software that has been developed by the camera manufacturer specifically for use with PET. Our results show that volumes with QGS are generally higher, and EF is lower. The differences were not of the same magnitude as the differences between both PET techniques and CT. They are probably explained by inherent differences in algorithms for contour detection or definition and definition of the valve plane. Our observation suggests that both PET techniques are best not used interchangeably. In the clinical setting, it is preferable to use only 1 technique for all measurements.
Although the almost simultaneous acquisition of 82Rb PET and CT as the reference technique within a single PET/CT session can be seen as a strength of our report, some limitations should be considered.
First, it should be emphasized that 3 of 4 of our patients had a normal PET scan, and few had a low EF. Our results may therefore not necessarily hold for individuals with large perfusion defects (in whom contour detection in PET is more challenging) and for individuals with heart failure (in whom slow blood-pool clearance may complicate contour detection). The patient population in our study was relatively small and mostly limited to individuals with an intermediate pretest likelihood, in whom combination of CT angiography and PET perfusion imaging was considered to be most useful. Prospectively gated CT angiography, which is likely to become the new acquisition standard (24,25), will minimize the availability of individuals with helical CT for a PET/CT comparison study of LV function in the future.
Second, our PET/CT scanner was equipped with LYSO crystals, which have improved count performance over older bismuth germinate systems (26). This improvement may be especially relevant for 82Rb studies, in which high activities are encountered over a short time. Results from this study, thus, may not necessarily be applied to other scanner systems with inferior count statistics, in which gated 82Rb may be less accurate.
Finally, multiple drugs were used as part of the study protocol, which may all theoretically influence loading conditions and thus LV function between the PET and CT measurements. We obtained gated PET at rest and during pharmacologic vasodilation, which has been shown to mildly increase EF (11,12). CT was performed after the effects of pharmacologic vasodilation were antagonized by aminophylline, to abolish the increasing effect of dipyridamole on heart rate, which is a critical factor for CT angiography image quality. Aminophylline has been shown to have positive inotropic effects in obstructive lung disease as a standalone agent (27), but in our setting it is given to antagonize dipyridamole, and the opposite effects on heart rate and blood pressure suggest that dipyridamole and aminophylline likely cancel each other out for hemodynamic influence. Also, patients were pretreated with oral metroprolol before PET/CT, with the aim of having peak action and, thus, optimal heart rate reduction at the time of CT angiography. Additionally, patients received nitroglycerin directly before CT angiography for coronary vasodilation. Both drugs are part of current standard CT protocols for coronary angiography. Acute β-blockade may reduce LV function (28), whereas nitrates result in ventricular unloading and may increase EF (29). Measures of LV function from CT, however, have been compared with other independent techniques such as MRI, echocardiography, and SPECT (13–16), and despite the use of premedication for CT in several studies, EFs were often almost identical and differences between CT and the other techniques (in which no medication was used) were not of the same magnitude as in our study. The observed differences between 82Rb PET and CT in our study, therefore, cannot be solely explained by the effects of medications.
CONCLUSION
Global LV function can be measured reliably and reproducibly from gated 82Rb PET using different available software products, although there are systematic differences between sets of PET software, probably due to differences in contour detection algorithms. Also, EF is generally underestimated by PET, compared with CT, which is a result of underestimation of EDV from count-poor end-diastolic frames. This underestimation suggests that the different methods cannot be used interchangeably—a point that needs to be considered in clinical interpretation of gated 82Rb PET.
Footnotes
-
COPYRIGHT © 2008 by the Society of Nuclear Medicine, Inc.
References
- Received for publication April 23, 2008.
- Accepted for publication June 2, 2008.


Jump to section
Related Articles
Cited By...
- Cardiac and Respiratory Motion Correction for Simultaneous Cardiac PET/MR
- Measurement of LV Volumes and Function Using Oxygen-15 Water-Gated PET and Comparison With CMR Imaging
- Automatic Extraction of Myocardial Mass and Volume Using Parametric Images from Dynamic Nongated PET
- 2013 ACCF/ACR/ASE/ASNC/SCCT/SCMR Appropriate Utilization of Cardiovascular Imaging in Heart Failure: A Joint Report of the American College of Radiology Appropriateness Criteria Committee and the American College of Cardiology Foundation Appropriate Use Criteria Task Force
- Molecular Hybrid Positron Emission Tomography/Computed Tomography Imaging of Cardiac Angiotensin II Type 1 Receptors
- Impaired Global Myocardial Flow Dynamics Despite Normal Left Ventricular Function and Regional Perfusion in Chronic Kidney Disease: A Quantitative Analysis of Clinical 82Rb PET/CT Studies
- Transient Ischemic Dilation Ratio in 82Rb PET Myocardial Perfusion Imaging: Normal Values and Significance as a Diagnostic and Prognostic Marker
- Prediction of Short-Term Cardiovascular Events Using Quantification of Global Myocardial Flow Reserve in Patients Referred for Clinical 82Rb PET Perfusion Imaging
- Reference Ranges for LVEF and LV Volumes from Electrocardiographically Gated 82Rb Cardiac PET/CT Using Commercially Available Software
- Automated Quality Control for Segmentation of Myocardial Perfusion SPECT
- Cardiac Positron Emission Tomography