


Abstract
In myocardial perfusion SPECT, transient ischemic dilation ratio (TID) is a well-established marker of severe ischemia and adverse outcome. However, its role in the setting of 82Rb PET is less well defined. Methods: We analyzed 265 subjects who underwent clinical rest–dipyridamole 82Rb PET/CT. Sixty-two subjects without a prior history of cardiac disease and with a normal myocardial perfusion study had either a low or a very low pretest likelihood of coronary artery disease or negative CT angiography. These subjects were used to establish a reference range of TID. In the remaining 203 patients with an intermediate or high pretest likelihood, subgroups with normal and abnormal TID were established and compared with respect to clinical variables, perfusion defect scores, left ventricular function, and absolute myocardial flow reserve. Follow-up was obtained for 969 ± 328 d to determine mortality by review of the social security death index. Results: In the reference group, TID ratio was 0.98 ± 0.06. Accordingly, a threshold for abnormal TID was set at greater than 1.13 (0.98 + 2.5 SDs). In the study group, 19 of 203 patients (9%) had an elevated TID ratio. Significant differences between subgroups with normal and abnormal TID ratio were observed for ejection fraction reserve (5.0 ± 6.4 vs. 1.8 ± 7.9; P < 0.05), difference between end-systolic volume (ESV) at rest and stress (ΔESV[stress–rest]; 1.8 ± 7.4 vs. 12.3 ± 13.0 mL; P < 0.0001), difference between end-diastolic volume (EDV) at rest and stress (ΔEDV[stress–rest]; 10.8 ± 11.5 vs. 23.8 ± 14.6 mL; P < 0.0001), summed rest score (1.8 ± 3.8 vs. 3.8 ± 7.6; P < 0.05), summed stress score (3.0 ± 5.4 vs. 7.5 ± 9.8; P < 0.002), summed difference score (1.3 ± 2.6 vs. 3.7 ± 5.3; P < 0.02), and global myocardial flow reserve (2.1 ± 0.8 vs. 1.7 ± 0.6; P < 0.02). Additionally, TID-positive patients had a significantly lower overall survival probability (P < 0.05). In a subgroup analysis of patients without regional perfusion abnormalities, TID-positive patients’ overall survival probability was significantly smaller (P < 0.03), and TID was an independent predictor (exponentiation of the B coefficients [Exp(b)] = 6.22; P < 0.009) together with an ejection fraction below 45% (Exp[b] = 6.16; P < 0.002). Conclusion: The present study suggests a reference range of TID for 82Rb PET myocardial perfusion imaging that is in the range of previously established values for SPECT. Abnormal TID in 82Rb PET is associated with more extensive left ventricular dysfunction, ischemic compromise, and reduced global flow reserve. Preliminary outcome analysis suggests that TID-positive subjects have a lower overall survival probability.
PET using 82Rb is becoming a more widespread and attractive alternative to SPECT for myocardial perfusion imaging (1,2), not only because of the persistent shortage of 99mTc (3) but also because of its superior diagnostic value for coronary artery disease (CAD) when compared with myocardial perfusion SPECT (2,4,5), its low radiation dose (6), its short acquisition time allowing multiple studies in 1 d (1,2), and its potential to quantify absolute myocardial blood flow (7). Nevertheless, some generally accepted parameters in myocardial perfusion SPECT have only been marginally investigated in 82Rb PET. The transient ischemic dilation ratio (TID), determined by the ratio of the stress endocardial volume and the rest endocardial volume in static nongated images, is a well-established marker of severe ischemia (8–10) and adverse outcome in myocardial perfusion SPECT (10,11), but its role in the setting of 82Rb PET is less well defined and needs to be further elucidated. The objective of this study was to determine the reference range of TID in 82Rb myocardial perfusion imaging and to investigate its relevance with respect to clinical variables, perfusion defect scores, left ventricular (LV) function, absolute coronary flow, and adverse outcome.
MATERIALS AND METHODS
Patients and Study Design
We retrospectively analyzed 265 consecutive patients who underwent clinical rest–dipyridamole 82Rb PET/CT myocardial perfusion scanning at Johns Hopkins Hospital. Only PET/CT studies with availability of all necessary image sets were included. A single PET/CT scan was obtained per patient.
A reference group for definition of the reference range of TID consisted of 62 subjects with no prior history of cardiac disease and without perfusion defects. Subjects were included in this group either because they had a low or very low pretest likelihood of CAD (≤10%) based on criteria by Diamond and Forrester (12) (n = 34) or because they had negative CT angiography (CTA) results during the PET/CT session, showing complete absence of coronary atherosclerosis (n = 28). General characteristics at the time of PET are summarized in Table 1. This group was already used for definition of reference ranges of LV functional measurements from gated PET in a prior publication, in which TID had not been analyzed (13).
General Characteristics of Reference Group Used to Define Reference Range of TID
In the remaining 203 patients, the study group, the mean age (±SD) was 60 ± 12 y. The group consisted of 90 men and 113 women, with a mean body mass index of 31.9 ± 8.9. Regarding further risk factors, there were 71 subjects with a history of smoking, 134 patients with hypertension, 100 patients with hyperlipidemia, and 75 subjects with diabetes mellitus. Seventy-four patients had a history of CAD, 29 patients had prior myocardial infarction (MI), and 7 patients had been diagnosed with heart failure. Forty subjects received β-blockers, 44 were treated with either angiotensin-converting enzyme inhibitors or angiotensin receptor blockers, and 43 patients took statins at the time of the PET scan. In 136 patients, the scan was requested because of the patient's presentation with acute chest pain or shortness of breath. Twenty-eight patients were scanned for follow-up purposes—for example, because of a positive history of heart failure, MI, percutaneous coronary intervention, or coronary bypass grafts. Only 17 patients were referred for preoperative evaluation. Other indications were screening for CAD because of multiple risk factors (n = 7), equivocal SPECT (n = 3), syncope (n = 1), or suspected cardiac sarcoidosis or cardiomyopathy (n = 7). Two scans were obtained because of unknown reasons for hypertensive urgency or implanted cardioverter defibrillator triggering. In 4 patients, the scan was requested for more than one of these reasons: 3 patients were referred because of chest pain and a history of syncope and 1 patient was scanned because of shortness of breath and for follow-up. Taking these characteristics into account, this study group can be described as a heterogeneous assortment of patients with known CAD or an intermediate or high likelihood for CAD. A detailed summary of the clinical characteristics can be found in Table 2.
Clinical Characteristics of Entire Study Group and TID-Positive and TID-Negative Subgroups
Because of its retrospective nature, this study was granted exempt status by the Johns Hopkins Institutional Review Board.
Acquisition Protocol
All images were acquired using a Discovery STRx PET/CT system (GE Healthcare). The PET component is equipped with a high-performance lutetium yttrium orthosilicate crystal scintillator, and the CT component consists of a 64-slice CT scanner. Patients were instructed to refrain from any caffeinated substances for 24 h and to fast for more than 4 h before testing. For attenuation correction, a low-dose CT scan (120 kV, 50–100 mA) was obtained before the rest–stress myocardial perfusion protocol was started.
For the rest acquisition, 1,480–1,850 MBq (40–50 mCi) of 82Rb-chloride were injected intravenously using the CardioGen-82 82Sr/82Rb generator (Bracco Diagnostics Inc.). After the slow administration of 82Rb over 30 s, a 2-dimensional list-mode PET scan was obtained over a period of 8 min.
For the stress acquisition, dipyridamole (0.56 mg/kg) was applied for 4 min. Four additional minutes after vasodilation, a second dose of 1,480–1,850 MBq (40–50 mCi) of 82Rb-chloride was injected, and data were acquired as previously described for the rest scan. Subsequently, rest and stress PET data were aligned accurately with the CT scan, and attenuation correction was performed (14). Ultimately, resampling of the list-mode data to static (90-s prescan delay), gated (8 bins per cardiac cycle), and dynamic images (32 frames for 8 min: 20 × 6 s, 5 × 12 s, 4 × 30 s, and 3 × 60 s) was accomplished (15).
Data Analysis
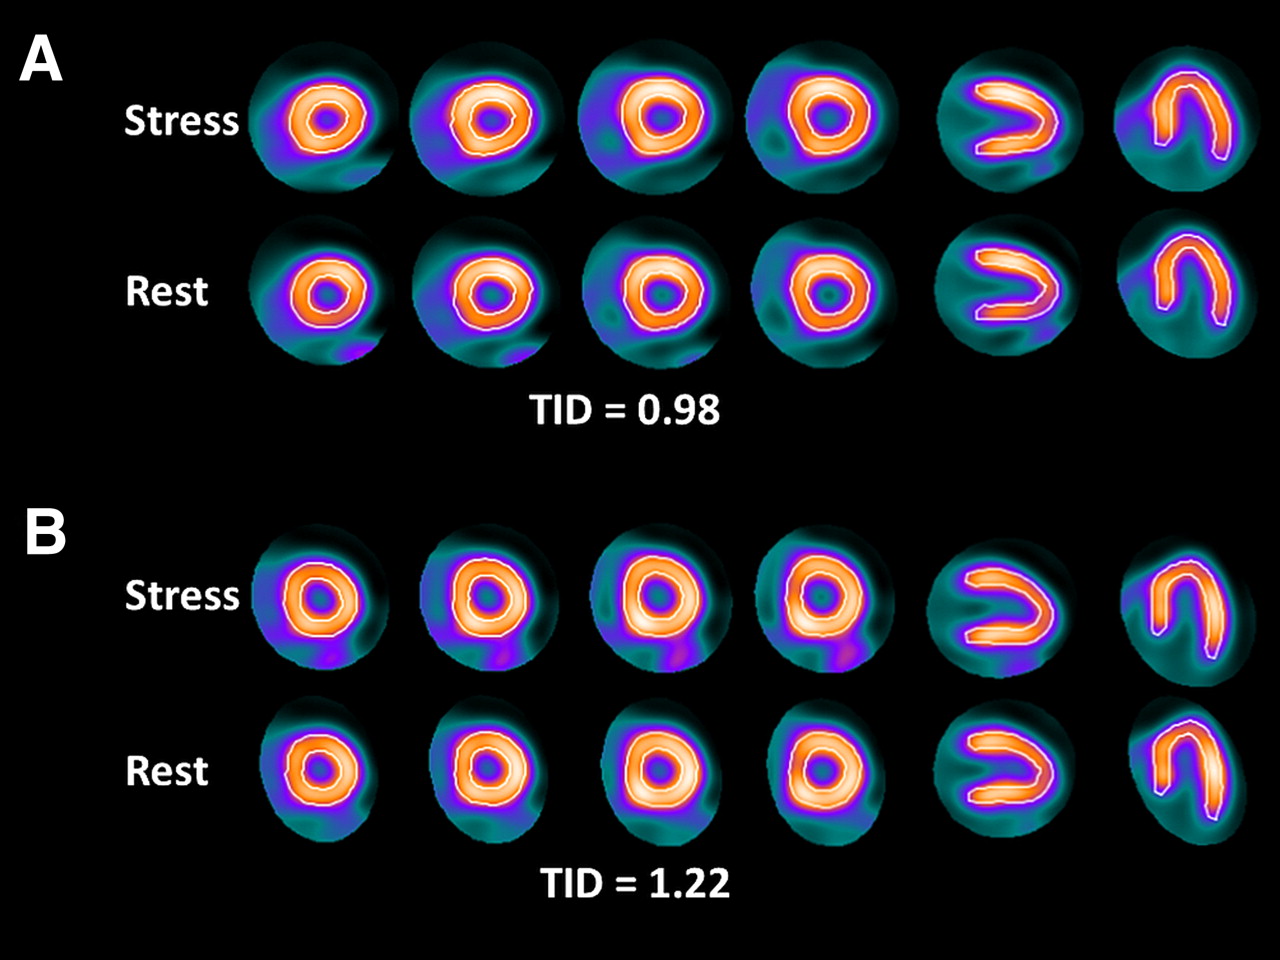
Acquired PET images were reconstructed with an iterative algorithm (ordered-subset expectation maximization, 2 iterations, 21 subsets) and postprocessing filtering (Butterworth, order of 10; cutoff, 0.25 cycles/bin). The acquired images were analyzed using the previously validated commercially available software CardIQ Physio (GE Healthcare) (16). Initially, the long axis was defined by oblique reorientation of the datasets on the transversal planes. Subsequently, the valve plane for gated and ungated images was specified, and quality control of automated contour detection was achieved. Ejection fraction (EF), end-systolic volume (ESV), end-diastolic volume (EDV), and stroke volume were automatically derived from rest and stress gated datasets, and TID was automatically obtained from nongated images. Examples of contouring and derived TIDs are shown in Figure 1.

Assessment of TID ratio by automated contouring of left ventricle using dedicated CardIQ Physio software (GE Healthcare). Representative ungated short-axis and long-axis images at stress and at rest of patient with normal TID (A) and patient with elevated TID (B).
Assessment of Perfusion Defect Scores
The perfusion defect scores—summed rest score (SRS) and summed stress score (SSS)—were derived as follows: the 17-segment model according to the American Heart Association was applied for each rest and stress study to the short- and long-axis myocardial tomograms, and scores were obtained using semiquantitative visual interpretation by an experienced reader (17). Briefly, to each segment a value between 0 (normal tracer uptake) and 4 (absence of tracer uptake) was assigned and added to obtain SSS and SRS, and finally the summed difference score (SDS) was calculated by the difference of SSS and SRS (18).
Quantification of Myocardial Blood Flow (MBF)
For quantification of MBF, dynamic images were analyzed with the MunichHeart software, an established custom application that has been previously validated for quantitative PET analyses (7,19). To determine 3-dimensional tracer distribution in the LV myocardium, volumetric sampling was accomplished, and a static polar map of 460 segments was created. Subsequently, segments were reapplied to dynamic imaging series, and time–activity curves were created. A time–activity curve of the arterial blood was calculated by a small cuboidal region of interest in the center of the LV cavity defined in short-axis planes. For the calculation of MBF, a simplified retention approach was used. Briefly, myocardial activity concentration at the time between 4 and 8 min after scan initiation was normalized to the area under the prior acquired arterial input function of the first 120 s, and the so-achieved retention index was then corrected for partial volume, spillover, and nonlinear extraction of the tracer (20–22). A study validating this approach for the PET system used at Johns Hopkins Institution was published recently by our group (7). The resting MBF is known to be influenced by the cardiac work, which can be evaluated by the rate–pressure product (23). Thus, MBF was normalized as previously described (24). The rate–pressure product was calculated by the product of heart rate and systolic blood pressure during the acquisition. Myocardial flow reserve (MFR) was then calculated as the ratio of hyperemic and resting MBF.
Assessment of Outcome
To assess overall mortality, review of the social security death index was performed. Because of difficulties in distinguishing cardiac from noncardiac death from this index, only overall mortality was used for analysis.
Statistical Analysis
All obtained results are shown as mean ± SD, and obtained P values smaller than 0.05 were considered to indicate statistical significance. The 2-tailed unpaired Student t test was used to compare continuous variables and the χ2 test to compare nominal variables. To investigate the correlation between continuous variables, the Pearson coefficient with Fisher r-to-z transformation for significance was applied.
Shown survival curves were drawn according to Kaplan–Meier, and a log-rank analysis was performed to calculate P values. Age-adjusted multivariate Cox proportional hazards regression was performed to identify independent variables for the occurrence of defined events and to obtain exponentiation of the B coefficients (Exp[b]) and 95% confidence intervals (CIs).
For statistical analyses, MedCalc (version 11.6.1.0; MedCalc Software) for Windows (Microsoft) was used.
RESULTS
Establishment of Normal Range for TID
In the reference group of subjects without CAD, the TID ratio was 0.98 ± 0.06, ranging from 0.85 to 1.11. Using the mean and SD, we set a threshold for abnormally elevated TID at greater than 1.13 (0.98 + 2.5 SDs) for further analysis (Fig. 2).
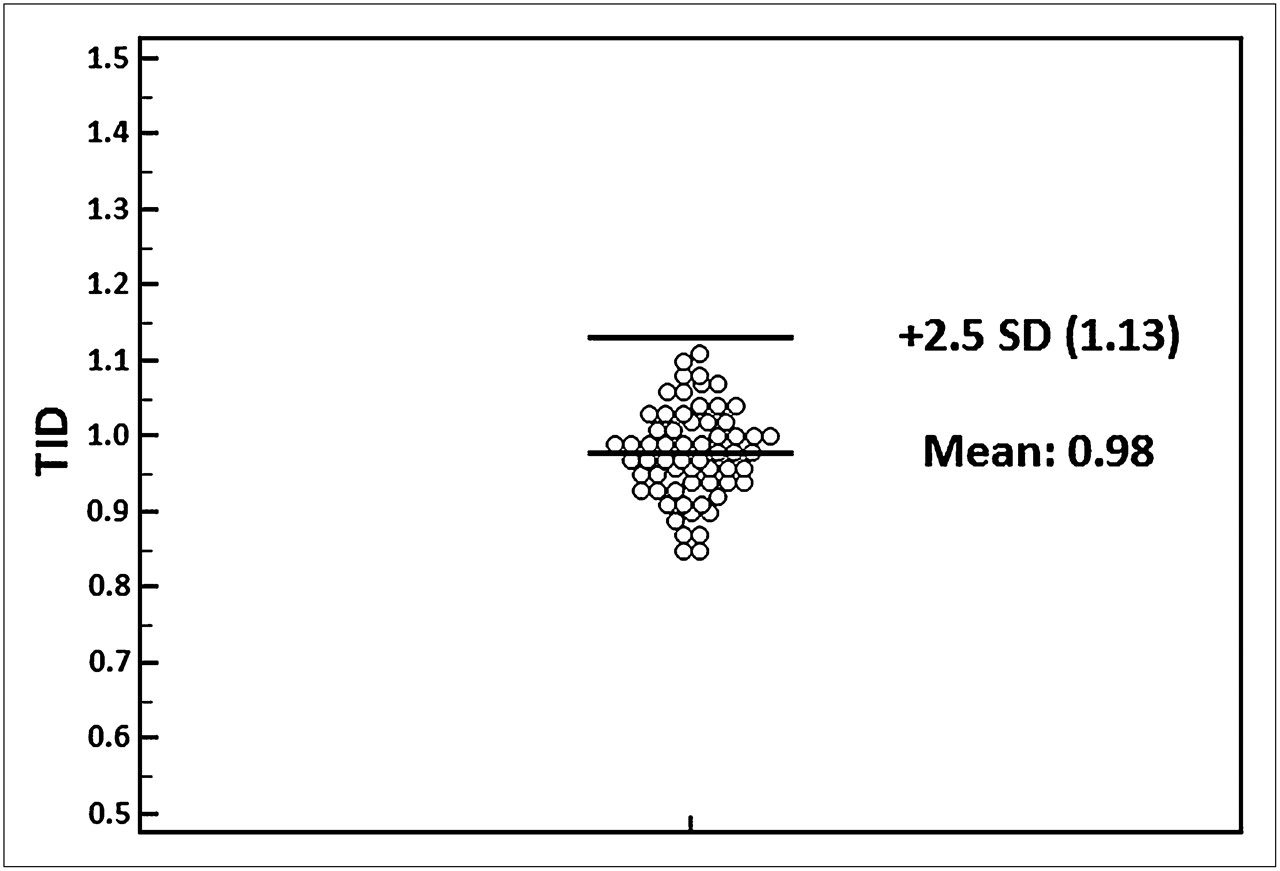
Dot plot representing TID values of reference group without CAD. Threshold for abnormal TID was set at greater than 1.13 (0.98 + 2.5 SDs).
Clinical Characteristics of TID-Positive Patients
In the study group with suspected or proven CAD, TID-negative (n = 184; 91%) and TID-positive (n = 19; 9%) subgroups were defined and compared with respect to different clinical variables (Table 2). There were no significant differences regarding age, sex, race, body mass index, history of smoking, hypertension, hyperlipidemia, or diabetes mellitus. No significant differences were found regarding β-blocker, angiotensin-converting enzyme inhibitor, angiotensin receptor blocker, or statin treatment at the time of PET acquisition. Comparing the cardiac history of both groups, we found no significant difference for prior MI, heart failure, or other cardiac diseases. Also, the rate of a negative cardiac history was similar in both subgroups. However, the rate of positive CAD history (62/184 [34%] TID-negative group vs. 12/19 [63%] TID-positive group, P < 0.03) and the rate of prior percutaneous coronary interventions or coronary artery bypass grafts (33/184 [18%] TID-negative group vs. 8/19 [42%] TID-positive group, P < 0.03) were significantly higher in the TID-positive subgroup. Also, obstructive CAD as assessed by CTA alone (5/45 [11%] TID-negative vs. 4/6 [67%] TID-positive group, P < 0.006) or in combination with catheterization (26/77 [36%] TID-positive group vs. 7/9 [78%] TID-negative group, P < 0.05) was significantly more frequent in the TID-positive subgroup. A positive TID yielded a sensitivity of 21% and a specificity of 96% for obstructive CAD using CTA or catheterization as a reference. The positive predictive value was 78% and the negative predictive value 64%.
Relationship Among TID and LV Volumes, LV Function, Perfusion Defect Scores, Global MBF, and MFR
Table 3 outlines the results regarding LV volumes, LV function, perfusion defect scores, global MBF, and MFR for the TID-positive and -negative subgroups. Regarding LV volumes obtained from gated PET images, there was a significant difference for the change of ESV (ΔESV[stress–rest]) and EDV (ΔEDV[stress–rest]) between stress and rest. ΔESV(stress–rest) and ΔEDV(stress–rest) were significantly higher in the TID-positive group than in the TID-negative group (ΔESV[stress–rest], 1.8 ± 7.4 vs. 12.3 ± 13.0, P < 0.0001; ΔEDV[stress–rest], 10.8 ± 11.5 vs. 23.8 ± 14.6, P < 0.0001). Even though there was no significant difference between the TID subgroups for the EF at stress or at rest, the EF reserve (ΔEF[stress–rest]) was significantly smaller in the TID-positive group (ΔEF[stress–rest], 5.0 ± 6.4 vs. 1.8 ± 7.9, P < 0.05). Assessment of perfusion defect scores revealed significantly higher values for SSS, SRS, and SDS in the TID-positive group (SSS, 3.0 ± 5.4 vs. 7.5 ± 9.8, P < 0.002; SRS, 1.8 ± 3.8 vs. 3.8 ± 7.6, P < 0.05; and SDS, 1.3 ± 2.6 vs. 3.7 ± 5.3, P < 0.001). Global MBF at rest and at stress were not significantly different between TID-positive and TID-negative patients, whereas the MFR was significantly lower in the TID-positive group (2.1 ± 0.8 vs. 1.7 ± 0.6, P < 0.02).
LV Volume, LV Function, Perfusion Defect Scores, Global MBF, and MFR in TID-Positive and TID-Negative Subgroups
There was no correlation for ESV and EDV volumes at rest and stress with TID. However, both ΔESV(stress – rest) and ΔEDV(stress – rest) were significantly correlated with TID (ΔESV[stress – rest]: R2 = 0.23; ΔEDV[stress – rest]: R2 = 0.17; both P < 0.0001). Although there was no significant correlation between the TID and EF at stress or at rest, the correlation between TID and EF reserve was also found to be significant (R2 = 0.0609, P < 0.0005, Fig. 3). Furthermore, correlation analysis between TID and MBF at rest and stress, respectively, did not reveal any correlation, whereas MFR was weakly but significantly correlated with TID (R2 = 0.0449, P < 0.003, Fig. 4).
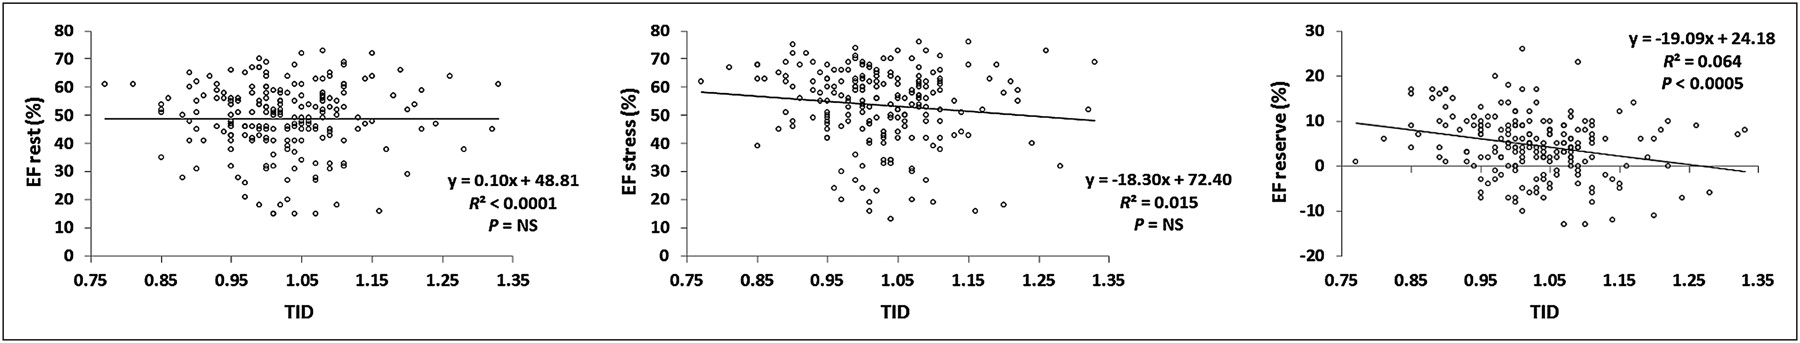
Correlation analysis within high-risk group shows significant correlation between EF reserve and TID. NS = not significant.
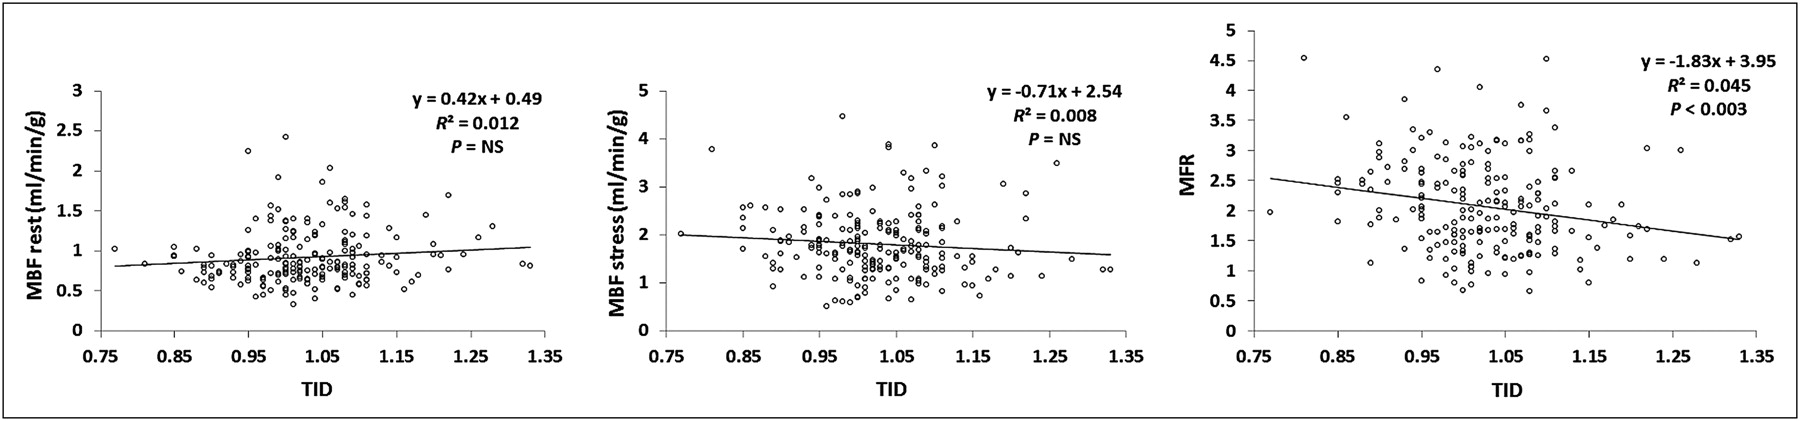
Correlation analysis within high-risk group shows significant correlation between MFR and TID. NS = not significant.
Outcome Analysis
To determine overall mortality, patients were followed for 969 ± 328 d (median, 991 d; range, 59–1,460 d) by review of social security death index. In total, 34 deaths were detected, 28 in the TID-negative subgroup and 6 in the TID-positive subgroup. The mean time to event was 505 ± 363 d (median, 405 d; range, 59–1,257 d). Kaplan–Meier analysis showed that the overall survival probability was significantly smaller in TID-positive patients (P < 0.05; hazard ratio, 2.4; 95% CI, 0.7–8.1, Fig. 5A).
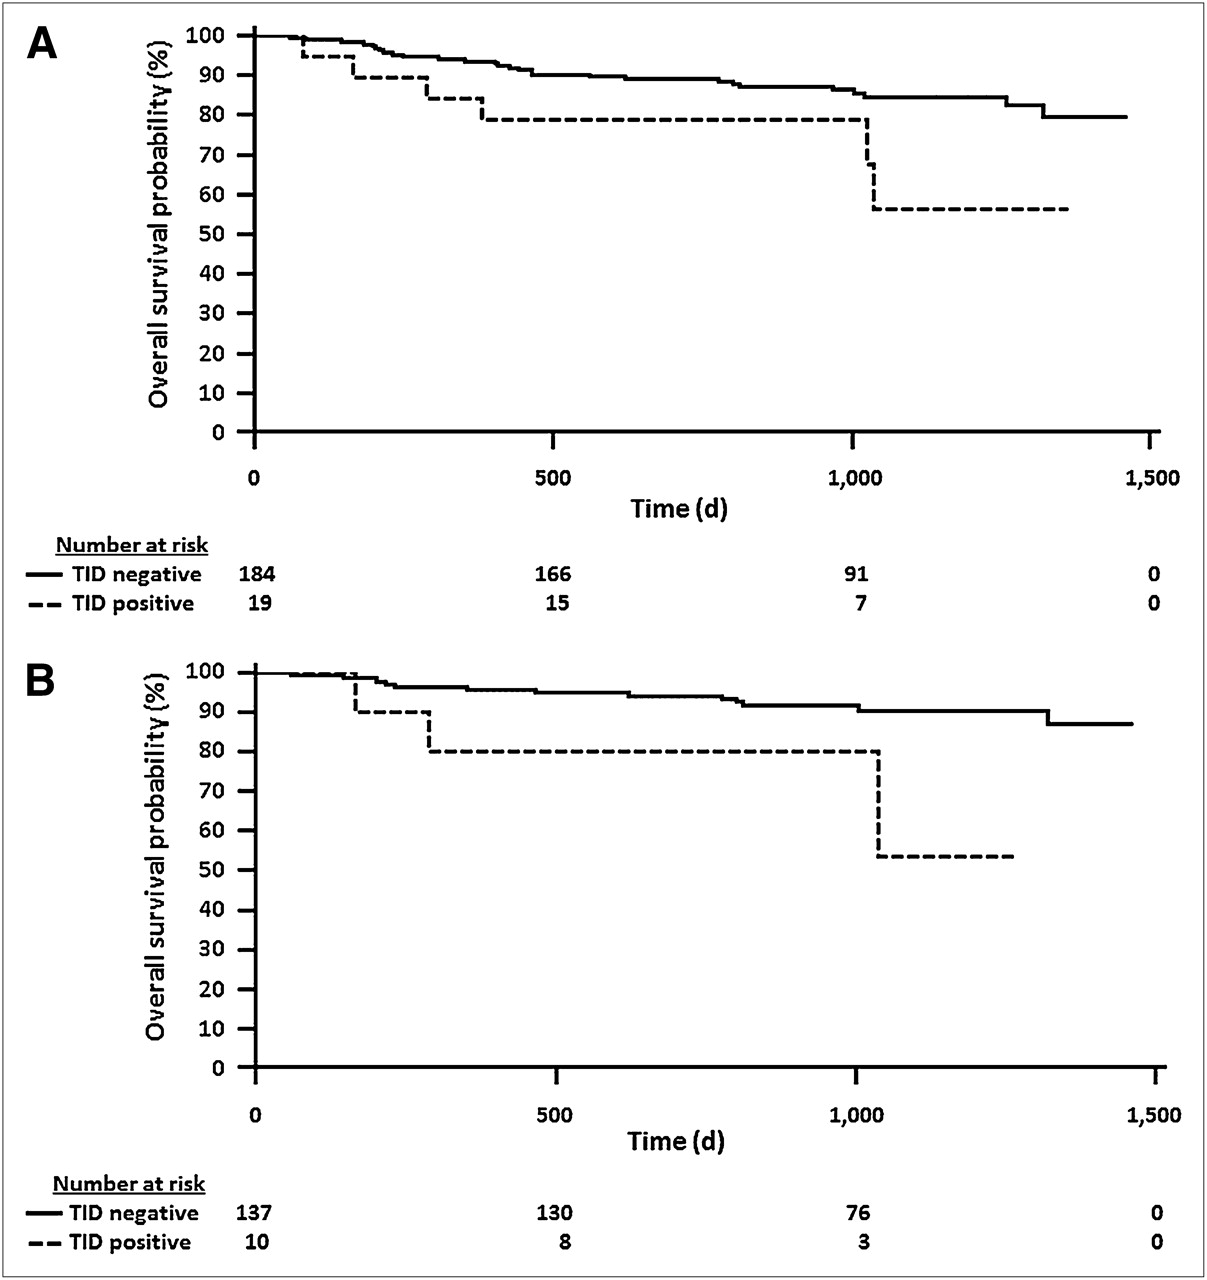
(A) Kaplan–Meier curve to compare overall survival probability in TID-positive and TID-negative patients (n = 203). Overall survival probability was significantly smaller in TID-positive group (P < 0.05). (B) Kaplan–Meier curve to compare overall survival probability in TID-positive and TID-negative subgroups without regional perfusion abnormalities defined by SSS below 4 (n = 147). In normal-perfusion patients, overall survival probability was still significantly smaller in TID-positive group (P < 0.03).
Next, age-adjusted multivariate Cox proportional analysis was performed. Factors considered were functional LV impairment (EF < 45%), elevated ischemic burden (SSS > 3), reduced MFR smaller than the median in the high-risk group (MFR < 1.98), and a TID higher than 1.13. The only significantly independent predictor for an event in this analysis was an EF smaller than 45% (Table 4). Furthermore, we performed overall survival probability analysis for the subgroup of patients without regional perfusion abnormalities (SSS < 4) (24,25). One hundred forty-seven subjects had normal perfusion patterns. Of those, 137 (93%) were in the TID-negative subgroup and 10 (7%) in the TID-positive subgroup. Of the 10 patients with TID but without regional perfusion defects, 8 had a reduced flow reserve below the previously validated threshold of 2.11 (24), and 5 had no prior history of CAD. Also in this subanalysis, TID-positive patients’ overall survival probability was significantly smaller than that of TID-negative patients (P < 0.03; hazard ratio, 3.8; 95% CI, 0.5–31.9; Fig. 5B). Interestingly, in this subgroup analysis, Cox regression analysis showed that positive TID was an independent predictor together with an EF below 45% (Table 5).
Relationship Among TID, EF, SSS, MFR, and Overall Survival Outcome Results
Relationship Among TID, EF, MFR, and Overall Survival Outcome Results in Subgroup Without Regional Perfusion Abnormalities
DISCUSSION
Our results confirm that the upper normal limit of TID in 82Rb PET is within the range of previously established normal values of TID in SPECT or in planar imaging (9,10,26–28). Patients with an elevated TID show a lower EF reserve. Furthermore, in patients with an abnormal TID, ESV and EDV increase to a higher degree from rest to stress, and lower MFR and increased perfusion defect scores can be observed. The results of our preliminary outcome analysis confirm that patients with an elevated TID are at higher risk for death. In the subgroup analysis of patients with normal regional perfusion, an abnormal TID also identified patients with higher mortality and was, moreover, an independent predictor for death together with a decreased EF.
The role of TID in the setting of 82Rb myocardial perfusion imaging has been only marginally investigated so far. In a prior study, Shi et al. investigated the TID ratio in 82Rb rest or pharmacologic stress PET and suggested an upper normal limit of 1.15. They were able to show in a small patient group that this value yields low sensitivity but high specificity and a high positive predictive value in the diagnosis of single- and multivessel CAD (29). However, in contrast to our study, no analyses of clinical variables, LV function, MFR, or outcome were provided.
The TID ratio was described for the first time by Stolzenberg et al. in a case of planar thallium scintigraphy and has been investigated in a large number of studies including SPECT since then (30–33). Although thallium stress images are usually obtained shortly after tracer injection, stress images with 99mTc-labeled tracers are acquired 15–60 min after stress, depending on the protocol used. Accordingly, there are differences in the acquisition mode, and obtained results might therefore vary. In contrast to the conventional acquisition of perfusion images with 99mTc-labeled perfusion agents, stress images using 82Rb-chloride are acquired at the peak of pharmacologic stress and at the time of tracer injection. Thus, patients have an elevated heart rate during acquisition, and the diastolic contribution to the ungated images may be reduced, leading to a reduced LV cavity size. This consideration might also explain the fact that our mean TID value in the low-risk group is slightly below 1 (0.98).
In previous publications, TID was identified as a significant predictor for adverse outcome in SPECT as well as in planar scintigraphy (10,11,33–35). However, to the best of our knowledge there are no data available so far on prognostic implications of TID in 82Rb PET. Our data are preliminary in this regard, because of a low number of events and relatively small sample size. But the results suggest that a positive TID is associated with a reduced overall survival probability. In a subgroup of patients with no regional perfusion defects, TID was still associated with increased risk of death. This finding is in concordance with a study by Abidov et al., who were able to demonstrate that in patients with otherwise normal myocardial perfusion SPECT, TID is a predictor of cardiac events (11). One possible explanation for a positive TID in those subjects might be triple-vessel disease. However, TID may also be a result of other cardiovascular conditions, such as cardiomyopathy, microvascular disease leading to subendocardial ischemia, or an altered systemic hemodynamic response to vasodilator stress. Because of the small sample size and the lack of angiographic information, it is difficult to identify the underlying reason for TID in subjects without regional perfusion abnormalities in our study. Of note, 8 of 10 (80%) patients in the subset had a decreased MFR. But MFR is a complex parameter that may be associated with macroscopic triple-vessel disease but is determined by multiple factors other than potential balanced ischemia. Also, the EF reserve was decreased in patients with an elevated TID, which is most likely associated with impaired LV systolic function. Further studies with the explicit aim of clarifying the underlying cause of TID are necessary. Given the fact that TID requires no additional imaging or other data acquisition and is usually automatically calculated by the respective software, TID should always be taken into consideration when interpreting myocardial perfusion studies.
Our study has some limitations: first, it was performed retrospectively in a group that consisted of a limited number of patients who were followed up for a relatively short time. Second, our preliminary outcome analysis was restricted to the overall mortality as determined by review of the social security death index. Thus, explicit cause of death could not be assessed properly. Third, TID might be present because of triple-vessel disease. However, in the absence of angiographic or CTA results for all patients, conclusions that TID in patients with otherwise normal perfusion scans is associated with balanced ischemia should be made with extreme caution, and further studies elucidating this question need to be conducted. Fourth, because the underlying cause of TID is still not completely elucidated, there is no gold standard for the assessment of TID. As mentioned, TID has been described in various settings of SPECT and PET myocardial perfusion imaging. Thus, the suggested value of TID in this publication might only be suitable in comparable settings using comparable stressing agents and analysis software. And finally, we did not compare the occurrence of cardiac events in multiple study subgroups because follow-up could not be obtained for a sufficient time to capture a larger number of adverse events. The growing clinical use of 82Rb PET will allow for studies with larger sample sizes and more detailed outcome analyses in the future, to confirm our results. Our study should be seen as a stimulus for additional evaluation of TID as a prognostic marker in cardiac PET.
CONCLUSION
Our results suggest that TID is a meaningful parameter in the setting of 82Rb PET myocardial perfusion imaging. The normal value of TID is less than 1.13, which is in the range of previously established values for SPECT. Similar to SPECT, a positive TID ratio is associated with more severe ischemic compromise, LV dysfunction, and reduced global flow reserve. Furthermore, our preliminary outcome analysis suggests that TID-positive subjects have a lower overall survival probability.
DISCLOSURE STATEMENT
The costs of publication of this article were defrayed in part by the payment of page charges. Therefore, and solely to indicate this fact, this article is hereby marked “advertisement” in accordance with 18 USC section 1734.
Acknowledgments
A portion of this study was funded by research grants from GE Healthcare, Bracco Diagnostics, and Lantheus Medical Imaging. No other potential conflict of interest relevant to this article was reported.
Footnotes
Published online Apr. 9, 2012.
- © 2012 by the Society of Nuclear Medicine, Inc.
REFERENCES
- Received for publication August 28, 2011.
- Accepted for publication December 27, 2011.


