


Abstract
Dynamic cardiac PET is used to quantify molecular processes in vivo. However, measurements of left ventricular (LV) mass and volume require electrocardiogram-gated PET data. The aim of this study was to explore the feasibility of measuring LV geometry using nongated dynamic cardiac PET. Methods: Thirty-five patients with aortic-valve stenosis and 10 healthy controls underwent a 27-min 11C-acetate PET/CT scan and cardiac MRI (CMR). The controls were scanned twice to assess repeatability. Parametric images of uptake rate K1 and the blood pool were generated from nongated dynamic data. Using software-based structure recognition, the LV wall was automatically segmented from K1 images to derive functional assessments of LV mass (mLV) and wall thickness. End-systolic and end-diastolic volumes were calculated using blood pool images and applied to obtain stroke volume and LV ejection fraction (LVEF). PET measurements were compared with CMR. Results: High, linear correlations were found for LV mass (r = 0.95), end-systolic volume (r = 0.93), and end-diastolic volume (r = 0.90), and slightly lower correlations were found for stroke volume (r = 0.74), LVEF (r = 0.81), and thickness (r = 0.78). Bland–Altman analyses showed significant differences for mLV and thickness only and an overestimation for LVEF at lower values. Intra- and interobserver correlations were greater than 0.95 for all PET measurements. PET repeatability accuracy in the controls was comparable to CMR. Conclusion: LV mass and volume are accurately and automatically generated from dynamic 11C-acetate PET without electrocardiogram gating. This method can be incorporated in a standard routine without any additional workload and can, in theory, be extended to other PET tracers.
Hypertrophy and dilatation of the myocardium together with a reduction in stroke volume are common in nearly any advanced cardiac disease. For this reason, clinical assessments of left ventricular (LV) volume (1,2) and mass (3,4) as markers of cardiac function hold powerful diagnostic and prognostic information.
PET has been used extensively for evaluation of molecular processes of the heart (5). In addition, electrocardiogram-gated PET can be used to assess LV function, mass, and volume using a variety of PET tracers (6–11). However, quantification of molecular processes via tracer kinetic analysis requires dynamic scans whereas functional assessments of LV mass (mLV) and volume require electrocardiogram-gated PET images. The need for separate reconstructions to assess LV volume and to quantify molecular processes increases workload significantly and has limited the use of combined functional and molecular assessments of the heart. In addition, for some PET tracers such as 15O-water, no specific uptake is seen in the myocardium, ruling out the use of electrocardiogram-gated reconstructions to assess myocardial function.
Recently, automatic parametric imaging became available for 15O-water (12), and the same methodology can be applied to most other tracers. Parametric images visualize tracer kinetic parameters on the pixel level and are generated during routine quantitative analysis of dynamic PET images. For a single-tissue-compartment model, used for tracers such as 82Rb, 15O-water, and 11C-acetate, images of tracer uptake, tracer washout, and the arterial and right-ventricular blood fractions are obtained. Combining these parametric images, it might be possible to identify the LV cavity, the LV wall, and LV geometry with a sufficiently high accuracy for use in clinical reporting and research.
The aim of this study was to explore the use of parametric images obtained from dynamic and non–electrocardiogram-gated 11C-acetate PET in automatically deriving mass and volumetric information on the left ventricle.
MATERIALS AND METHODS
Patient Population
Thirty-five patients (25 men 68.4 ± 9.6 y old [mean ± SD]; 10 women 67.9 ± 9.4 y old) with varying degrees of aortic valve stenosis and symptoms of heart failure were included in this study. To assess the reproducibility of the method, 10 healthy controls (7 men 63.4 ± 1.5 y old; 3 women 60.3 ± 8.3 y old) with no signs or history of cardiac disease were included and scanned twice within 2 wk. The local ethical committee approved the study, and all subjects gave written informed consent before inclusion.
Scanning Protocol
PET
11C-acetate was synthesized according to the method of Pike et al. (13), with minor in-house modifications. All subjects were instructed to fast for at least 4 h before undergoing PET, except for water and medicine prescribed for daily intake. Using a Biograph TruePoint TrueV 64 PET/CT scanner (Siemens GMBH), a low-dose CT scan (120 kV, 30 mAs, 4-mm slice thickness) was obtained, followed by a 27-min list-mode emission scan that began simultaneously with automated bolus injection of 407 ± 30 MBq of 11C-acetate (1 mL·s−1) followed by a 35-mL saline flush (2.0 mL·s−1). The TrueX algorithm reconstructed the data into a dynamic series consisting of 29 time frames, using a method similar to one previously described (14).
Cardiac MRI (CMR)
CMR was performed using a 1.5-T Achieva dStream whole-body scanner (Philips) and a 32-channel coil. A survey scan was followed by an electrocardiogram-triggered temporally resolved cine using balanced steady-state free precession during a breath-hold. The images were acquired with an 8-mm slice thickness, no slice gap, a 3.1-ms/1.55-ms repetition time/echo time, a 60° flip angle, a 350 × 350 mm field of view, a 352 × 352 acquisition matrix, and 30 phases within a single cardiac cycle. A stack of 16–18 LV short-axis slices was acquired covering the entire left ventricle.
Parametric Images
The PET scans were analyzed using Cardiac VUer (12). Arterial (CA(t)), venous (CV(t)), and plasma (CP(t)) input functions were obtained using cluster analysis as described previously (15), applying a previously described metabolite correction (16). Using these input functions, parametric images were calculated using a basis-function approach (12,17) of the single-tissue-compartment model (18): in which CPET(t) represents measured tissue concentrations, K1 and k2 11C-acetate uptake and washout rates, respectively, and VA and VV arterial and venous blood fractions, respectively. Finally, parametric images of anatomic tissue fraction were calculated using the following equation (19):
 where CTnorm is a transmission map image based on the low-dose CT scan used for attenuation correction, normalized to density of blood (1.06 g·mL−1). For parametric K1 and k2 images, voxels with VA or VV > 0.60, VA + VV > 0.75, or anatomic tissue fraction < 0.25 were set to 0 as described previously (20).
LV Segmentation
PET
The left ventricle was segmented automatically using parametric images of K1 and VA (Figs. 1A and 1B). First, parametric images were rotated to short-axis images. All slices with a significant K1 in over 50% of the circumference of the heart were included at the discretion of the observer. Then, a mask was defined including all voxels with VA ≥ 0.60 to identify the large arterial blood structures. To remove extracardiac regions, all voxels in K1 images farther than 3 cm from these structures were removed (Fig. 1C). Starting from the center of mass of the VA mask, a profile was defined every 10° on K1 images (Fig. 1D) and the first and last points of this profile above two thirds of the local maximum was defined as the endo- and epicardial borders, respectively. This process was repeated for all angles and all short-axis slices (Fig. 1E), resulting in a volume of interest covering the entire left ventricle. Finally, optional manual fine-tuning of obtained contours could be performed. The two-thirds cutoff and the 3-cm maximum distance of LV tissue from the blood were chosen empirically because these values showed the most consistent results and required minimal manual intervention in a pilot subset of 10 patients.

Schematic representation of stepwise LV segmentation. Short-axis parametric images of VA (A) and K1 (B); K1 image in which all voxels > 3 cm away from the VA mask were removed (C); profile starting from center of mass of VA mask (D); endo- and epicardial contours obtained for all profiles (E); ESV (red) and EDV (white) as defined using VA cutoffs of 0.70 and 0.70/4, respectively (F). Red line in C indicates profile shown in D. Local maximum and endo- and epicardial borders are indicated by dashed and gray lines, respectively. White line in E depicts connection between center of mass of VA mask and center of mass of VV mask, which is defined as midseptal and used to divide LV volume further into 17 segments.
Total LV volume multiplied by the density of tissue (1.05 g·mL−1) was used as mLV. Wall thickness was derived using the mean distance between the endo- and epicardial contours of 6 profiles located at the center of the septum in all midventricular slices. In addition, it was assumed that voxels representing the cavity in all phases of the cardiac cycle (i.e., the end-systolic volume [ESV]) have a high blood-volume fraction, VA (Fig. 1F). Consequently, all voxels inside the inner contour of the myocardium with VA ≥ 0.70 were used to calculate ESV. For end-diastolic volume (EDV), a lower cutoff for VA was used because some voxels represent a mixture of blood in one phase of the cardiac cycle (i.e., diastole) and tissue in other phases. Therefore, all voxels within the outer contour of the myocardium with VA ≥ 0.175 (a quarter of the cutoff for ESV) were used to calculate EDV. These cutoffs were determined empirically using a subset of 10 patients in a direct comparison with CMR-derived values and applied to the full cohort.
CMR
CMR data were analyzed using the freely available software Segment (version 1.9 R3746) (21). LV volume data were derived from short-axis cine images tracing the endocardium and epicardium in end-diastole and end-systole. For mass calculations, an LV density of 1.05 g·mL−1 was assumed. Thickness was defined in the anteroseptal region at the top-papillary level of the left ventricle.
Data Analysis
The stroke volume was calculated as EDV − ESV and the LV ejection fraction (LVEF) as stroke volume/EDV. Correlation and agreement between PET- and CMR-derived measures were assessed using linear regression, intraclass correlation coefficients, and Bland–Altman plots. Paired t tests were used to assess for the presence of systematic differences. The repeatability coefficient was defined as 2 times the SD of the difference or, when there was a significant correlation in Bland–Altman analysis, as 2 times the SD of the residuals of the linear regression.
To study inter- and intraobserver reproducibility, all patient PET data were analyzed twice by a single observer, with more than 1 mo between analyses, and once by a second observer. The first observer was highly experienced, whereas the second observer was trained on a dataset of 5 scans before performing the full analyses. All analyses were masked to the CMR results and to the results of the other observer. All PET analyses of the controls were done by a single observer, and all CMR analyses were done by a single, different observer.
RESULTS
Automatic segmentation of PET scans was successful in all patients, although the LV outflow tract had to be opened manually in some cases by aligning the endo- and epicardial contours, thus setting local LV wall thickness to 0. Substantial user intervention was required during CMR analysis. Average values derived using either PET or CMR are shown in Table 1.
Average Mass and Volume Derived Using CMR and PET
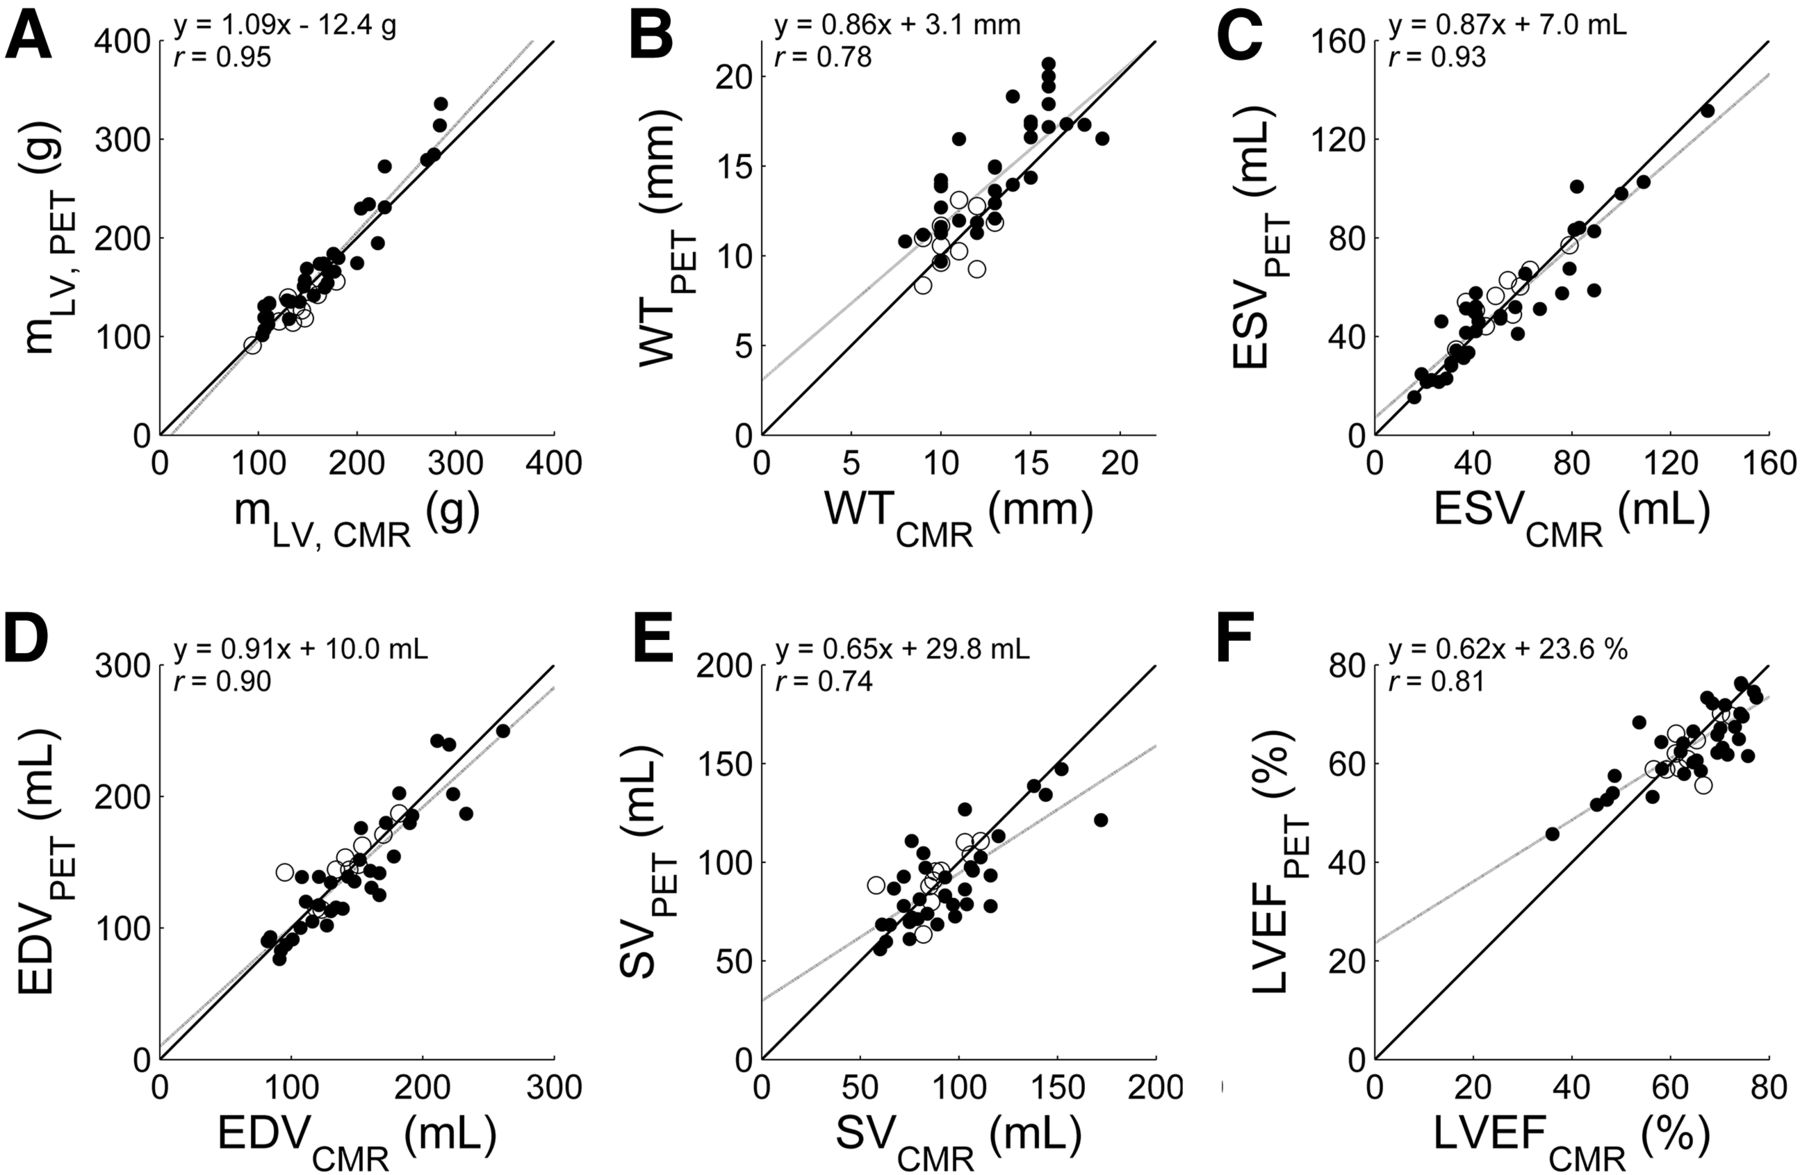
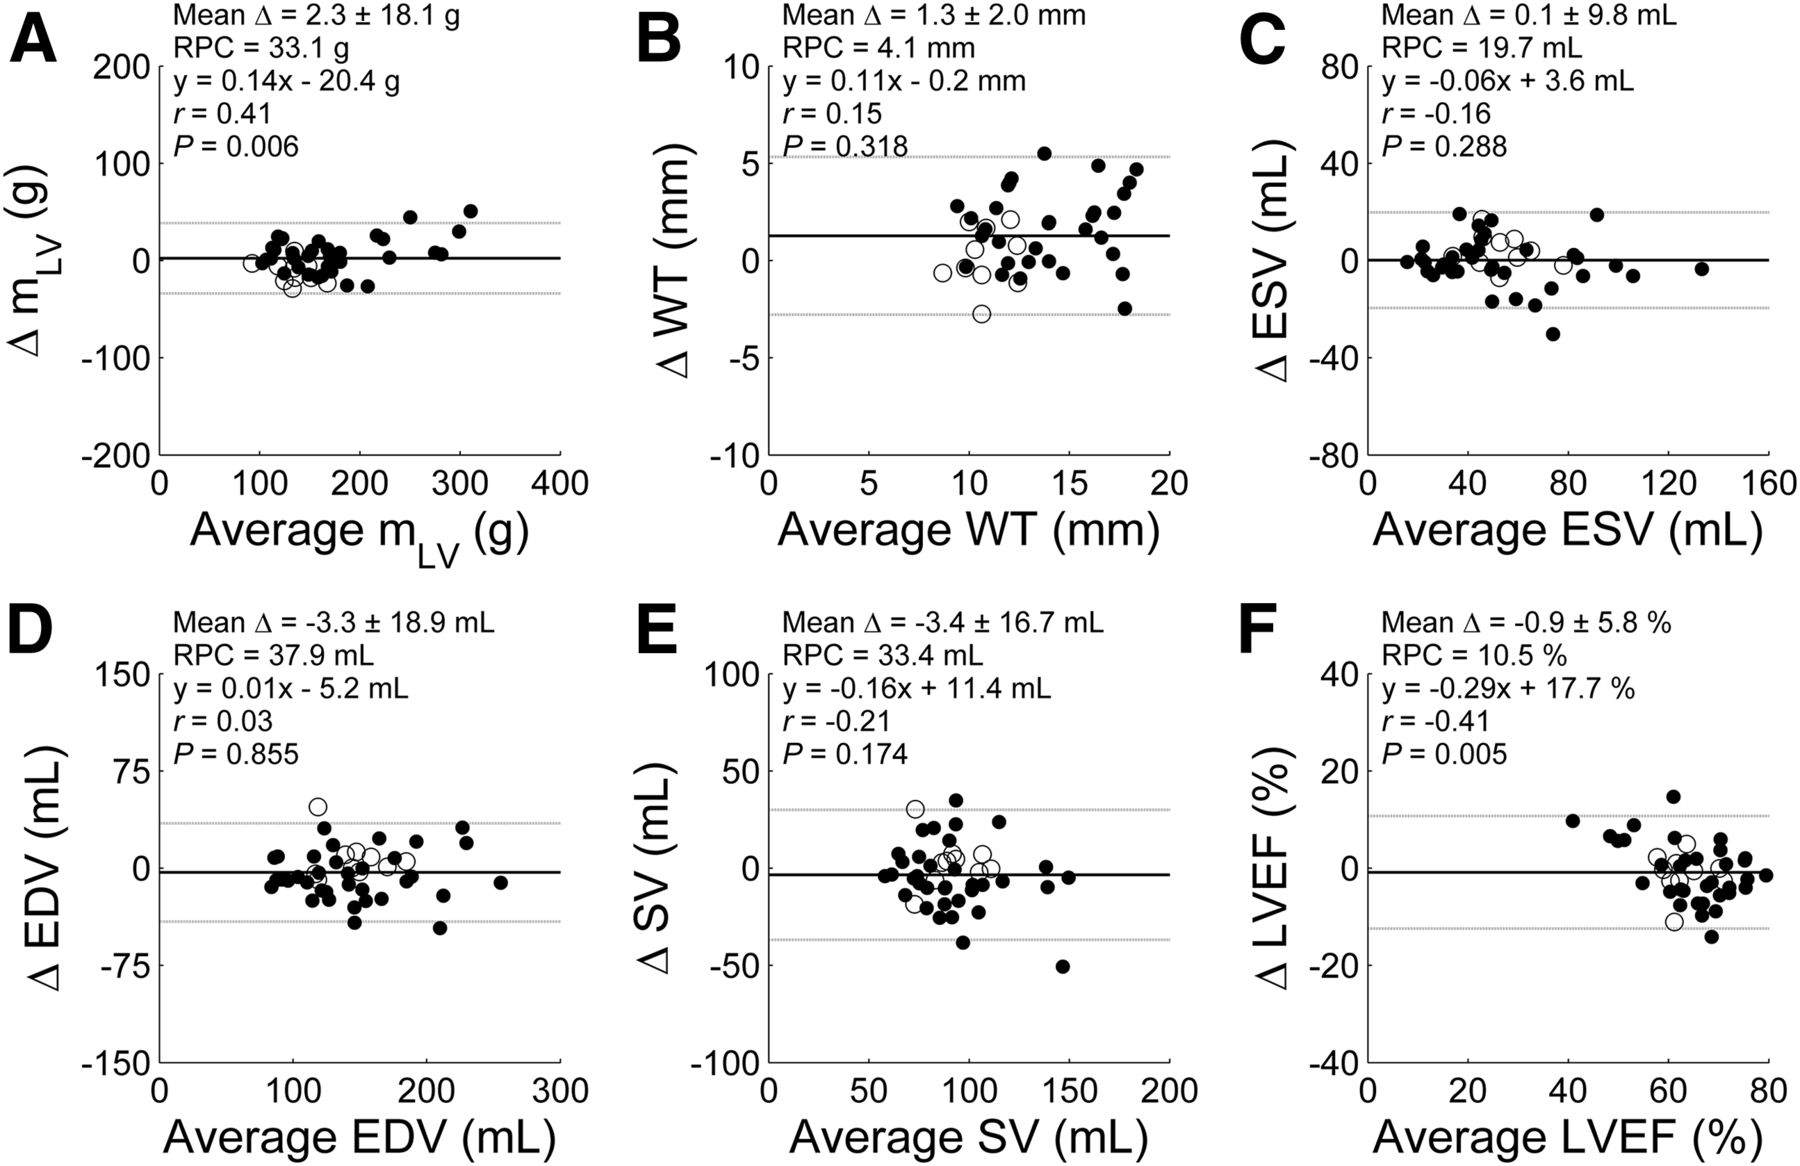
Figures 2 and 3 show correlation and Bland–Altman plots, respectively, for all parameters. For mLV, a highly significant correlation was found (r = 0.95, P < 0.001) and agreement was excellent, with a reproducibility coefficient of 33.1 g. mLV for PET, in comparison with CMR, was 4% higher in patients (P = 0.02) and 9% lower in controls (P = 0.006).

Correlation between CMR- and PET-derived values for mLV (A), wall thickness (B), ESV (C), EDV (D), stroke volume (E), and LVEF (F). Black lines indicate line of identity and gray lines linear fit. ● = patients (n = 35); ○ = controls (n = 10).

Bland–Altman plots between CMR- and PET-derived values for mLV (A), wall thickness (B), ESV (C), EDV (D), stroke volume (E), and LVEF (F). Black lines indicate mean difference and gray lines 95% confidence interval. ● = patients (n = 35); ○ = controls (n = 10); RPC = repeatability coefficient.
The correlation coefficient for thickness was 0.78 (P < 0.001), with an intercept of the linear fit significantly different from 0 (3.1 mm, P = 0.033). During Bland–Altman analysis, a systematic overestimation but no correlation for the residuals was found. For patients, thickness was significantly higher for PET than for CMR (P < 0.001), whereas no such difference was found for controls.
The correlation coefficient was 0.93 for ESV and 0.90 for EDV (both P < 0.001). No significant bias was found for either parameter. The correlation coefficients for stroke volume and LVEF were 0.74 and 0.81, respectively (both P < 0.001), with no systematic differences. Bland–Altman analysis showed that relative differences in LVEF were dependent on the actual value of LVEF, illustrated by a significantly reduced slope of the regression line (0.62, P < 0.001) and a high intercept (23.6%, P < 0.001). For stroke volume, both the slope and the intercept of the linear regression line were significantly different from unity and zero, respectively (slope, 0.65, P = 0.001; intercept, 29.8 mL, P = 0.010).
When we excluded the data of the subset (n = 10) used to define the cutoffs, the correlations for the remaining subject group (n = 25) were not significantly changed (r = 0.96, 0.81, 0.90, 0.89, 0.75, and 0.76 for mLV, thickness, ESV, EDV, stroke volume, and LVEF, respectively).
Inter- and intraobserver variability are shown in Table 2. Observer variation was small, with very high intraclass correlation coefficients for all studied parameters (≥0.95). The reproducibility of each parameter can be seen in Table 3. For mLV, reproducibility was significantly higher for CMR than for PET (P = 0.047), whereas for ESV, EDV, thickness, stroke volume, and LVEF, the reproducibility of CMR and PET did not significantly differ.
Intraclass Correlation Coefficients for Repeated Analyses in 35 Patients
Intraclass Correlation Coefficients for Repeated Measures in 10 Controls
DISCUSSION
This study showed the feasibility of calculating mLV, wall thickness, volume, and LVEF using parametric PET images and a high degree of automation. The method does not use electrocardiogram gating; instead, it uses the same dynamic images as for routine quantification of myocardial blood flow (reflected in K1) and myocardial oxygen consumption (quantified using k2). Myocardial oxygen consumption is commonly used to calculate the efficiency with which the myocardium converts energy into effective work (22). Use of simultaneous assessment of myocardial blood flow and oxygen consumption from 11C-acetate is limited, although it has been shown to be a valuable tool in studying heart failure (23). Global myocardial blood flow and oxygen consumption cannot be quantified without segmentation of the LV wall, and in this study the segmented LV wall was used for additional analysis of LV dimensions and function. The method is highly automated and can therefore be implemented in routine analyses that require segmentation of the left ventricle for calculation of K1 and k2, regardless of whether LV mass and volume are of interest. Because any tracer described by a single-tissue-compartment model can yield parametric images of K1 and k2, the method is in theory applicable to other tracers, although this possibility requires further validation. Similarly, it is expected that regions with scarring (i.e., low K1) will be segmented correctly because the entire K1 profile (Fig. 1D) is lowered, resulting in proportionally lowered relative cutoffs and correct placement of the endo- and epicardial contours. However, this expectation, too, remains to be validated.
Correlations and agreements for all studied variables were high. As indicated by the analyses of repeated measurements, the accuracy of the new PET method is comparable to that of CMR, and intra- and interobserver variability was minimal, with correlation coefficients close to 1. Combining parameters (e.g., for stroke volume and LVEF) propagates and enlarges small measurement inconsistencies in original parameters (i.e., EDV and ESV), resulting in reduced correlations. However, each of the primary measurements—mLV (3,4), ESV (1), and EDV (24)—holds prognostic information on its own, and routine calculation of these parameters is relevant in most clinical settings. Furthermore, the repeated study analysis indicates that the new PET method may equal CMR for precision in serial studies of cardiac geometry.
mLV was slightly but significantly overestimated in patients and slightly but significantly underestimated in controls (Table 1), resulting in a significant group difference. This difference was correlated to the actual thickness only, and it is therefore likely that partial-volume effects, more prominent in hearts with normal thickness, resulted in an underestimation of mLV in controls. CMR thickness was significantly higher in patients than in controls (P = 0.01), as was expected because hypertrophy is a hallmark of aortic stenosis. PET thickness showed an even more significant group difference (P = 0.0001), a consequence of the partial-volume effect. In nongated PET, thickness is averaged through the cardiac cycle, whereas in CMR, thickness is measured at end-diastole. Thickness should therefore be higher with PET than with CMR in all subjects but was found to be so in patients only. A likely explanation is that the overestimation is counteracted by setting K1 to 0 in voxels with VA or VV > 0.6, which could remove part of the edges of the LV wall from the contours. Since the edges have a relatively larger contribution in thinner hearts than in thicker hearts, this effect is more prominent in controls and may explain why thickness and mLV were overestimated in patients but not in controls.
In controls, the mean thickness with each modality was identical, suggesting that partial-volume effects counter the averaging effect of measuring thickness from nongated PET images.
PET estimates were accurate for ESV and EDV, and only a small difference was found for mLV. For both stroke volume and LVEF, both fixed and proportional biases in PET-derived values were found. Therefore, care has to be taken in interpretation of LVEF and stroke volume values. Indicator-dilution methods can be applied to dynamic PET data for assessing forward stroke volume (15), which may serve as an alternative.
The high degree of automation resulted in excellent inter- and intraobserver reproducibility. The only manual step in data processing was determining which short-axis slices to include. However, the use of only slices that showed a high K1 in at least 50% of the circumference provided sufficient standardization, and after a short training interval, consistent results could be obtained. Similarly, the reproducibility of repeated measurements was high for PET. The intraclass correlation coefficient was minimally but significantly higher for CMR mLV, whereas all other parameters were reproduced with insignificant differences.
Segmenting the LV wall was done with K1 images, which are associated with higher contrast and less noise than electrocardiogram-gated images. This advantage provides an inherent filtering step in the analysis, potentially resulting in higher reliability, accuracy, and precision of the estimates than is possible with electrocardiogram-gated images. The cutoffs used for removal of blood regions from parametric images were based on previous studies (20). The two-thirds cutoff used during the radial profile step of segmenting the LV wall, and the 3-cm maximum distance of LV tissue from the blood, were chosen empirically because these values showed the most consistent results and required minimal manual intervention in a pilot subset of 10 patients. Using these cutoffs, only the outflow tract had to be opened manually in some cases by dragging endo- and epicardial contours to the same location. No other user intervention was required. Calculation of ESV and EDV was based on segmentation of parametric VA images, and the optimal cutoffs were derived empirically using the same subset of 10 patients. The cutoff of the arterial blood fraction VA for ESV was varied between 0.5 and 0.9 in steps of 0.05, and a value of 0.70 showed the highest correlation and the smallest differences from CMR data (Supplemental Table 1; supplemental materials are available at http://jnm.snmjournals.org). For EDV, the cutoff was also varied, between 0 and 0.4 in steps of 0.025, and 0.175 was found to give the highest agreement with CMR values (Supplemental Table 2). When a different subset of 10 patients was randomly chosen, the same cutoffs were obtained in 72% and 50% of the subsets for ESV and EDV, respectively, illustrating the consistency of the results.
The lack of electrocardiogram gating did not seem to reduce the accuracy of the method. The correlation coefficient for mLV was higher than those found in two previously published studies (r = 0.82 (7) and 0.7 (9)), with a smaller difference and narrower range (2.3 ± 18.1 g in our study as compared with 4 ± 32 g in one of those previously published studies (9)). However, both of those studies (7,9) included patients with large defects whereas the current study did not. Areas with low tracer uptake may be more challenging to accurately delineate, explaining the difference in correlation between those two studies and ours. However, when relative cutoffs based on radial profiles are used, as in the current study, it is likely that the presence of defects will not significantly affect the accuracy of mLV, although this possibility requires further validation. For thickness, the correlation coefficient was in line with that described in a direct comparison of echocardiography and MRI (25) (r = 0.76), suggesting that thickness derived using parametric PET images is precise enough for widespread use.
For EDV and ESV, correlation coefficients were in line with the 0.90–0.93 for EDV and 0.90–0.99 for ESV found in the literature for studies that used electrocardiogram-gated methods with a similar width of the 95% confidence interval during Bland–Altman analysis (ESV: ±19.7 mL in our study and 8–88 mL in the literature; EDV: ±37.9 mL in our study and 26–92 mL in the literature). Finally, the correlation coefficients for LVEF were also in line with the literature (0.76–0.96 (6–11)), with similar width of the 95% confidence interval (±11.6% in our study and 8%–20% in the literature). In the current cohort, only 5 of 35 patients had an LVEF below 50%, of which 4 had an LVEF in the range of 45%–50%. A more comprehensive assessment in measuring LVEF is required in patients with low LVEFs.
The fact that the method presented in this study relies on image segmentation and empirically derived cutoff values suggests that factors influencing the final image resolution can affect all studied parameters by influencing the shape of the profiles (Fig. 1D) and of the VA images. More studies are warranted to evaluate the impact of scanner type, reconstruction protocol, and input function definition on the new method and to study the generic applicability of the cutoff values used here. In addition, as in all PET measurements, subject motion may play a role. However, estimation of VA and VV is based mainly on activity during the first pass of the bolus through the heart. This phase is typically less than 30 s, reducing the probability that subject motion will affect VA and VV. For mLV estimates, only severe subject motion will significantly affect K1 images. Such motion may cause, for instance, misalignment between VA and K1 images, resulting in gaps in K1 images due to the VA > 0.6 threshold used in generating K1 images, or artificially high K1 values in some regions. Both artifacts are obvious and, when identified, can compromise not only mLV estimates but any regional quantitation and the scan should be discarded for any purpose.
Accurate and highly reproducible measurements of cardiac geometry obtained in an almost fully automated fashion are desirable with any clinical modality. Although there is a growing interest in the use of quantitative PET in cardiology, cardiac PET is still used mainly in academic centers and does not rival echocardiography or CMR in accessibility. The data from this study support the use of the method for research studies involving PET in healthy volunteers and early phases of cardiac disease where information on LV remodeling is required. The nongated approach may be of particular relevance in patients with arrhythmias. Expanding the use of the novel methods into routine diagnostic work requires validating studies with other tracers and other scanners in more patient categories and larger reference databases. Specifically, studies with standard perfusion tracers, both during rest and during stress, and 18F-FDG in patients with chronic ischemic heart disease are needed to assess the relevance of the methodologic assumptions.
CONCLUSION
Using dynamic 11C-acetate PET and parametric images, it is possible to accurately and automatically extract LV mass, ESV, EDV, and, to a lesser extent, wall thickness, stroke volume, and LVEF. The method does not require separate electrocardiogram-gated reconstructions or additional analyses and may advance the use of dynamic PET.
DISCLOSURE
The costs of publication of this article were defrayed in part by the payment of page charges. Therefore, and solely to indicate this fact, this article is hereby marked “advertisement” in accordance with 18 USC section 1734. This study was supported financially by the Lundbeck Foundation, the Arvids Nilssons Foundation, the Karen Elise Jensens Foundation, and the Snedkermester Sophus Jacobsen and Hustru Astrid Jacobsens Foundation. No other potential conflict of interest relevant to this article was reported.
Footnotes
Published online Apr. 28, 2016.
- © 2016 by the Society of Nuclear Medicine and Molecular Imaging, Inc.
REFERENCES
- Received for publication December 1, 2015.
- Accepted for publication March 26, 2016.


Jump to section
Related Articles
Cited By...
- Myocardial External Efficiency in Asymptomatic Severe Primary Mitral Regurgitation Using 11C-Acetate PET
- Myocardial Efficiency: A Fundamental Physiological Concept on the Verge of Clinical Impact
- Metoprolol Reduces Hemodynamic and Metabolic Overload in Asymptomatic Aortic Valve Stenosis Patients: A Randomized Trial
- Myocardial Oxygen Consumption and Efficiency in Aortic Valve Stenosis Patients With and Without Heart Failure