


Article Figures & Data
Figures
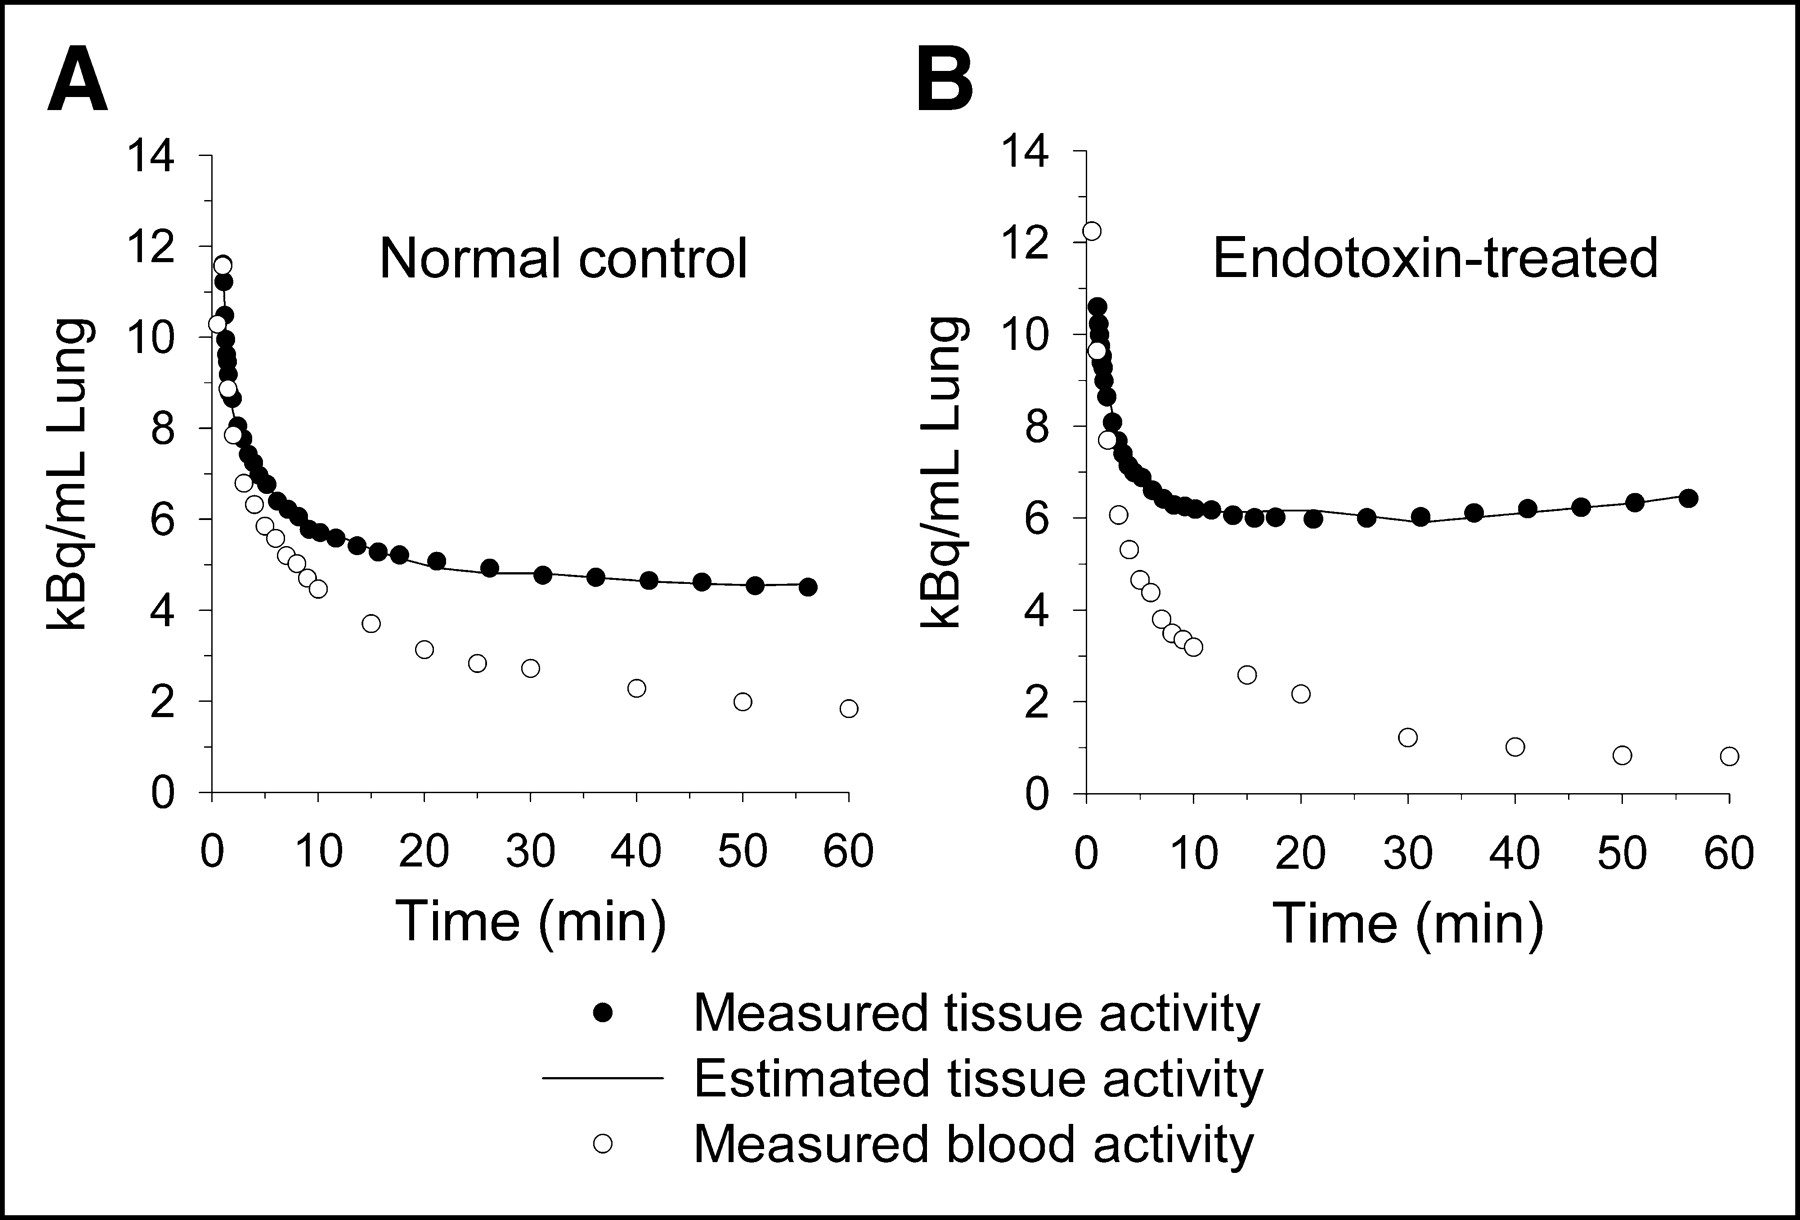
- FIGURE 1.
Examples of residual plots from 3-compartmental model analyses. (A) Representative plot of 1 animal in normal control group. (B) Representative plot of 1 animal in Etx-treated group. Plasma activity curve shows activity measured in plasma from direct blood sampling multiplied by fractional BV estimated by compartmental model.
- FIGURE 2.
Correlations of rate constants K1 (mL blood/mL lung/min; A) and k3 (min−1; B) estimated by 3-compartmental model with calculated influx constant, Ki (mL blood/mL lung/min), from compartmental model. K1 represents transport of 18F-FDG from vascular space into intracellular space, and k3 represents hexokinase activity (“trapping” of 18F-FDG within cell).
- FIGURE 3.
Comparisons of influx constant Ki (mL blood/mL lung/min) calculated by compartmental modeling and Patlak graphical analysis, before and after normalization for initial 18F-FDG volume of distribution (int, mL/mL lung). (A) Correlation of Ki computed by the 2 methods. (B) Bland–Altman plot compares calculation of Ki values. (C) Correlation of Ki after normalization. (D) Bland–Altman plot compares normalized Ki values. Solid line shows mean value of difference in Ki estimated by the 2 methods.
- FIGURE 4.
Correlations of initial 18F-FDG volume of distribution in tissue (Vt) and blood (BV) calculated by compartmental model (CM intercept = Vt + BV) and Patlak graphical analysis and primary determinants of distribution space. (A) Correlation of CM intercept and intercept determined from Patlak linear regression. (B) Correlation of EVLW and Vt.
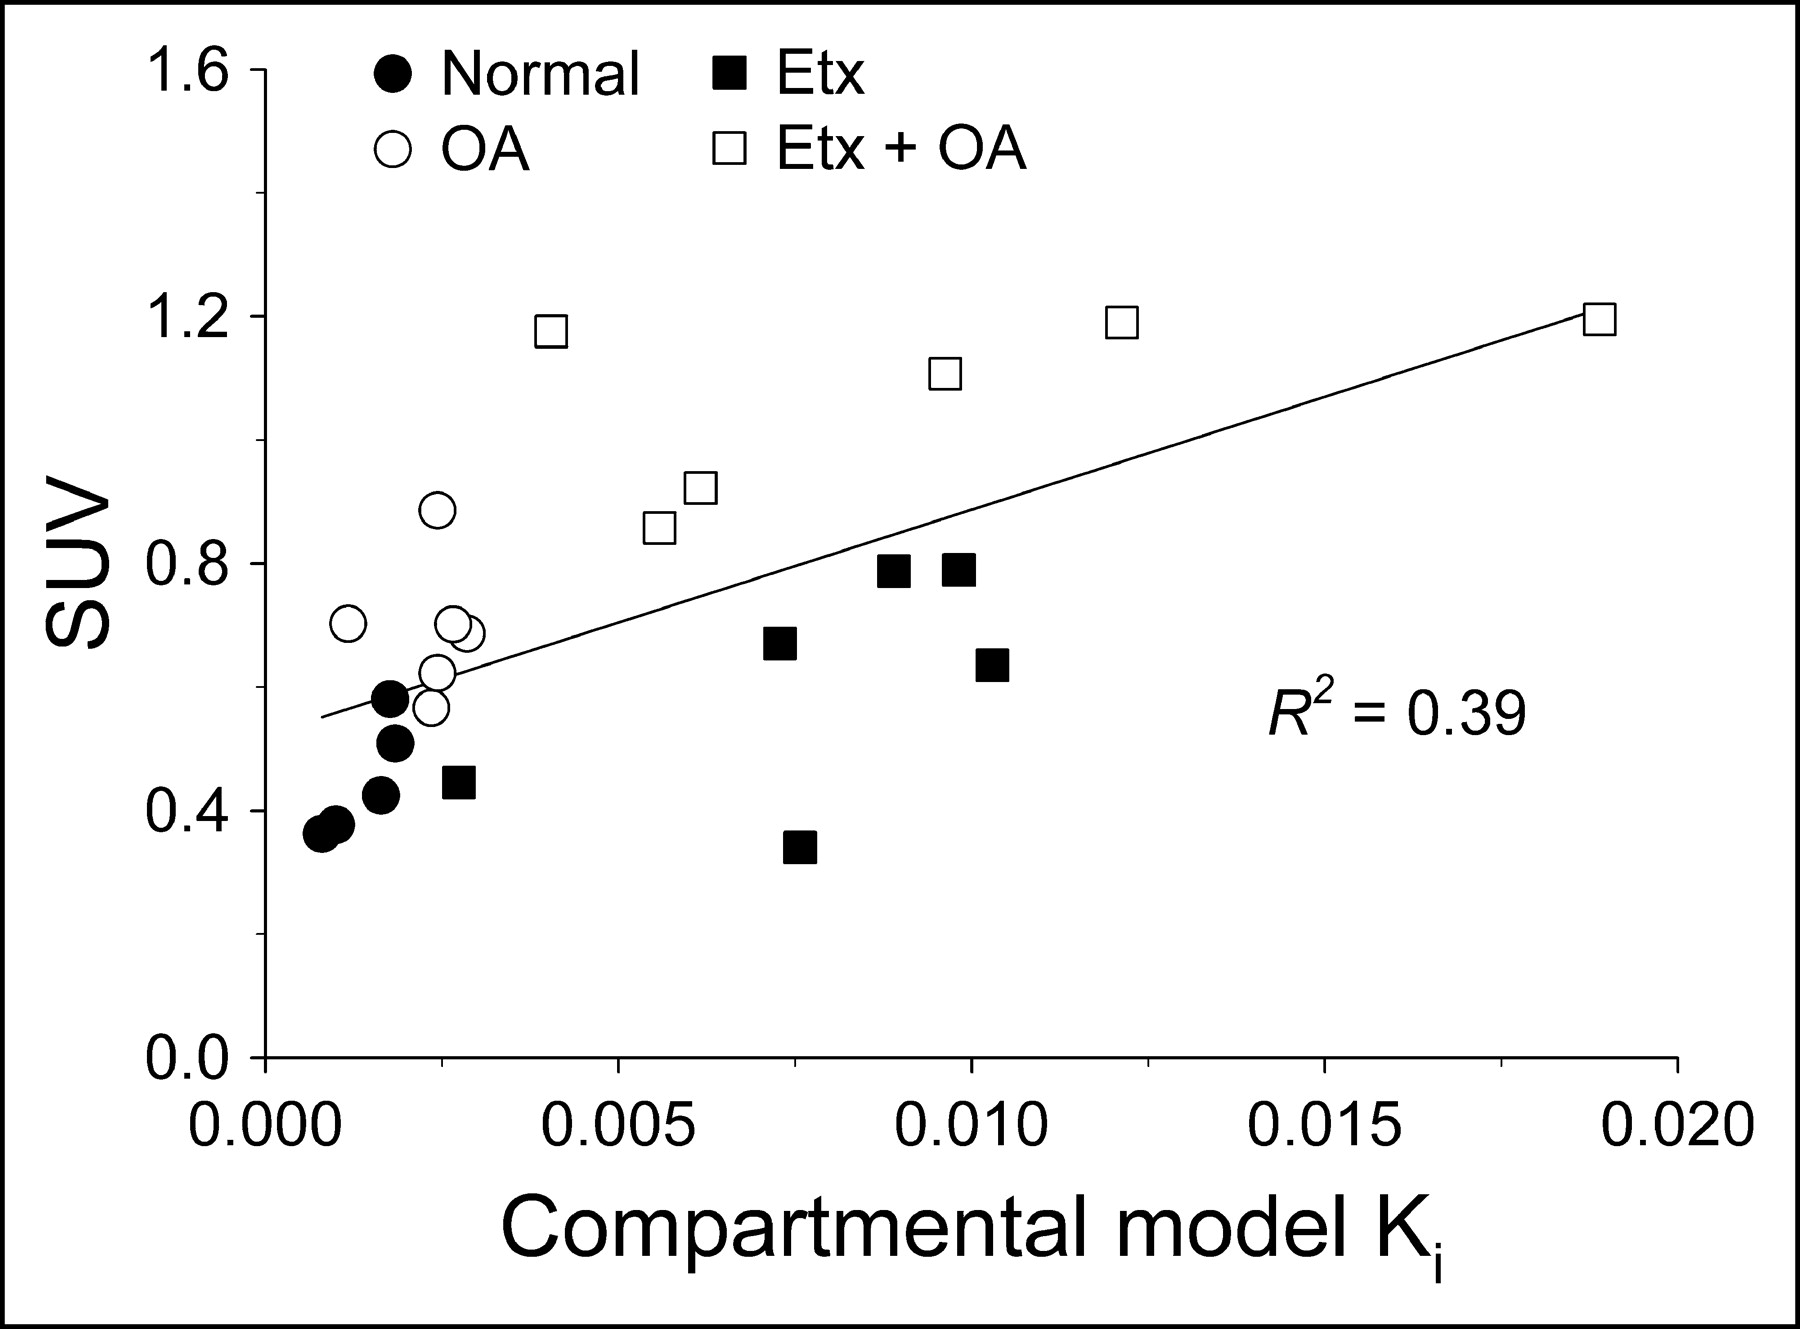
- FIGURE 5.
Correlation between influx constant Ki (mL blood/mL lung/min) calculated by compartmental model and SUV.
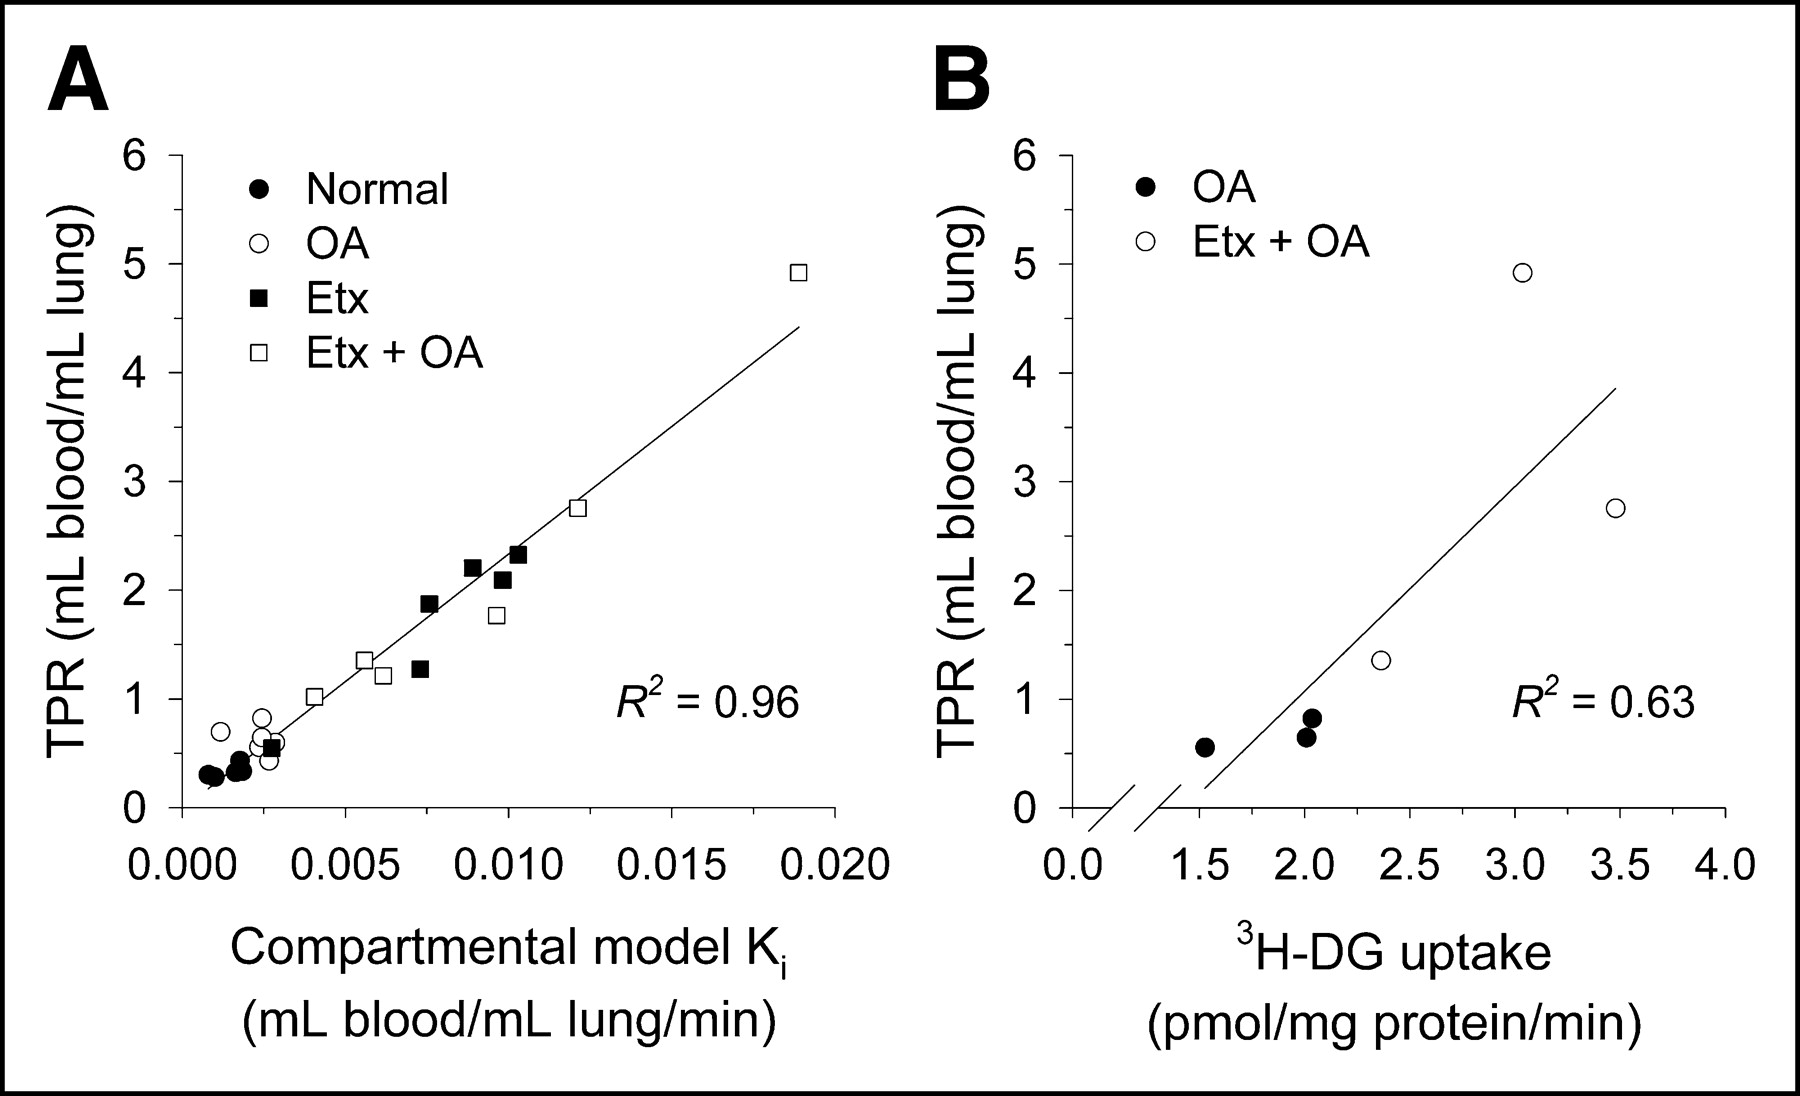
- FIGURE 6.
Correlation of TPR estimates to influx constant Ki (mL blood/mL lung/min) and in vitro measures of 3H-DG uptake. (A) Correlation of TPR with compartmental model-estimated Ki. (B) Correlation of TPR with in vitro 3H-DG uptake.


Tables
- TABLE 2
Comparison of Compartmental Model and Patlak Estimates of Ki, With and Without Intercept Correction, and TPR
Group CM Ki Patlak Ki CM Ki/Int Patlak Ki/Int CM Int Patlak Int TPR Normal 0.0014 ± 0.0005 0.0016 ± 0.0004 0.0077 ± 0.0029 0.0091 ± 0.0015 0.19 ± 0.04 0.18 ± 0.03 0.33 ± 0.06 OA 0.0023 ± 0.0006 0.0034 ± 0.0008 0.0090 ± 0.0049 0.0144 ± 0.0039 0.31 ± 0.11* 0.24 ± 0.04 0.62 ± 0.13 Etx 0.0078 ± 0.0027* 0.0079 ± 0.0026* 0.0308 ± 0.0100*† 0.0319 ± 0.0086* 0.26 ± 0.07 0.25 ± 0.09 1.72 ± 0.68* Etx+OA 0.0085 ± 0.0055* 0.0093 ± 0.0048*† 0.0217 ± 0.0153 0.0213 ± 0.0107* 0.43 ± 0.11*†‡ 0.44 ± 0.07*†‡ 2.17 ± 1.48* - TABLE 3
Comparison of Components of Compartmental Model Intercept with Independently Measured PET Variables
Group Vt CM BV BV* EVLW Normal 0.04 ± 0.02 0.15 ± 0.02 0.16 ± 0.02 0.31 ± 0.03 OA 0.17 ± 0.10† 0.14 ± 0.03 0.21 ± 0.04 0.52 ± 0.13‡ Etx 0.09 ± 0.05 0.17 ± 0.03 0.16 ± 0.02 0.30 ± 0.03 Etx+OA 0.26 ± 0.09†‡§ 0.17 ± 0.04 0.22 ± 0.05 0.54 ± 0.10†‡
In this issue


Jump to section
Related Articles
Cited By...
- High-Temporal-Resolution Kinetic Modeling of Lung Tumors with Dual-Blood Input Function Using Total-Body Dynamic PET
- Total-Body Multiparametric PET Quantification of 18F-FDG Delivery and Metabolism in the Study of Coronavirus Disease 2019 Recovery
- High-Temporal-Resolution Lung Kinetic Modeling Using Total-Body Dynamic PET with Time-Delay and Dispersion Corrections
- Molecular Imaging of Very Late Antigen-4 in Acute Lung Injury
- Consensus Recommendations on the Use of 18F-FDG PET/CT in Lung Disease
- Comparison of Static and Dynamic 18F-FDG PET/CT for Quantification of Pulmonary Inflammation in Acute Lung Injury
- Quantification of Lung PET Images: Challenges and Opportunities
- Lower Respiratory Tract Infection of the Ferret by 2009 H1N1 Pandemic Influenza A Virus Triggers Biphasic, Systemic, and Local Recruitment of Neutrophils
- Image-Derived Input Function for Assessment of 18F-FDG Uptake by the Inflamed Lung
- PET Imaging of Regional 18F-FDG Uptake and Lung Function After Cigarette Smoke Inhalation