


Abstract
Millions of people are affected by respiratory diseases, leading to a significant health burden globally. Because of the current insufficient knowledge of the underlying mechanisms that lead to the development and progression of respiratory diseases, treatment options remain limited. To overcome this limitation and understand the associated molecular changes, noninvasive imaging techniques such as PET and SPECT have been explored for biomarker development, with 18F-FDG PET imaging being the most studied. The quantification of pulmonary molecular imaging data remains challenging because of variations in tissue, air, blood, and water fractions within the lungs. The proportions of these components further differ depending on the lung disease. Therefore, different quantification approaches have been proposed to address these variabilities. However, no standardized approach has been developed to date. This article reviews the data evaluating 18F-FDG PET quantification approaches in lung diseases, focusing on methods to account for variations in lung components and the interpretation of the derived parameters. The diseases reviewed include acute respiratory distress syndrome, chronic obstructive pulmonary disease, and interstitial lung diseases such as idiopathic pulmonary fibrosis. Based on review of prior literature, ongoing research, and discussions among the authors, suggested considerations are presented to assist with the interpretation of the derived parameters from these approaches and the design of future studies.
Respiratory diseases are a significant global health burden that affect millions of people (1,2). However, treatment options remain limited because pathogenic mechanisms remain poorly understood. The clinical manifestations and severity of lung diseases vary significantly, and the number of clinical biomarkers available to identify aggressive disease phenotypes with accelerated progression is limited. Furthermore, 50% of drugs fail in phase III trials because of lack of demonstrable efficacy, and respiratory drugs are often the costliest to develop (1,3,4). These facts highlight the need for quantitative biomarkers to select appropriate therapeutic targets and assess the efficacy of novel respiratory therapies.
The U.S. Food and Drug Administration defines a biomarker as “a defined characteristic that is measured as an indicator of normal biologic processes, pathogenic processes, or responses to an exposure or intervention, including therapeutic interventions” (5). Traditional clinical measures, such as global lung function, reflect disease severity rather than disease activity. Because inflammation is commonly associated with respiratory diseases, robust molecular biomarkers of pulmonary inflammation might be applied in multiple ways to aid the development of effective therapies, including in early-phase clinical pharmacodynamic studies of antiinflammatory therapies, as a complement to structural imaging and functional spirometry measures in phenotyping patients who may benefit from more intensive therapy or earlier lung transplantation, and as a tool to improve our understanding of the pathogenic mechanisms of these complex lung diseases.
Molecular imaging approaches such as PET and SPECT might meet the need for noninvasive biomarkers of lung disease (6). Because inflammatory cell recruitment leads to increased glucose utilization in the lungs, 18F-FDG PET has been widely explored as a biomarker of pulmonary inflammation (7–11). However, standardized quantification approaches are lacking. To isolate the 18F-FDG uptake by parenchymal and immune or inflammatory cells, different methods have been proposed to account for regional variations in the fractions of air, blood, and water, which can vary dramatically with each lung disease. Accounting for these variations will apply equally to new molecular imaging tracers that can measure the activity of specific aspects of lung inflammation or other processes such as fibrosis or endothelial cell activity, as recently reviewed (12,13).
A primary goal for this field is to standardize these approaches for each lung condition. Variability in measured tracer uptake also arises from respiratory motion and differences in reconstruction approaches, among other factors, but these technical issues will be discussed only briefly. Quantification methods for 18F-FDG lung imaging will be reviewed as it is the most widely studied PET tracer to date and serves as a model for all PET and SPECT tracers used for lung imaging.
CLINICAL APPLICATIONS INVESTIGATED WITH 18F-FDG PET IMAGING
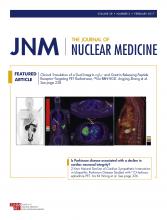
Inflammation characterizes several lung diseases, including pneumonia, cystic fibrosis, chronic obstructive pulmonary disease (COPD), acute respiratory distress syndrome (ARDS), asthma, and interstitial lung diseases such as idiopathic pulmonary fibrosis (IPF), among others (7,8,10,11,14–25). Because ARDS, COPD, and IPF can cause significant variability in the amounts of air, blood, and water in the lungs (Fig. 1), we will focus our methodology discussion on these diseases. ARDS is characterized by persistent pulmonary neutrophilic inflammation, edema, and pulmonary hemorrhage. These can lead to signal from unbound 18F-FDG in the increased blood and water fractions as well as specific trapping in neutrophils (26). In COPD, increased numbers of lung neutrophils and macrophages (1,27–30) would be expected to increase the 18F-FDG signal despite a reduction in measured 18F-FDG due to larger air fractions and reduced blood volumes as a result of emphysema (31). Finally, IPF is characterized by interstitial pneumonia along with fibrosis in a characteristic subpleural pattern of distribution, leading to reduced air, increased fibrosis, and alterations in blood volume depending on the stage of fibrosis (32). These differences in pathobiology highlight the need to account for the changes in the cellular and fluid composition in the lungs when interpreting any increased lung 18F-FDG uptake. Exacerbations also represent a confounding factor leading to increased lung inflammation and 18F-FDG uptake; consequently, most studies have been performed in the clinically stable state.

Variations in relative proportions of air, blood, lung tissue (parenchymal/airway and endothelial cells) and immune cells, and water by lung disease. Proportions of blood and tissue in brain are also shown for comparison.
ANALYSIS METHODS AND THEIR APPLICATIONS IN LUNG DISEASES
Quantification Approaches for 18F-FDG
Overview
The 18F-FDG signal within each PET voxel or predefined region of interest (ROI) in the lungs represents the contribution of activity in parenchymal (i.e., alveolar), airway wall, vascular wall (e.g., endothelial), and immune cells (known collectively in this paper as lung cells), as well as blood and water (i.e., extracellular fluid). Several factors can degrade the lung cell signal within each voxel, including normal respiratory motion and the presence of air that causes partial-volume averaging within each voxel. Furthermore, the contribution of signal from compartments without specific binding, such as blood or water in the lungs, further reduces the signal specificity. The ideal parameter for quantifying 18F-FDG lung uptake would reflect metabolic activity only from the cells thought to contribute to lung disease progression, namely the lung cells, to determine their pathogenic role. Therefore, investigations have tested different methods to account for the 18F-FDG signal in the blood and water and to remove the impact of air fraction so that an outcome measure specific to lung cells can be derived. Although distinguishing the metabolism of specific cell types, such as parenchymal versus airway cells, would contribute significantly to mechanistic studies of lung disease, these quantification methods alone cannot provide such information. However, finding ways to measure lung cell metabolism specifically would still help better characterize the role of lung cells in promoting disease activity and progression.
The methods used to quantify 18F-FDG uptake in human studies and that will be discussed in this review are summarized in Table 1. Compartmental modeling and Patlak graphical analysis have been used to quantify 18F-FDG uptake from dynamic images. The SUV, with or without dual-time-point imaging, and tissue-to-blood ratio have been used for static images. Different approaches have been further applied to reduce the contribution of background 18F-FDG signal from blood and water in the lungs as well as to reduce partial-volume averaging from air in the ROI. For example, kinetic modeling of dynamic PET data can determine the fractional blood volume,  . PET and CT images have been used to estimate the regional air fraction (
 ). Using
  and
and  , the 18F-FDG uptake in everything that is not air or blood (i.e., lung cells and water) can be measured. These approaches are reviewed below, followed by a discussion of their specific applications in ARDS, COPD, and IPF.
Summary of Human Studies Evaluating Quantitative Parameters for 18F-FDG Uptake in Lungs
Kinetic Approaches
The Sokoloff method for quantifying 18F-FDG uptake has served as the basis from which many of the currently used kinetic quantification approaches are derived (33,34). The method was originally developed for measuring brain glucose metabolism, but a key assumption was that the blood volume contribution was negligible relative to the brain parenchymal signal. This was a recognized limitation for applying the method in brain tumors, which have higher  than normal brain, necessitating the addition of a blood volume component to the model (35). With
  estimated at approximately 0.16 in normal lungs, the blood component has a more substantial effect, both in terms of signal and in terms of fractional volume (Fig. 1). Therefore, including
  in a lung compartment model is even more important.
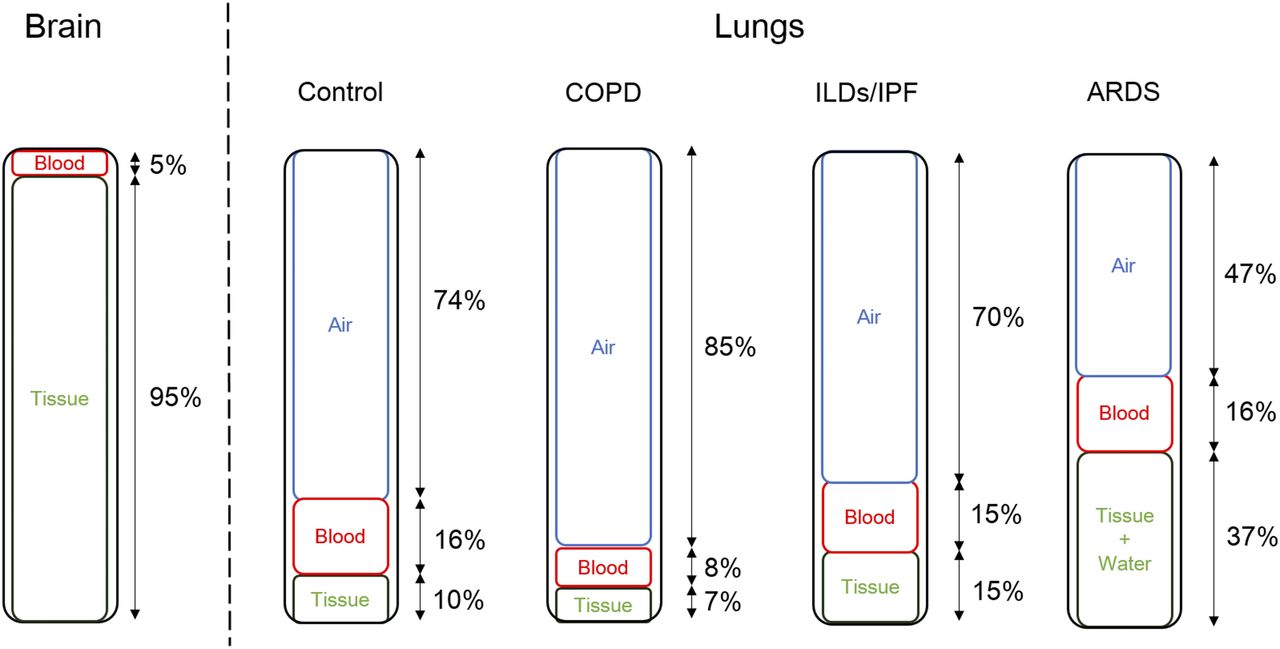
Furthermore, the lung contains air, which is not the case for other organs. Therefore, an equation that accounts for air and blood fractions separately from the other lung components (Fig. 2) has been published and applied in IPF and COPD (21,36): Eq. 1where, for a given ROI,
  is the measured radioactivity concentration,
  is the air concentration (which is negligible for intravenously administered tracers such as 18F-FDG),
  is the blood concentration (derived from the dynamic images or blood samples), and
  is the concentration in lung cells and water (i.e., everything that is not air or blood).
  can be estimated from the compartment model.
  can be determined from the attenuation-correction CT scan after downsampling to match the resolution of the PET image (37,38). Therefore, this model enables isolation of the signal from all nonair and nonblood lung components within the ROI (
 ). However, when
  is less than 0.05 (such as in areas of severe emphysema), the accuracy of this correction should be treated with caution (21).

Schematic of 3-compartment model describing kinetics of tracer in lung tissue (CT). CB is concentration in blood, C1 is concentration in reversible compartment, C2 is concentration in irreversible (trapped) compartment, CT is total tracer concentration in tissue, CM is measured concentration in voxel or region, CA is concentration in air, VA is fractional air volume, VB is fractional blood volume, and Ki is metabolic rate constant of 18F-FDG. Rate constants are represented as K1, k2, and k3. A full derivation has been previously published (34).
The Patlak graphical analysis is derived from the general compartment model for tracers that are irreversibly trapped in the target tissue (39,40). This analysis provides 2 parameters: an estimate of the influx rate constant Ki, a measure of 18F-FDG metabolism, and the intercept, which approximates the distribution volume of all the components of the reversible compartments. This method is independent of the number of compartments. Intercept normalization of the Ki has been attempted to account for the impact of air on the measurement. However, from Equation 1, it can be shown that the intercept-normalized Patlak Ki (KiN) is still influenced by both  and
and  (34).
(34).
With these methods, after correcting for  and
and  , the estimated 18F-FDG uptake comes from the lung cells and water (i.e., everything that is not air or blood). In interstitial lung diseases and COPD, this is sufficient because the water fraction is small. However, in conditions with increased edema, such as ARDS, the water fraction can be significant. Using independent measures of the tissue fraction,
  , and wet-to-dry ratios (as a measure of water), the normalized Ki determined by the Sokoloff model or a modified 4-compartment model that includes a compartment for nonspecific trapping has been used to isolate the lung cell metabolic activity (41–43). These studies confirm the importance of further evaluating modeling approaches that can account for the effects of air, blood, and water together to measure the lung cell 18F-FDG signal specifically.
Static Image Quantification Approaches
The SUV is the concentration measured within a region or voxel normalized to the patient weight and the injected activity. This is the most common parameter measured clinically for PET because of its simplicity, despite its dependency on metabolism in other organs, body mass, and other confounding factors (44,45). The SUV is also affected by air within ROIs. Normalizing it for the air fraction will likely improve its accuracy as a reflection of lung cell metabolic activity (38). Normalization for blood (such as the tissue-to-blood ratio, as explored in a dog model of ARDS (46)) may further improve the accuracy of  ; however, whether this approach is comparable to correcting for
  as measured by kinetic analysis or other imaging (such as 15O-CO scans) remains to be seen.
Other Contributions to Errors in 18F-FDG Quantification in the Lungs
Reconstruction algorithms used to generate PET images can have a significant impact on quantification accuracy, including issues with nonlinearity and underconvergence when using iterative algorithms (45). Most research in this area has focused on detecting lung cancers, which have high signal relative to the lungs. Therefore, further investigation is needed to optimize reconstruction performance for the diffusely distributed, relatively low count activity typically seen in the lungs.
Accurately matching tissue densities between PET and CT images is also essential for accurate PET image attenuation correction and  correction. Gross spatial misregistration of the measured attenuation map and PET activity distribution, which frequently occurs at the diaphragm, is known to cause attenuation correction artifacts (47,48). Additionally, changes in lung density from normal respiration between the PET and CT acquisitions can lead to errors in attenuation and
  correction, introducing additional variability to serial measurements and limiting accurate assessment of the entire lung volume (49). Improved methods for measuring changes in lung density, as well as algorithms to reduce the impact of respiration (50,51) warrant further investigation to improve PET/CT quantification accuracy in lung disease.
ARDS
The Patlak graphical analysis and compartmental model for quantifying lung 18F-FDG uptake have been evaluated most extensively in animal and human models of ARDS (41,46,52–57). In animal models of ARDS, the Patlak Ki correlated with 3H-deoxyglucose uptake in airway cells obtained by bronchoalveolar lavage (52), and Ki normalized for tissue fraction (determined independently by 13N-N2 scans) correlated with lung neutrophil numbers by histology (53). The Ki determined by the Sokoloff model and by a 4-compartment model that includes a water compartment, when normalized for tissue fraction, blood fraction, and wet-to-dry ratios determined independently, further demonstrated regional differences in inflammation related to lung neutrophil numbers in correlating regions (42,43). In a healthy volunteer model of endotoxin-induced acute lung inflammation, both Ki and KiN increased, and both correlated weakly with neutrophil numbers (57). Other lung cells also likely contributed to increased 18F-FDG uptake after endotoxin instillation, as shown in mouse models (58,59). These data demonstrate that increased 18F-FDG uptake, quantified by both Ki and KiN, are associated with neutrophilic inflammatory responses in these models.
Further validation with compartment modeling has also been performed in ARDS animal models. Independent measures of blood fraction and extravascular lung water obtained with 15O-CO and 15O-H2O PET images correlated highly with 3-compartment-model–derived estimates from the 18F-FDG data in a dog model (46). The compartment model estimate of the Patlak Ki also correlated highly with the Patlak-determined Ki. Finally, the addition of another compartment for extravascular lung water improved the model fits for estimating lung 18F-FDG uptake in a sheep model, supporting the applicability of this approach in ARDS (41). Human studies in patients with ARDS have used the Patlak Ki without a correction for lung density or blood fraction but instead have simply compared the Ki in normal versus dense tissue separately across subjects (19,20).
COPD
Given the validation of CT for quantifying emphysema (60), 18F-FDG PET imaging holds great potential for providing additional inflammation-specific information. The KiN has been the primary metric for quantifying 18F-FDG uptake in COPD and asthma (10,17). Upper lung zone KiN correlates negatively with pulmonary function and positively with CT-determined emphysema severity (Fig. 3) (17). KiN may also correlate with a chronic bronchitis phenotype (published in abstract form (61)), suggesting the clinical relevance of this parameter. However, KiN is not increased in subjects with stable asthma when compared with healthy volunteers (10). Furthermore, no difference in the whole-lung Ki was noted between COPD patients and healthy volunteers after accounting for  and
and  using compartmental modeling (published in abstract form (36)). The whole-lung SUV normalized for the CT-determined air fraction has also been explored in patients with COPD with emphysema but has not been compared with tissue-based or clinical outcome measures (39). Finally, both infections and allergens frequently trigger asthma and COPD exacerbations. KiN likely increases with both triggers, as has been shown in lung transplant recipients with infection (62) and in subjects with asthma after allergen challenge (8,24). Therefore, 18F-FDG PET scans will need to be obtained during periods of clinical stability to study the accuracy of different quantitative parameters for measuring lung disease-specific inflammation. These studies together highlight the need to continue defining the relationship of the different 18F-FDG PET quantitative parameters to outcome measures to determine which metrics are the best surrogate measures of inflammation.
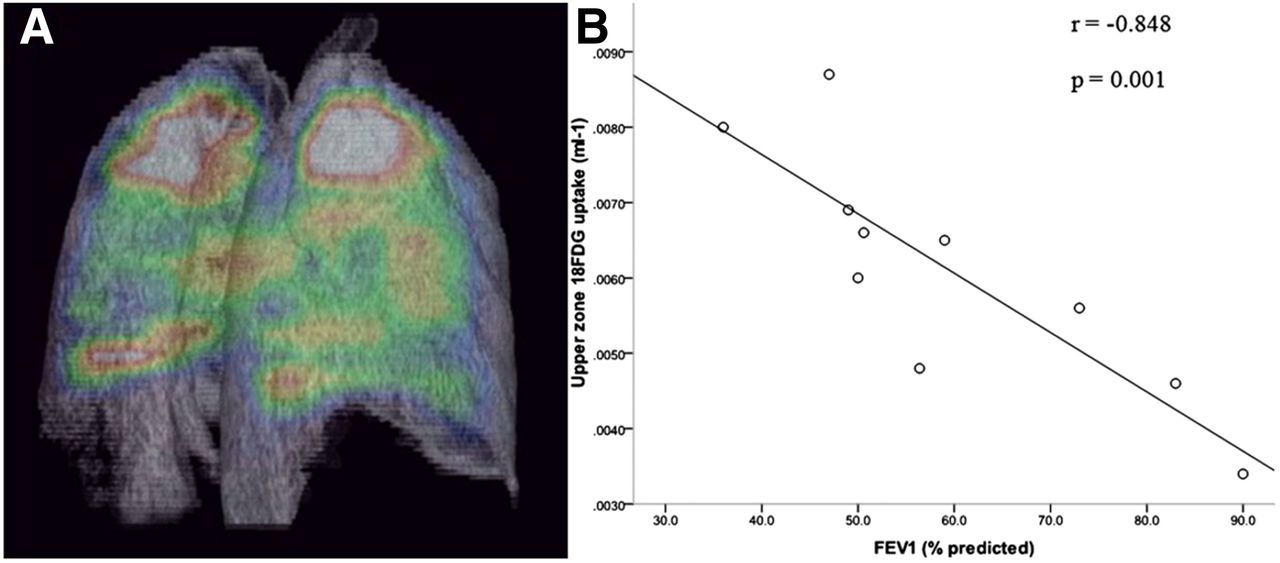
Increased intercept-normalized Patlak Ki in upper lobes of lungs of COPD patients correlates inversely with pulmonary function testing. (A) Three-dimensional imaging illustrating predominantly apical distribution of pulmonary 18F-FDG uptake in patient with COPD. Maximum signal of this color spectrum is represented by white, and minimum signal by black. (B) Relationship between upper-zone 18F-FDG uptake and forced expiratory volume in 1 s (FEV1) (percentage predicted) in COPD group (n = 10). One-tailed P value is shown. (Reprinted with permission of (17).)
Interstitial Lung Diseases/IPF
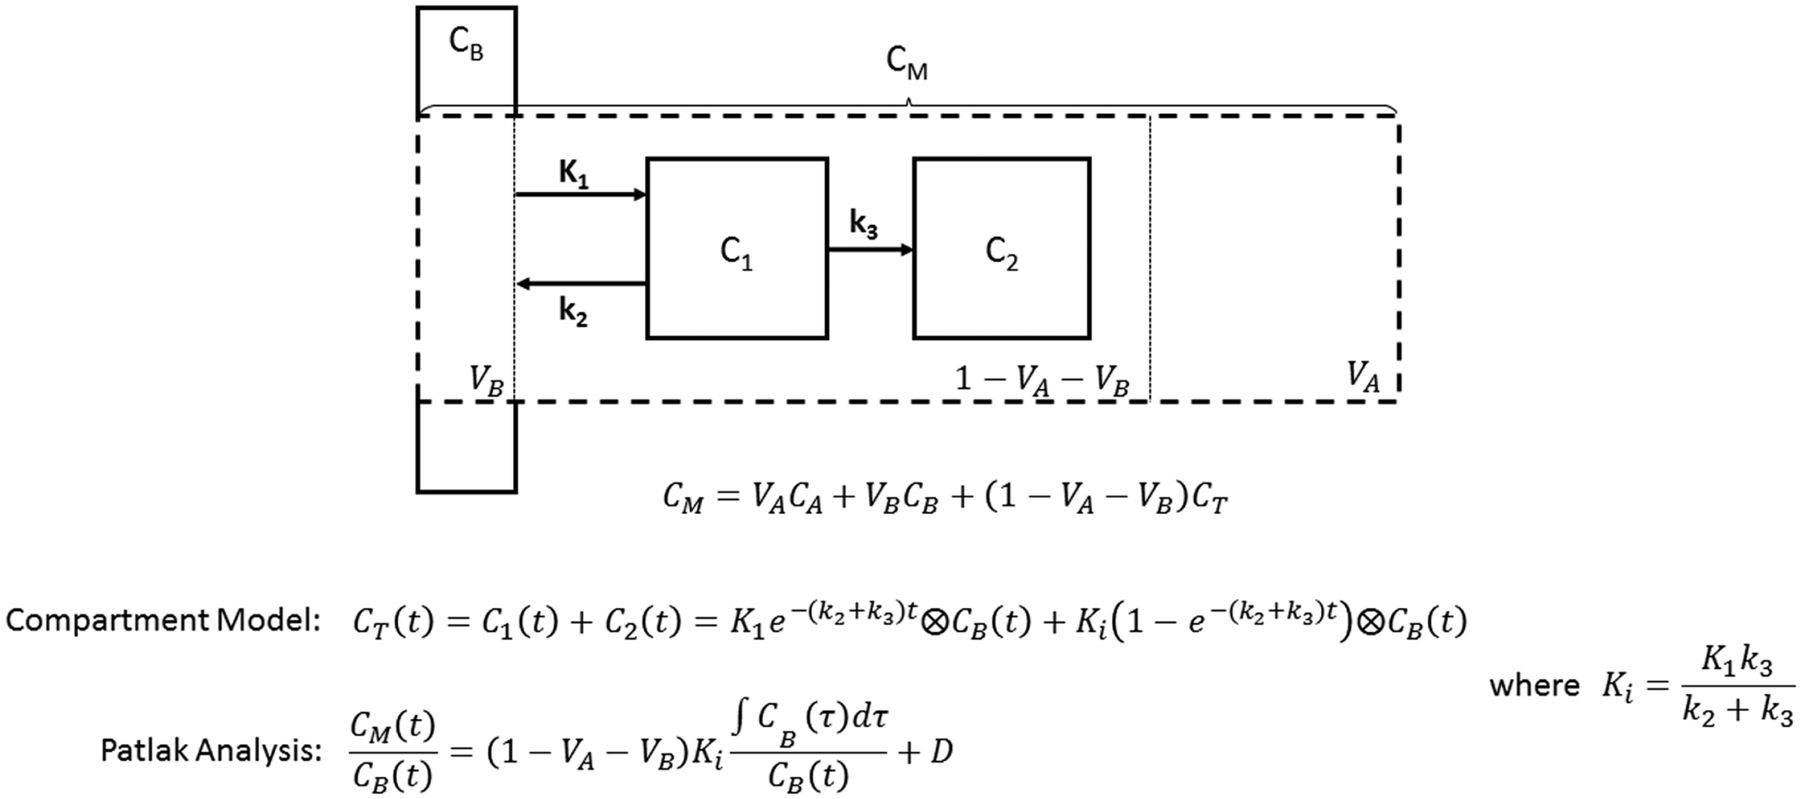
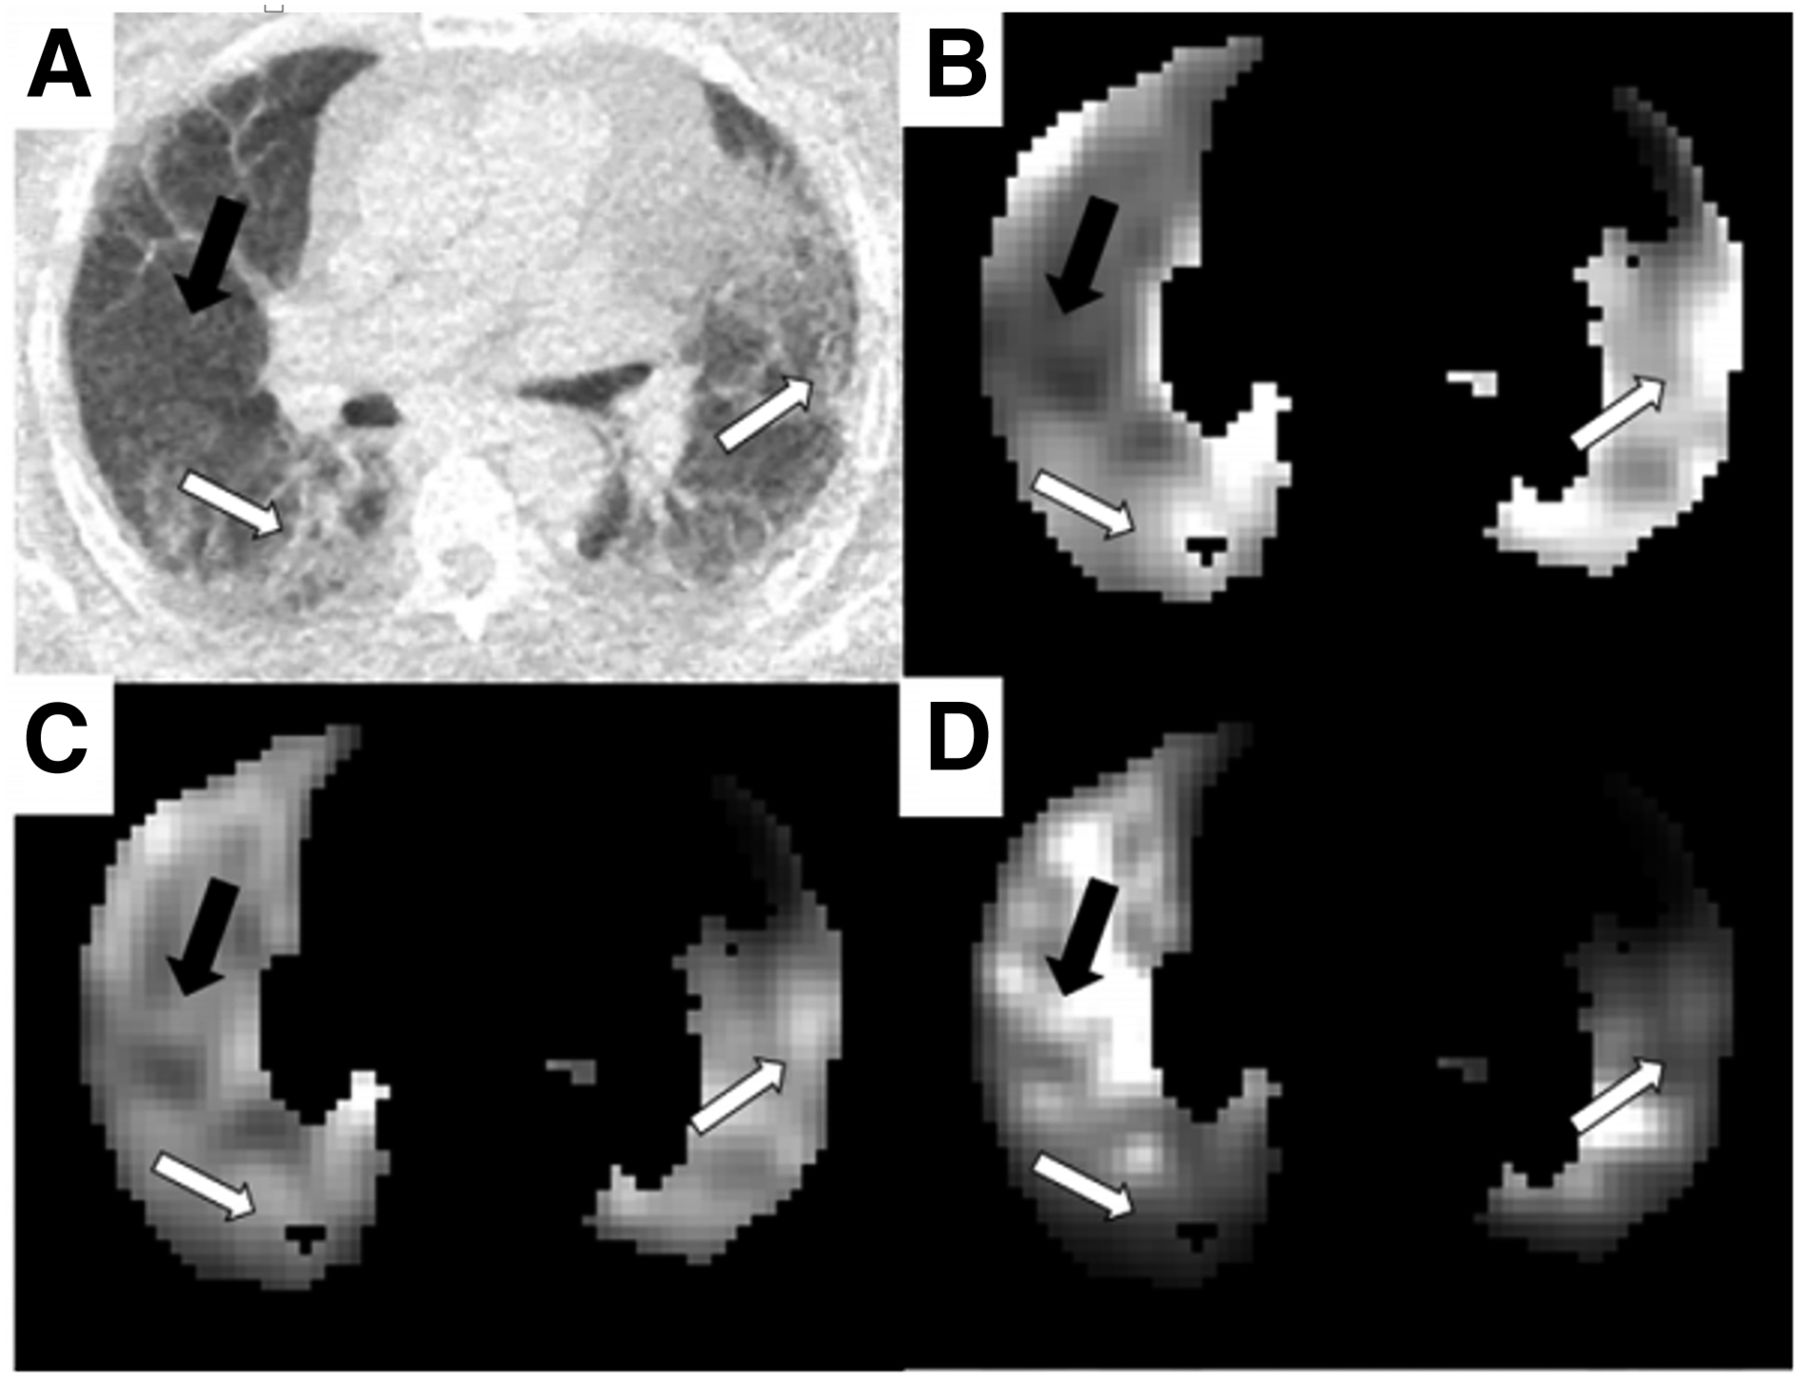
Increased 18F-FDG uptake has been reported in the lungs of patients with IPF using the SUVmax with or without correction for the air fraction determined by CT (11,22,23,38). A study using dual-time-point imaging further demonstrated that persistently increased 18F-FDG uptake predicted a more rapid decline in lung function and higher mortality in patients with IPF (40). Glucose transporter 1 is expressed on erythrocytes and inflammatory cells in lung sections from patients with IPF, with positive erythrocyte but no inflammatory cell staining at sites of angiogenesis (63). Catabolism genes associated with increased glucose metabolism have increased expression by microarray analysis of human IPF samples (64). These data together support the potential clinical relevance of measuring 18F-FDG uptake in this disease. However, a modeling analysis using Equation 1 actually showed decreased 18F-FDG uptake in the fibrotic areas of the lung compared with areas that appeared normal by CT when accounting for  and
and  (Fig. 4) (21). These findings still need to be compared with a similar analysis of healthy lungs, but they highlight how these modeling approaches can change the interpretation of 18F-FDG uptake in IPF. Additionally, improved registration methods are needed to accurately correct for attenuation changes in the periphery, where fibrosis typically occurs. Collectively, these results highlight the need for a gold standard comparator to validate the most relevant 8F-FDG parameters for IPF.

Patlak Ki parametric images from IPF patient undergoing dynamic 18F-FDG study. (A) CT image displaying regions of obvious fibrosis (white arrows) and region of normal-appearing tissue (black arrow). (B–D) Patlak parametric images before air and blood correction (B), after air fraction correction (C), and after air and blood fraction correction (D). All images have been normalized such that they can be shown on same arbitrary gray scale. Images have been masked to show only lung. (Reprinted from (21).)
ISSUES AND SUGGESTED CONSIDERATIONS
The methodologic issues discussed above highlight the need for further studies to determine and validate the most appropriate approaches for lung imaging. Based on discussions among the authors, the following summary statements were created to capture the key aspects that should be considered for future validation studies.
PET measurements of 18F-FDG concentration in the lung are influenced by the relative volumes of lung cells, air, blood, and water.
It is essential to understand how the different methodologies account for the relative volumes of air, blood, and water when analyzing PET data to obtain measurements of 18F-FDG concentration or kinetic parameters in the lungs.
Relative air, blood, and water volumes vary within the lung significantly among respiratory diseases and may depend on disease severity. Without correction, these differences can potentially cause significant variation in the quantified 18F-FDG PET signal.
Although the KiN has been used as the endpoint in many previous publications on lung 18F-FDG uptake, it does not adequately account for the impact of air and blood.
Compartmental modeling is a standard methodology for PET image analysis that can be applied to lung 18F-FDG data. Using CT data to estimate the air fraction and a kinetic model to account for the blood fraction, it is possible to quantify the glucose metabolic rate for all remaining lung components (i.e., lung cells and water) with 18F-FDG. The compartment model may need modification to account for increased water (i.e., in ARDS). However, no complete modeling solution that includes air, blood, and water fraction corrections has yet been tested.
CONCLUSION
Investigating 18F-FDG uptake and kinetics in diffuse lung diseases is becoming more common for phenotyping, monitoring disease progression, and assessing the efficacy of novel targeted treatments. For this purpose, ideally 18F-FDG uptake is measured specifically in the lung cells that contribute to disease pathogenesis. However, regional variations in air, blood, and water fractions can lead to inaccurate estimates of the lung cell tracer concentration. Without accounting for these effects, PET quantification accuracy is compromised and could confound the correct interpretation of the PET parameters in the context of the known biology.
To improve confidence in lung PET quantification, validation of methods to account for air, blood, and water fractions using independent techniques would be desirable. For example, the data provided by serial 15O-CO, 15O-H2O, and dynamic 18F-FDG imaging in the same imaging session would provide increased confidence in the estimated blood and water volumes (37). Furthermore, the reproducibility and reliability of these outcome measures will need to be assessed in patients with a range of diffuse lung diseases and in healthy controls. Finally, comparison with clinical information, such as that from CT, lung tissue sampling, or pulmonary function testing, can provide additional context for correctly interpreting PET quantification parameters. These are recommended as examples of future work to promote the standardization of PET analysis methods for lung imaging.
The conclusions laid out in this paper point to the need for a lung imaging collaboration that encourages data and protocol sharing. This will allow validation across the range of lung diseases to be studied, ultimately producing a standardized acquisition and processing methodology. Although not discussed as a focus of this review, these collaborative efforts will also facilitate the evaluation of the most appropriate reconstruction and motion correction algorithms and imaging protocols to optimize lung PET imaging. These efforts will ensure that accurate, reproducible, and clinically interpretable images and estimated parameters can be produced together with the requisite clinical validation before use in clinical trials of established or novel therapies.
Footnotes
Published online Jan. 12, 2017.
Learning Objectives: On successful completion of this activity, participants should be able to (1) describe the methods that have been used to quantify 18F-FDG uptake in the lungs using dynamic PET; (2) discuss the interpretation of the outcomes from these methods; and (3) provide suggested considerations on quantification of 18F-FDG uptake in the lungs for future studies.
Financial Disclosure: Dr. Cheriyan’s salary is funded in part by GlaxoSmithKline for clinical research. Dr. Lee is a consultant to GlaxoSmithKline. Drs. Mohan and Tal-Singer and Mr. Wilson are employees and shareholders of GlaxoSmithKline. Mr. Wilson was previously a consultant to ECNP R&S, GlaxoSmithKline, IPPEC, King’s College London, Lundbeck A/S, Mentis Cura Ehf, and Pfizer, Inc., and has received travel expenses as a guest speaker from Orion Pharma Ltd. Dr. Wellen is an employee and shareholder of Pfizer. Dr. Gunn is a consultant for Abbvie, Biogen, GlaxoSmithKline, UCB, Roche, and Genentech, S.A. Drs. Groves, Holman, Thielemans, and Hutton have research grants from GlaxoSmithKline and receive funding from the National Institute for Health Research University College London Hospitals Biomedical Research Centre. Dr. Chen receives funding from the National Institutes of Health (R01 HL121218). Drs. Cheriyan and Wilkinson receive funding from the National Institute of Health Research (NIHR) Cambridge Comprehensive Biomedical Research Centre. Dr. Gunn is an employee of Imanova and Imperial College London. Dr. Coello is an employee of Imanova. The authors of this article have indicated no other relevant relationships that could be perceived as a real or apparent conflict of interest.
CME Credit: SNMMI is accredited by the Accreditation Council for Continuing Medical Education (ACCME) to sponsor continuing education for physicians. SNMMI designates each JNM continuing education article for a maximum of 2.0 AMA PRA Category 1 Credits. Physicians should claim only credit commensurate with the extent of their participation in the activity. For CE credit, SAM, and other credit types, participants can access this activity through the SNMMI website (http://www.snmmilearningcenter.org) through February 2020.
- © 2017 by the Society of Nuclear Medicine and Molecular Imaging.
REFERENCES
- Received for publication December 1, 2016.
- Accepted for publication January 10, 2017.


Jump to section
Related Articles
Cited By...
- High-Temporal-Resolution Kinetic Modeling of Lung Tumors with Dual-Blood Input Function Using Total-Body Dynamic PET
- High-Temporal-Resolution Lung Kinetic Modeling Using Total-Body Dynamic PET with Time-Delay and Dispersion Corrections
- Perspective on Fibroblast Activation Protein-Specific PET/CT in Fibrotic Interstitial Lung Diseases: Imaging Fibrosis--A New Paradigm for Molecular Imaging?
- Quantification of the {alpha}v{beta}6 Integrin by PET/CT Imaging in the Lungs of Patients After SARS-CoV2 Infection and Comparison to Fibrotic Lungs
- Fibrometabolism--An emerging therapeutic frontier in pulmonary fibrosis
- Quantitative 18F-fluorodeoxyglucose positron emission tomography/computed tomography to assess pulmonary inflammation in COPD
- Chronic lung diseases: prospects for regeneration and repair
- Consensus Recommendations on the Use of 18F-FDG PET/CT in Lung Disease
- Comparison of Static and Dynamic 18F-FDG PET/CT for Quantification of Pulmonary Inflammation in Acute Lung Injury
- A randomised, placebo-controlled study of omipalisib (PI3K/mTOR) in idiopathic pulmonary fibrosis
- [18F]Fluorocholine and [18F]Fluoroacetate PET as Imaging Biomarkers to Assess Phosphatidylcholine and Mitochondrial Metabolism in Preclinical Models of TSC and LAM