


Abstract
In this study we investigated the feasibility of using radionuclide accumulation mediated by the human sodium iodide symporter (hNIS) gene in conjunction with various imaging modalities as a reporter system to noninvasively monitor the expression of transgenes delivered for gene therapy. Methods: NIS-expressing adenovirus (Ad-hNIS) was delivered in vitro to MB-435 breast carcinoma cells. NIS-mediated accumulation of 125I−, 99mTcO4−, and 76Br− by the cells was visualized using autoradiography, γ-camera scintigraphy, and PET imaging, respectively. Results: For all imaging modalities, signal intensity generated by the cells correlated linearly both with the amount of Ad-hNIS and with the activity of radionuclide added to the cells. Conclusion: hNIS-mediated cellular accumulation of radionuclide was clearly visualized by all 3 imaging modalities tested. This preliminary study demonstrates the feasibility of using hNIS for monitoring the location and magnitude of expression of genes delivered during gene therapy.
One of the major limitations in clinical gene therapy trials is the difficulty in quantitatively detecting gene expression in vivo after administration of the gene delivery vector. The ideal detection method should be noninvasive and reproducible over time to provide information regarding the location, magnitude, and kinetics of gene expression in real time (1). Of the various methods currently developed for in vivo gene detection, reporter genes and detectable reporter substrates appear to be the best suited for studies of animal and human subjects (2).
The sodium iodide symporter (NIS) is one of these promising reporter genes. Though it has been known for decades that iodide transport into the thyroid gland is mediated by a specific sodium-dependent iodide transporter, not until 1996 were both rat and human NIS complementary DNA (cDNA) cloned and characterized (3,4). After the molecular cloning of NIS, the ability to confer iodide-accumulating ability to cells transduced with the NIS gene was demonstrated (5–9). Several studies have shown that expression of NIS can be monitored noninvasively through NIS-mediated accumulation of radionuclide, including 99mTcO4−, 123I−, and 124I− (2,7,10,11). Here, we investigate the use of several modalities for monitoring NIS gene expression, including phosphor imaging, γ-camera scintigraphy, and PET. In addition, we report the construction of a dual-expressing adenovirus to investigate the feasibility of using hNIS as a reporter gene to monitor expression of other coexpressed genes.
MATERIALS AND METHODS
Cell Culture
The cell line MDA-MB-435 was obtained from American type Culture Collection. All cells were cultured in RPMI 1640 medium with Glutamax-I supplemented with 10% fetal bovine serum, 100 IU/mL penicillin, and 100 mg/L streptomycin (GIBCO) at 37°C, in a 95% air/5% CO2 atmosphere.
Construction of Adenovirus for Transfer of NIS Gene
The pcDNA3 plasmid containing full-length human NIS (hNIS) was a kind gift from Sissy Jhiang (The Ohio State University, Columbus, OH). Full-length hNIS cDNA was digested from this plasmid and ligated into the pacAd5 cytomegalovirus (CMV) K-N pA shuttle vector. The presence of hNIS in the E1 deleted region was confirmed by sequencing. This vector was then linearized and recombined with pTG3602 adenoviral backbone in BJ5183 bacteria. The recombined adenoviral backbones were then linearized with Pac I and transfected into HEK 293 cells. Adenovirus expressing hNIS (Ad-hNIS) was harvested after 7 d and purified in a CsCl2 gradient by ultracentrifugation. The hNIS and eGFP (green fluorescent protein) coexpressing adenovirus (Ad-hNIS-eGFP) was constructed by recombining the hNIS-containing shuttle vector with pTG3602-eGFP adenoviral backbone that contains eGFP in the E3 position. For experiments in which an adenoviral control was needed, Ad-Bgl II, which lacks the CMV promoter and has deleted E1 and E3 regions, was used.
Radiolabeling of Cultured Cells
Equal numbers of MB-435 cells were seeded in 12-well plates to achieve between 5 × 10⁵ and 1 × 10⁶ cells per well at the time of viral infection. Twelve hours after plating, cells were infected with varying multiplicity of infection ([MOI] the ratio of infectious viral particles to cells) of adenovirus. Thirty hours later, radionuclides were added to each well as described below. After a 1-h incubation with radioiodide, cells were washed once with phosphate-buffered saline (PBS) to remove extracellular radioactivity and then images were acquired by the various modalities.
A second set of experiments were performed using each imaging modality in which viral titer was held constant and the amount of added radionuclide was varied. Twelve hours after plating, cells were infected with 20 MOI of Ad-hNIS. Thirty hours later, increasing amounts of the various radionuclides were added to the cells and the experiment was performed as above.
Image Acquisition Using Various Modalities
For autoradiography, Ad-NIS-infected cells were labeled with 0.037 MBq per well of 125I−, washed, and then exposed overnight on a phosphor imaging screen (Amersham Biosciences). The signal intensity for each pixel was calculated using a Typhoon 8600 Variable Mode Imager (Amersham Biosciences).
For γ-camera scintigraphy, cells were labeled with 9.25 MBq per well of 99mTcO4− pertechnetate, washed, and then a γ-camera scan was performed using the following parameters: 256 × 256 matrix, 5-min acquisition time. Signal intensities were determined by outlining regions of interest (ROIs) in each well and are expressed as counts per minute (cpm).
For PET imaging, cells were labeled with 0.130 MBq per well of 76Br−, washed, and then imaged. Before PET imaging, a nylon plug was inserted into the wells of each 12-well plate. Plates were positioned vertically and affixed to a 5.1-cm (2-in.)-thick nylon block. The nylon block and plugs were used to provide a reaction medium for the high-energy positron emissions of the 76Br−. This assembly was centered over the third slice of the 15-slice 4096 Plus PET scanner (General Electric Medical Systems). Transmission imaging was then performed (approximately 2 million counts). Emission imaging commenced with frame lengths from 1 min to 2 h, which were subsequently summed to create a single dataset. Total imaging time was 2,243 min. No decay correction was performed. The emission image was reconstructed using a Butterworth filter (order, 6; frequency, 0.35 Nyquist) and 2-mm pixels into a 128 × 128 matrix. ROIs were defined on the transmission image and then transferred to the summed emission image. The mean and maximum pixel values (in counts/pixel) for each ROI were determined.
Measurement of eGFP Signal
Equal numbers of MB-435 cells were seeded in 12-well plates to achieve between 5 × 10⁵ and 1 × 10⁶ cells per well at the time of viral infection. Twenty-four hours after plating, cells were infected with the appropriate increasing MOI of Ad-hNIS-eGFP. After 30 h of incubation with adenovirus, cells were trypsinized, pelleted, and resuspended in PBS in a concentration of 1 × 10⁶ cells per mL. eGFP signal was then measured by flow cytometry.
RESULTS
Quantitative analysis of 125I− phosphor imaging demonstrated that iodide accumulation increased with increasing hNIS adenovirus titer (Fig. 1A). A linear relationship existed between adenovirus titer and iodide uptake when Ad-hNIS titer ranged from 0 to 20 MOI (R2 = 0.994; P < 0.001). At higher titers the relationship became nonlinear as radioiodide uptake appeared to saturate with increasing viral titer. These results likely represent saturation of the symporter as they are seen with multiple imaging modalities. Radioiodide accumulation also correlated tightly with the activity of added 125I− when adenoviral titer was held constant at 25 MOI (R2 = 0.996; P < 0.001; Fig. 1B).

Imaging of hNIS gene transfer using 125I− and autoradiography. (A) Upper panel demonstrates the high correlation between average pixel intensity per well and Ad-hNIS viral titer. Bold line denotes linear regression from 0 to 20 MOI. Lower panel shows increasing signal of autoradiographs with increasing Ad-hNIS titer. (B) Upper panel demonstrates the high correlation that exists between average pixel intensity per well and activity of added 125I−. Line denotes linear regression of pixel intensity per well vs. 125I− activity. Lower panel shows increasing signal intensity with increasing 125I− activity in MB-435 cells infected with 25 MOI of Ad-hNIS. Data are expressed as the mean ± SD of 3 replicates and are representative of at least 3 separate experiments.
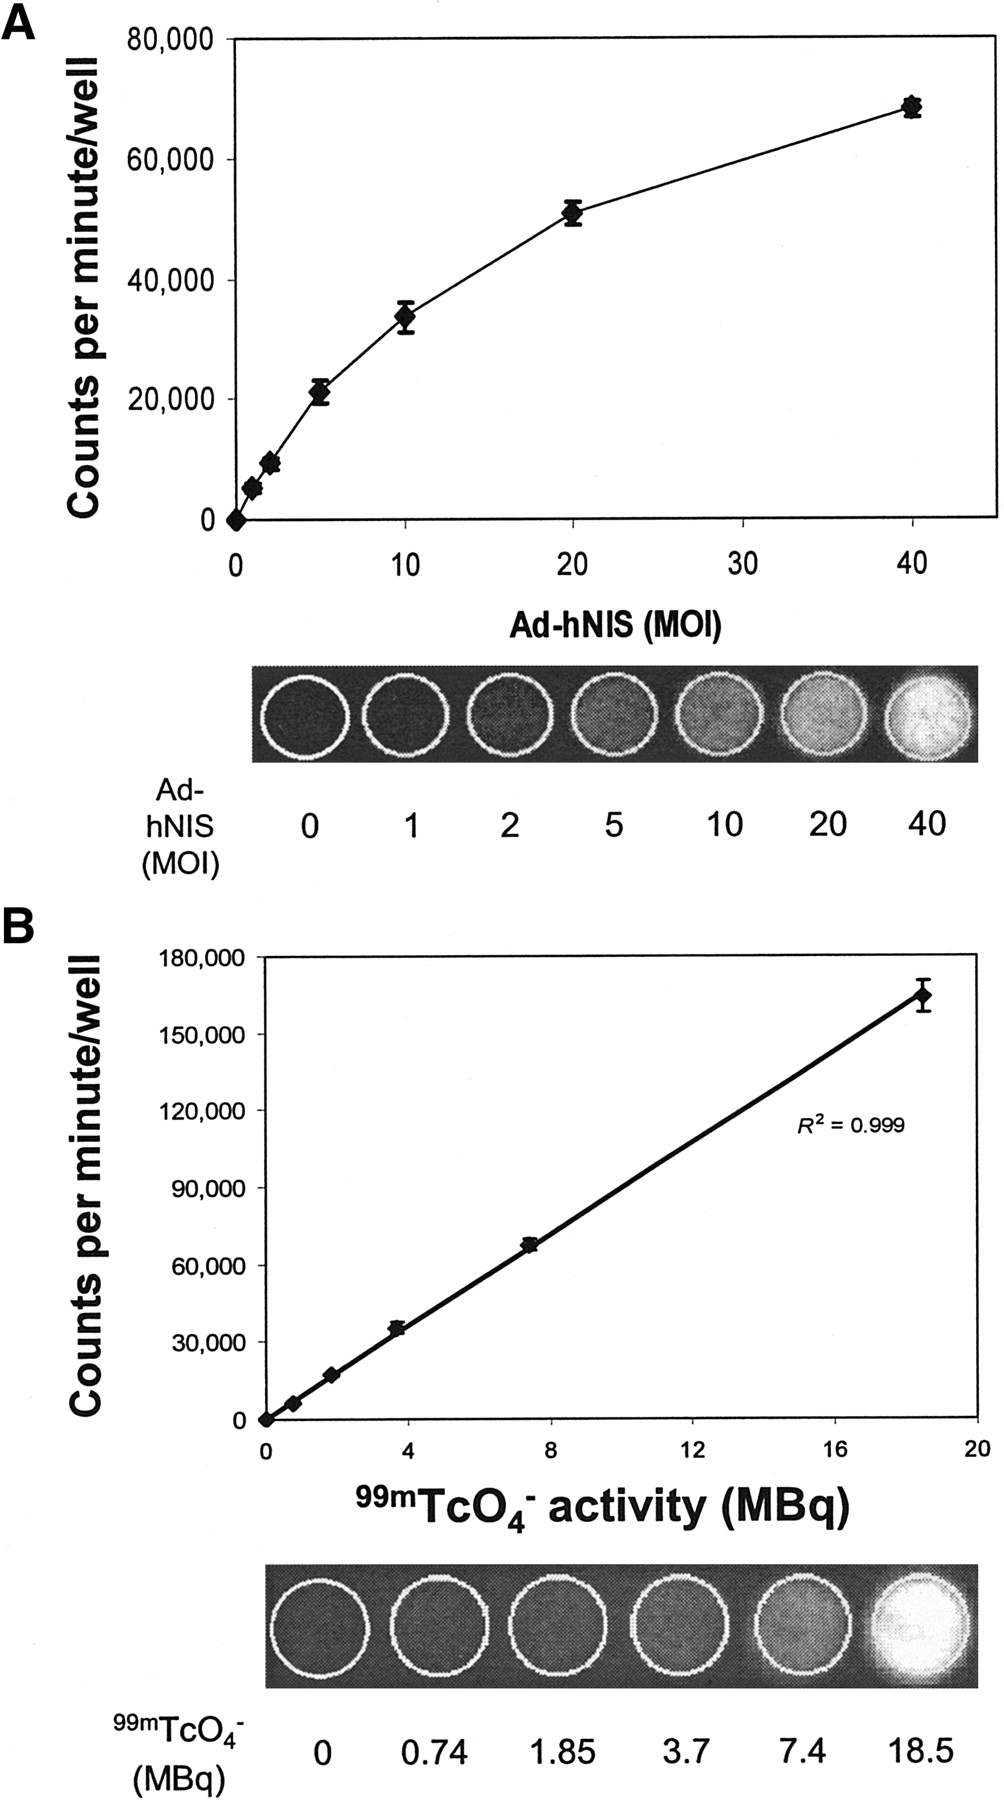
γ-Camera imaging clearly visualized cell-associated 99mTcO4− accumulation. 99mTcO4− uptake by Ad-hNIS-infected MB-435 cells increased with increasing adenovirus titer (Fig. 2A). A linear relationship with high correlation (R2 = 0.999; P < 0.001) existed between γ-camera signal intensity and the activity of 99mTcO4− added to each well (Fig. 2B).

Imaging of hNIS gene transfer using 99mTcO4− and γ-camera scintigraphy. (A) Upper panel demonstrates the positive correlation between cpm per well and Ad-hNIS viral titer. Lower panel shows γ-camera images with increasing signal as adenovirus titer is increased. (B) Upper panel demonstrates the high correlation between cpm per well and activity of added 99mTcO4−. Line shows linear regression of cpm per well vs. 99mTcO4− activity. Lower panel shows γ-camera images of Ad-hNIS-infected MB-435 cells. Signal increased with increasing activities of 99mTcO4− at a fixed viral titer. Data are expressed as the mean ± SD of 3 replicates and are representative of at least 3 separate experiments.
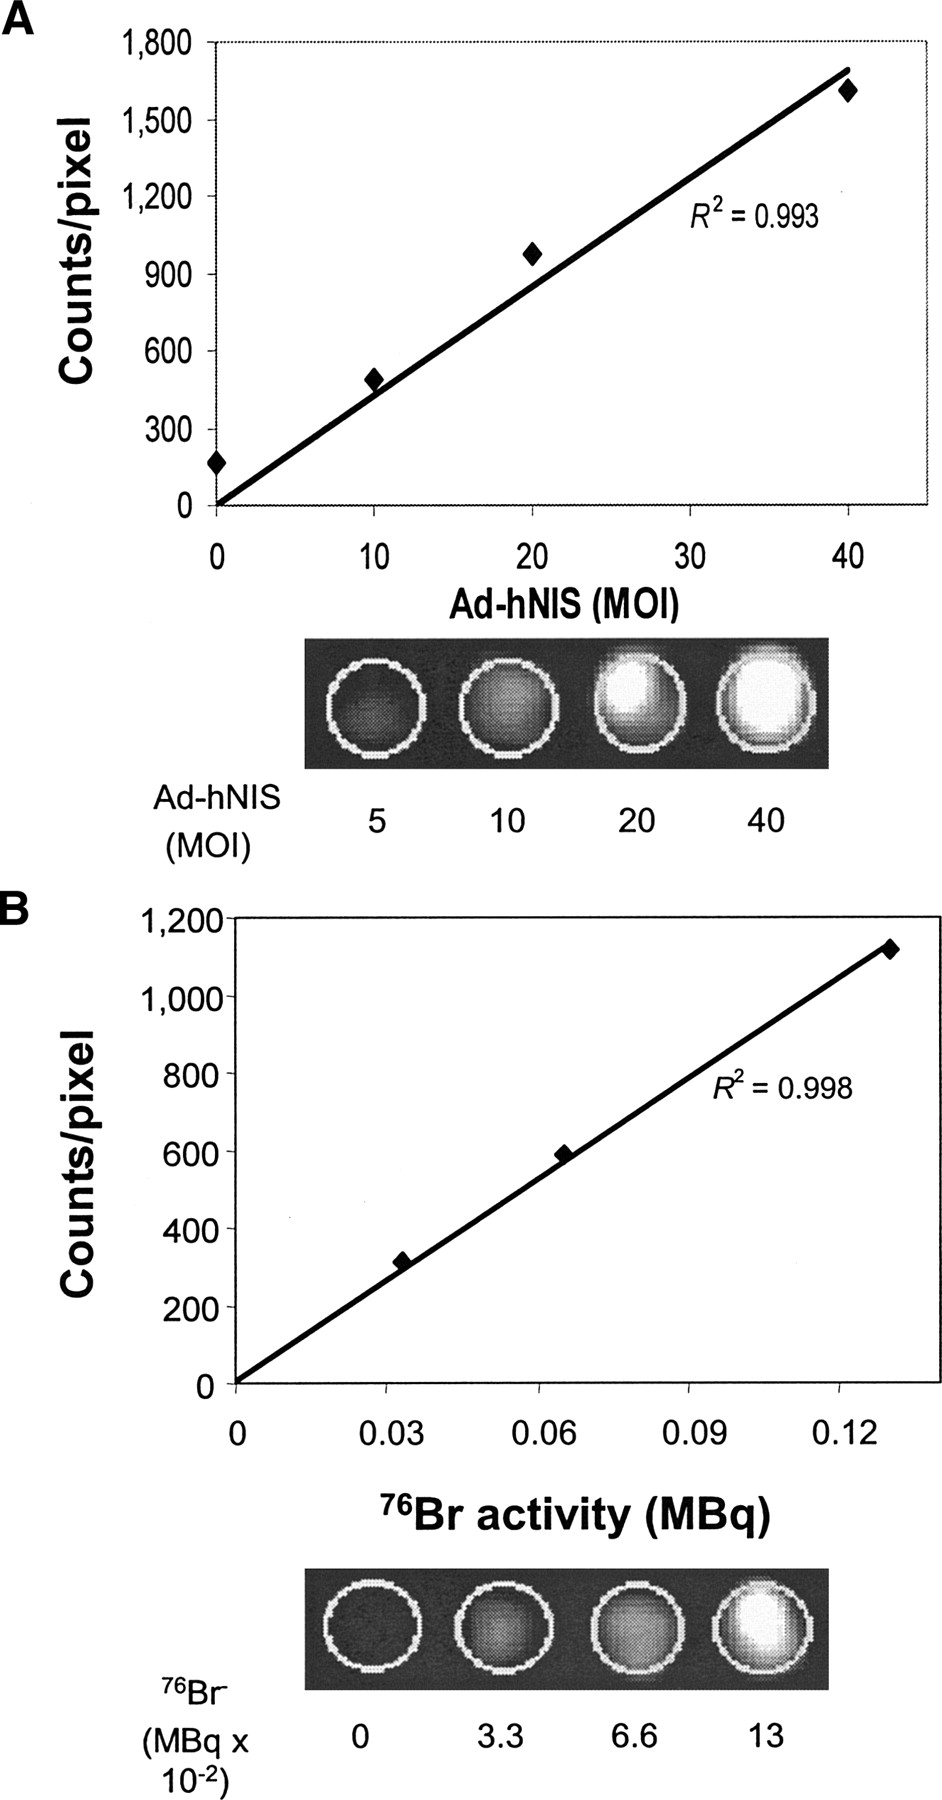
PET was able to image cell-associated 76Br− in Ad-hNIS-infected MB-435 cells. A tightly correlated linear relationship existed between the mean pixel value and Ad-hNIS titer (R2 = 0.993; Fig. 3A) and also between the mean pixel value and activity of added 76Br− (R2 = 0.998; Fig. 3B). The maintenance of linearity at higher viral titers that was achieved in Figures 1 and 2 could be because the affinity of the symporter for bromide is nearly 3 orders of magnitude lower than that for iodide.

Imaging of hNIS gene transfer using 76Br− and PET. (A) Upper panel demonstrates the high correlation between total counts per well and Ad-hNIS titer. Line denotes linear regression. Lower panel shows PET images and increasing signal as adenovirus titer is increased. (B) Upper panel demonstrates high correlation between total counts per well and activity of added 76Br−. Line denotes linear regression. Lower panel shows PET images. Signal increases as 76Br− activity is increased at a fixed viral titer. Data are representative of 2 separate experiments.
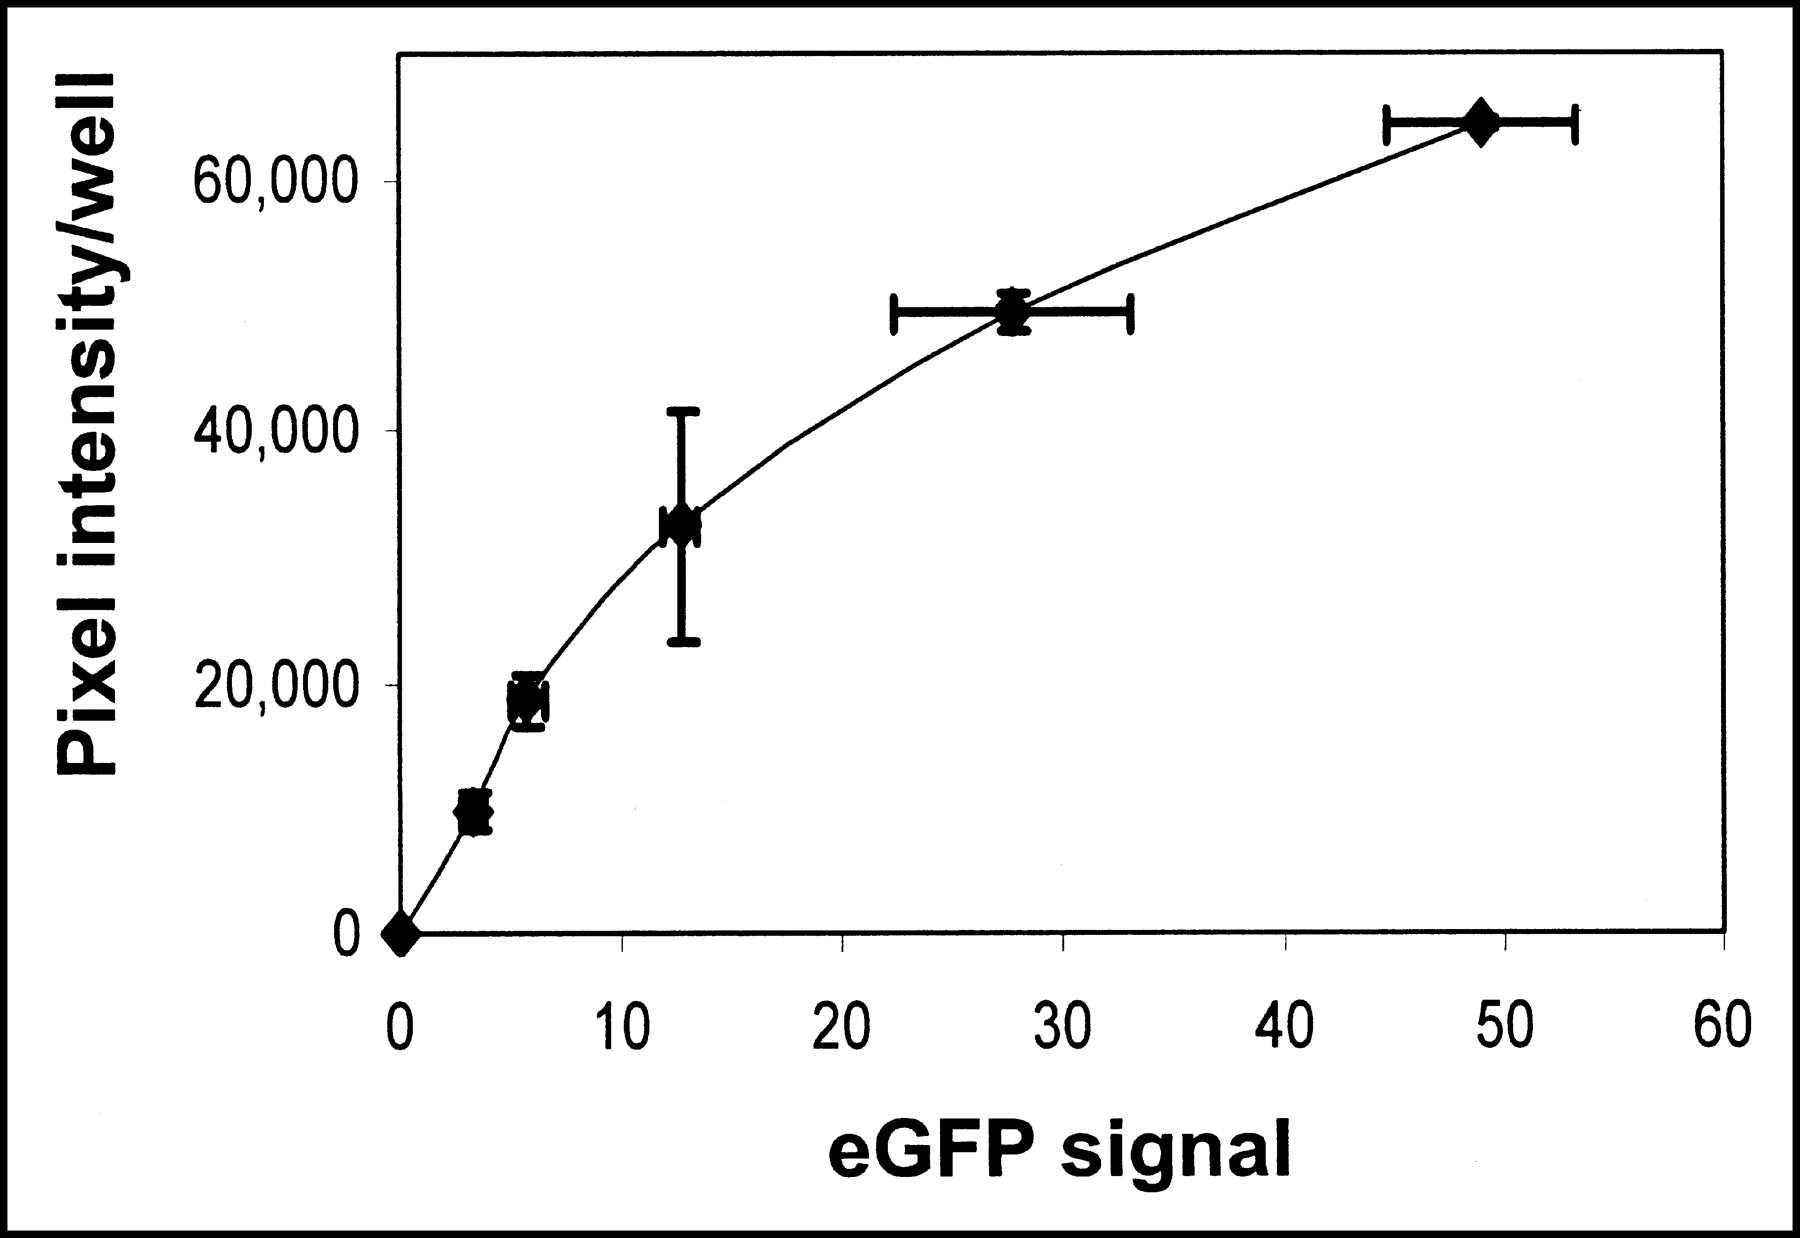
To demonstrate the feasibility of hNIS as a reporter gene to monitor the expression of other coexpressed transgenes, an hNIS and eGFP dual-expressing adenovirus was constructed. As in cells infected with hNIS-expressing adenovirus, hNIS-eGFP-infected MB-435 cells showed increased iodide accumulation with increasing adenovirus titer. eGFP signal intensity also increased linearly with adenovirus titer (data not shown). Iodide accumulation, as determined by phosphor imaging, and eGFP signal intensity were positively related (Fig. 4).

Relationship between NIS-mediated 125I− accumulation (expressed as average pixel intensity per well as determined by autoradiography) and eGFP signal in MB-435 cells infected with dual-expressing Ad-hNIS-eGFP adenovirus. A linear correlation exists up to approximately 20 MOI.
DISCUSSION
Many different imaging techniques have been used for use in detection of in vivo gene expression. Among these, optical imaging techniques possess excellent temporal resolution but poor spatial resolution and depth penetration (12). Nuclear imaging techniques circumvent this limitation (13). They possess high sensitivity but have an inherently limited spatial resolution. MRI techniques can generate spectacular image resolution. However, temporal resolution is limited and molecular probe detection is several orders of magnitude less sensitive than other imaging modalities (14).
The herpes simplex virus 1 thymidine kinase (HSV-1-tk) with positron-labeled 5-iodo-2′-fluoro-2′-deoxy-1-β-d-arabinofuranosyluracil is a popular reporter system used in conjunction with PET imaging (1,15). The use of such compounds can sometimes be hampered by short-lived nuclides and may also require technically demanding radiosynthesis to incorporate the label (2).
Radioiodide treatment of thyroid disease and thyroid imaging are based on the unique capacity of the thyroid to concentrate iodide through the activity of hNIS (16). We demonstrate that transduction of the hNIS gene into breast cancer cells using an adenovirus vector confers iodide-concentrating ability, which is consistent with previous reports (5,9). We demonstrate that Ad-hNIS-infected MB-435 cells are easily visualized using 125I− phosphor imaging. Using quantitative image analysis, we show that iodide uptake correlated with the amount of adenovirus delivered. Furthermore, a linear relationship existed between radioiodide accumulation and the activity of added 125I−.
In addition to iodide isotopes, hNIS also can accumulate other halides and pseudohalides, including Br−, SCN−, ClO3−, ReO4−, and TcO4− (17). We investigated the ability to image cellular 99mTcO4− and 76Br− accumulation by γ-camera and PET imaging, respectively, after infecting cells with Ad-hNIS. Ad-hNIS-infected cells accumulated 99mTcO4− and 76Br− in a manner analogous to 125I−, with a positive correlation with respect to both the adenoviral titer and the amount radionuclide activity added to the cells. Our results demonstrate that γ-camera, SPECT, or PET imaging could be used to monitor not only the location but also the magnitude of hNIS expression.
A reporter gene monitors not only its own expression but also the expression of other transgenes coexpressed with the reporter gene. To investigate the feasibility of NIS as a reporter gene, we constructed a dual-expressing adenoviral vector that expressed both hNIS and eGFP. Our results demonstrate that coexpressing eGFP does not affect the functional activity of hNIS. Ad-hNIS-eGFP-infected MB-435 cells demonstrate the same viral titer- and activity-dependent iodide accumulation as Ad-hNIS-infected cells. The pixel intensity, as determined by phospor imaging with 125I−, and eGFP signal were positively related over the entire range of viral titers tested. Other, more clinically relevant, genes could be cloned relatively easily into the E3 region in place of eGFP. Thus, our hNIS-expressing adenoviral construct could serve as a reporter backbone, ready for the insertion of virtually any gene of interest.
CONCLUSION
This study investigated the possibility of using the hNIS gene as the basis for a reporter system for monitoring the location and magnitude of gene expression during gene therapy. Using the same hNIS-expressing adenoviral vector, we demonstrated the ability to detect and monitor hNIS-mediated cellular radionuclide accumulation by 3 different imaging modalities including phosphor imaging, γ-camera scintigraphy, and PET. This study demonstrates the feasibility of using hNIS as a reporter gene for noninvasively monitoring other coexpressed transgenes delivered during gene therapy.
Acknowledgments
This work was supported by National Institutes of Health grant CA91709. 76Br was provided by Washington University Medical School and was partially funded through National Cancer Institute grant R24 CA86307.
Footnotes
Received May 16, 2003; revision accepted Oct. 9, 2003.
For correspondence or reprints contact: Frederick E. Domann, PhD, Free Radical and Radiation Biology Program, Department of Radiation Oncology, B 180 Med Labs, Iowa City, Iowa 52242.
E-mail: frederick-domann{at}uiowa.edu


