


Abstract
P-glycoprotein (ABCB1) is expressed at the blood–retina barrier (BRB), where it may control distribution of drugs from blood to the retina and thereby influence drug efficacy and toxicity. Methods: We performed PET scans with the ABCB1 substrate (R)-11C-verapamil on 5 healthy male volunteers without and with concurrent infusion of the ABCB1 inhibitor tariquidar. We estimated the rate constants for radiotracer transfer across the BRB (K1, k2) and total retinal distribution volume VT. Results: During ABCB1 inhibition, retinal VT and influx rate constant K1 were significantly, by 1.4 ± 0.5-fold and 1.5 ± 0.3-fold, increased compared with baseline. Retinal efflux rate constant k2 was significantly decreased by 2.8 ± 1.0-fold. Conclusion: We found a significant increase in (R)-11C-verapamil distribution to the retina during ABCB1 inhibition, which provides first in vivo evidence for ABCB1 transport activity at the human BRB. The increase in retinal distribution was approximately 2.5-fold less pronounced than previously reported for the blood–brain barrier.
Similar to the brain, the eye is equipped with sophisticated anatomic structures and specific biochemical properties at its anterior and posterior segments: the blood–aqueous humor barrier and the blood–retina barrier (BRB), respectively, which maintain a regulated and confined environment to accomplish the sensory functions of the eye (1). At the retina, neurons are protected from the blood by two different BRBs both of which are composed of tight-junctional linked cells: the intraretinal capillary endothelial cells (inner BRB) and the retinal pigmental epithelial cells (outer BRB), which greatly restrict paracellular diffusion of molecules. The inner and outer BRB express specific influx and efflux transporters belonging to the solute carrier and adenosine triphosphate–binding cassette (ABC) superfamilies, which control distribution of drugs from blood to the retina and may thus influence the toxicity or the efficacy of drugs (e.g., for treatment of malignant or infectious eye diseases) (2). P-glycoprotein (ABC subfamily B, member 1 [ABCB1]) was shown to be localized in the luminal membrane of the inner BRB, whereas its expression at the outer BRB remains controversial (3). Studies on rodents revealed that ABCB1 can restrict distribution of drugs from blood to the retina but is functionally less important at the BRB than at the blood–brain barrier (BBB) (3,4). For instance, ocular uptake of the ABCB1 substrates verapamil and quinidine was increased to a much smaller extent than brain uptake after pharmacologic ABCB1 inhibition or genetic ABCB1 knockout (3,4). Previous work revealed pronounced species differences between rodents and humans in ABC transporter expression levels at the BBB (5). As opposed to the BBB, the functional importance of ABCB1 at the human BRB is currently poorly understood.
(R)-11C-verapamil is a validated PET tracer to study the transport activity of ABCB1 at the human BBB (6–8). In the present study, we extended the analysis of data from a previously published study on healthy volunteers (8) to assess the influence of ABCB1 on distribution of (R)-11C-verapamil to different ocular tissues.
MATERIALS AND METHODS
Our previously published study (8) was registered with EUDRACT (number 2012-005796-14), approved by the ethics committee of the Medical University of Vienna, and conducted in accordance with the Declaration of Helsinki and its amendments. After giving written informed consent, 5 medication-free healthy men (mean age, 27 ± 3 y) were included into the study. They underwent two consecutive 60-min dynamic (R)-11C-verapamil PET scans on an Advance scanner (GE Healthcare) with arterial blood sampling as described before (8). One hour before the start of the second PET scan, an intravenous infusion of the ABCB1 inhibitor tariquidar (AzaTrius Pharmaceuticals Pvt Ltd.; 3.75 mg/min) was started and maintained until the end of the second PET scan. An arterial plasma input function was constructed by correcting total activity counts in arterial plasma for polar 11C-metabolites of (R)-11C-verapamil as described previously (8). All subjects underwent T1-weighted MR imaging on an Achieva 3.0-T scanner (Philips). Retina, vitreous humor, and eye muscle (Supplemental Table 1; supplemental materials are available at http://jnm.snmjournals.org) were defined as volumes of interest on MR-to-PET coregistered images with PMOD software (version 3.6; PMOD Technologies Ltd.). The vitreous humor and retina volumes of interest exceeded the spatial resolution of the PET images (3.125 × 3.125 × 4.25 mm) by 7- and 21-fold, respectively (Supplemental Table 1). Anatomic structures surrounding these target tissues (e.g., large vessels) did not cause spillover of radioactivity into the volumes of interest.
A standard 2-tissue 4-rate-constant compartment model was fitted to the time–activity curves from 0 to 60 min after radiotracer injection to estimate the influx rate constant of radioactivity from plasma to tissue K1 and the efflux rate constant from tissue k2 as well as total distribution volume (VT), which equals the tissue-to-plasma concentration ratio at steady state (8). The vascular volume fraction in tissue was included as a fitting parameter. To obtain a model-independent estimate of VT, Logan graphical analysis was performed (9). Moreover, the first 10 min of the PET data were modeled with a 1-tissue 2-rate-constant compartment model (10). All data are given as mean ± SD. Differences in the outcome parameters of scans 1 and 2 were tested using the Wilcoxon signed rank test (Statistica 6.1; StatSoft Inc.), whereby a P value of less than 0.05 was considered statistically significant.
RESULTS
We performed (R)-11C-verapamil PET scans on 5 healthy volunteers without and with concurrent tariquidar infusion at a dose that almost completely inhibits ABCB1 at the human BBB (8). On the PET images (Fig. 1), retina and vitreous humor were outlined as ocular volumes of interest and eye muscle was selected as a control tissue that is not protected by the BRB. Moreover, distribution of (R)-11C-verapamil to ocular tissues was compared with its brain distribution. Time–activity curves of (R)-11C-verapamil were increased in retina and brain during ABCB1 inhibition as compared with baseline scans, whereas time–activity curves in vitreous humor and eye muscle remained unchanged (Fig. 2).
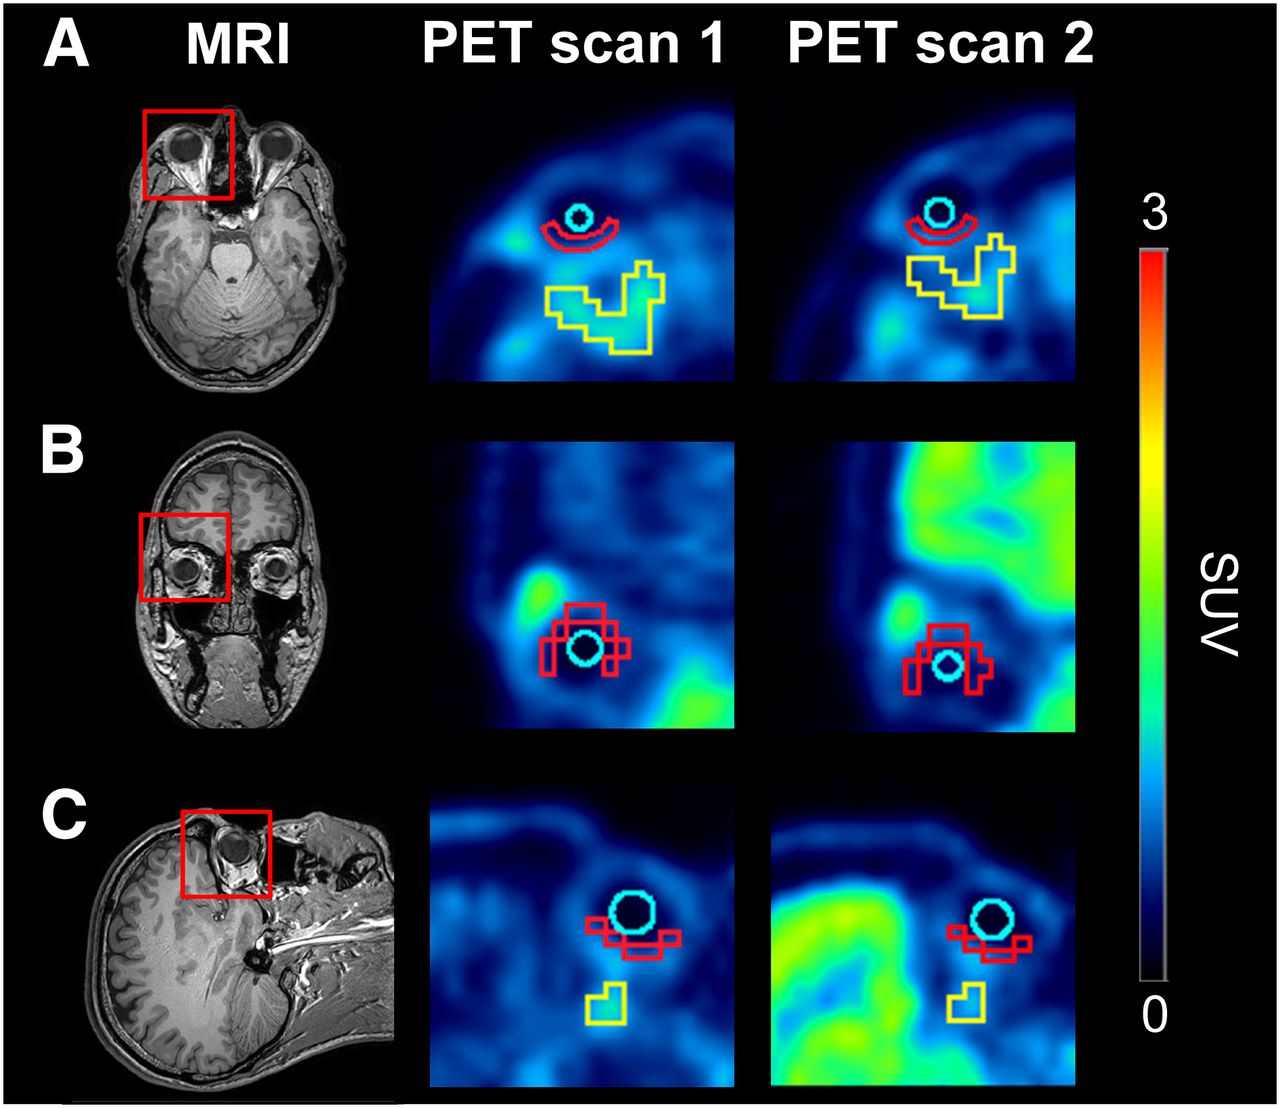
Axial (A), coronal (B), and sagittal (C) planes of MR and PET average images (0–60 min) at baseline (scan 1) and during ABCB1 inhibition (scan 2). Red rectangles on MR images indicate magnified area on PET images. Representative regions of interest are shown in PET images for retina (red), vitreous humor (turquoise), and eye muscle (yellow). Radiation scale is expressed as SUV and set from 0 to 3.

Mean time–activity curves (SUV ± SD, n = 5) in retina (A), whole-brain gray matter (B), vitreous humor (C), and eye muscle (D) for baseline scans (open circles) and scans during ABCB1 inhibition (solid circles).
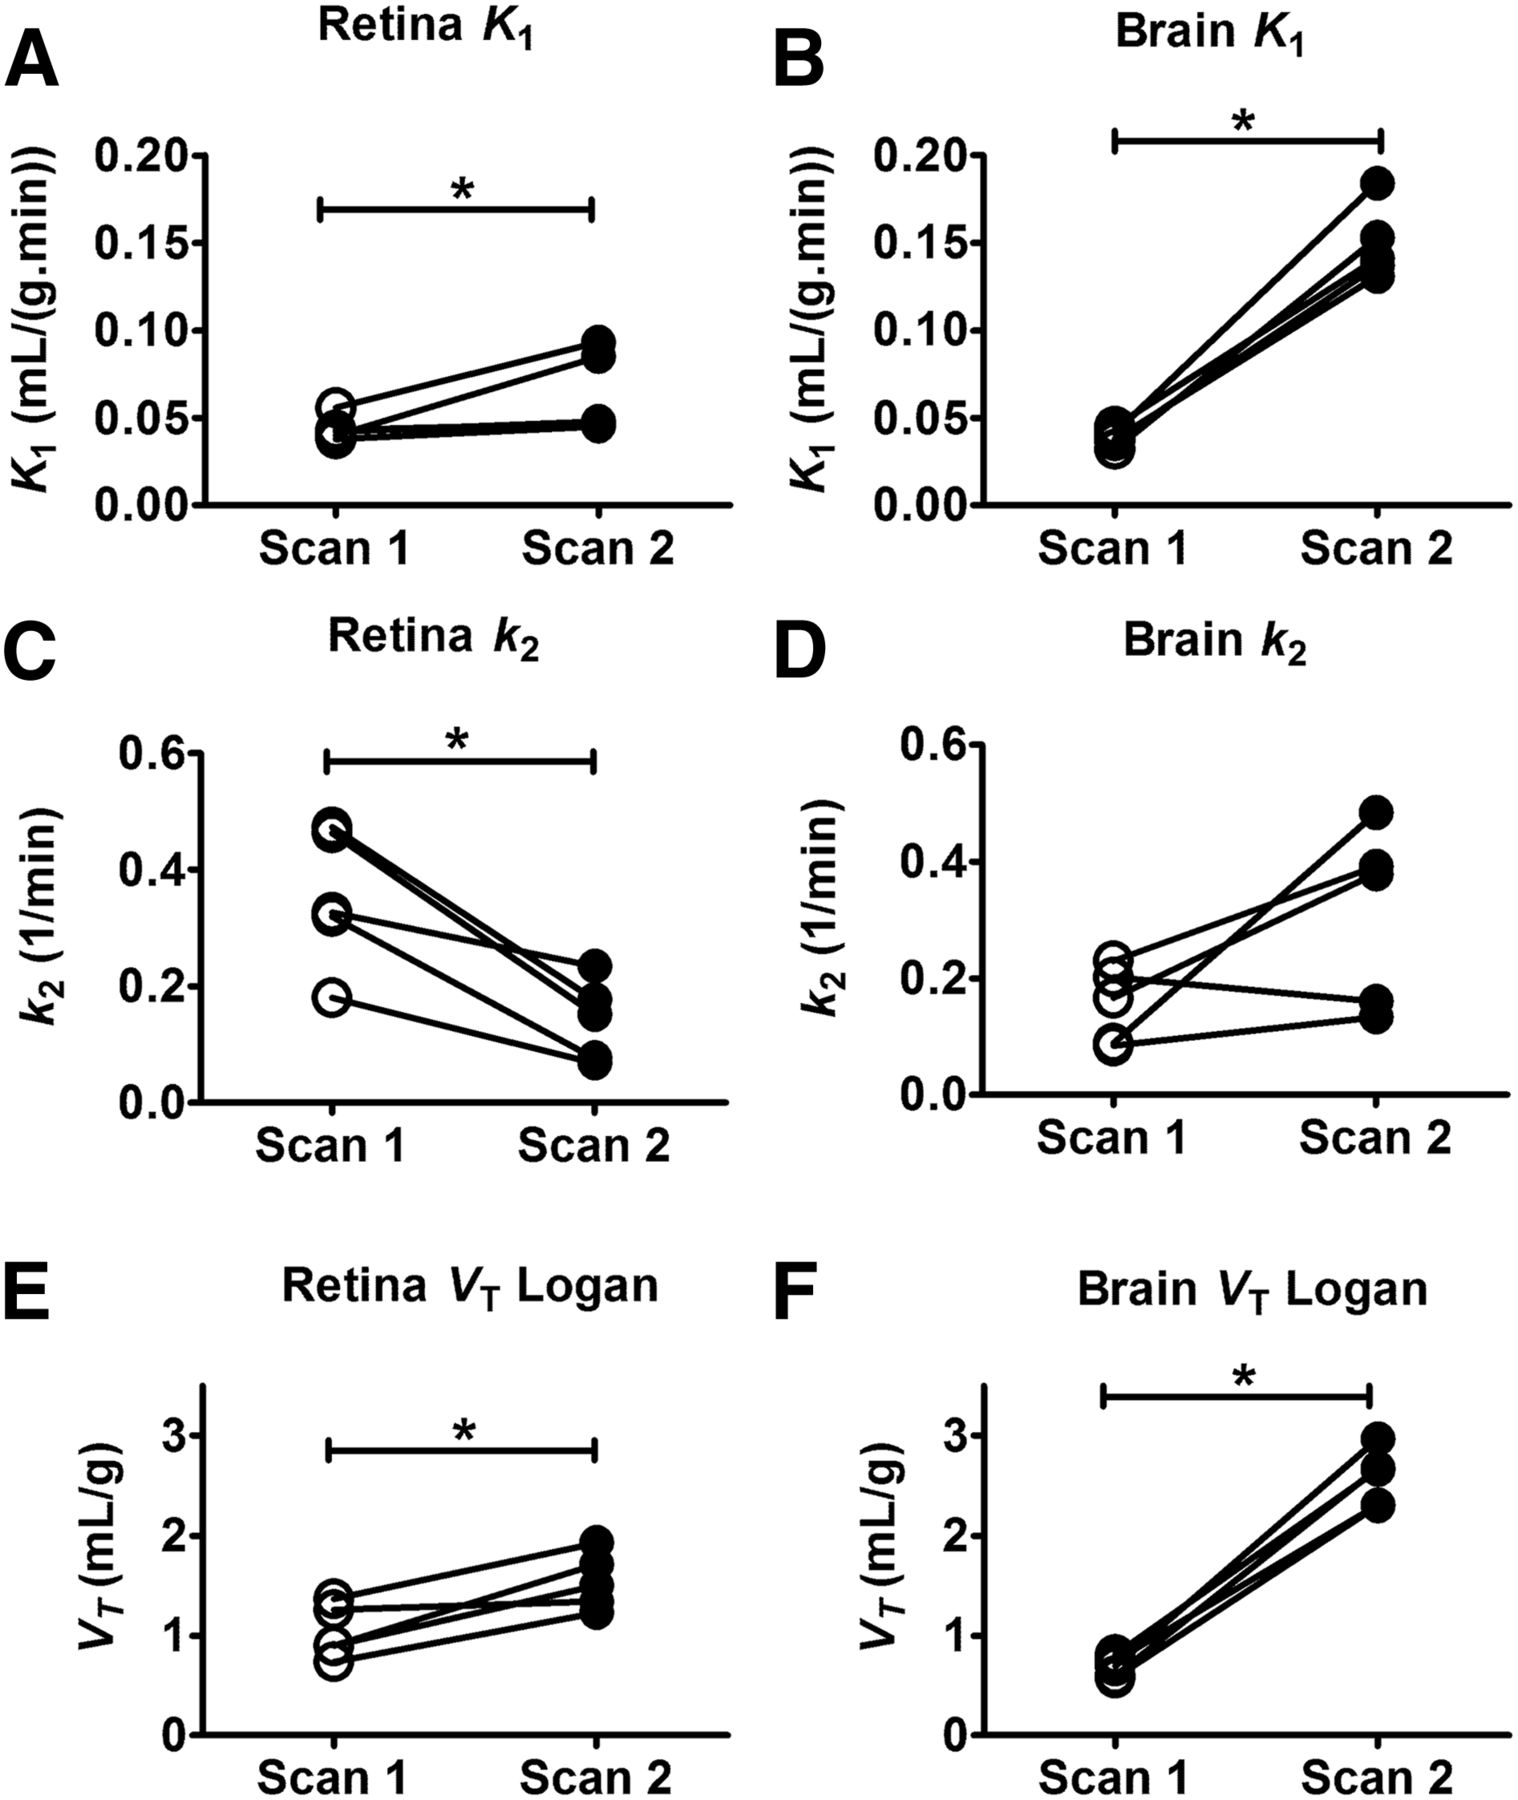
Ocular PET data were modeled using previously used approaches for analysis of brain PET data (8). Modeling outcome parameters in ocular tissues from the 2-tissue 4-rate-constant model are given in Supplemental Table 2. Logan graphical analysis was also performed and VT Logan values were in good agreement with model-derived VT values (Supplemental Table 2). Changes in selected modeling outcome parameters during ABCB1 inhibition in retina and brain are illustrated in Figure 3. During ABCB1 inhibition, retinal K1 and VT Logan were significantly increased by 1.4 ± 0.5-fold and 1.5 ± 0.3-fold, respectively. In contrast, retinal k2 was significantly decreased (2.8 ± 1.0-fold) during ABCB1 inhibition, suggesting slower clearance of radioactivity from the retina. In the brain, increases in K1 (3.9 ± 0.7-fold) and VT Logan (3.8 ± 0.6-fold) during ABCB1 inhibition were more pronounced than in the retina, whereas k2 remained unchanged (Fig. 3). In contrast to retina and brain, modeling outcome parameters were not significantly changed during ABCB1 inhibition for vitreous humor and eye muscle (Supplemental Table 2). To minimize a possible contribution of radiolabeled metabolites of (R)-11C-verapamil to the PET signal in tissue, we also analyzed only the first 10 min of the PET data, during which the percentage of polar radiolabeled metabolites of (R)-11C-verapamil in plasma was less than 10%, with a 1-tissue 2-rate-constant model (Supplemental Table 3) (10). For the 1-tissue 2-rate-constant model, only K1 but not k2 was significantly changed in the retina during ABCB1 inhibition. K1 values from the 1-tissue 2-rate-constant model were similar to K1 values from the 2-tissue 4-rate-constant model.

(R)-11C-verapamil modeling outcome parameters (K1 and k2 estimated from 2-tissue 4-rate-constant model and VT Logan) for retina (A, C, and E) and whole-brain gray matter (B, D, and F) for baseline scans and scans during ABCB1 inhibition. Brain data are taken from Bauer et al. (8). *P < 0.05, Wilcoxon signed rank test.
DISCUSSION
In this study we assessed—to our knowledge, for the first time—the functionality of ABCB1 at the human BRB in vivo. As model ABCB1 substrate we used (R)-11C-verapamil, which was shown to be transported selectively by ABCB1 among ABC transporters expressed at the BBB (6). However, there is evidence that verapamil is also a substrate of a novel, so far molecularly unidentified, organic cation transporter at the BBB and BRB, which may work in the opposite direction to ABCB1 and mediate uptake of verapamil from blood into tissue (3,4,11). Previous studies showed that the initial uptake clearance of verapamil, determined on short exposure, into rat and mouse retina was approximately 6 and 3 times higher, respectively, than the brain initial uptake clearance (3,4). In contrast, we found in humans that baseline (R)-11C-verapamil K1, which is equivalent to initial uptake clearance, was comparable for retina and brain (Fig. 3). This observation may be related to intra- or interspecies differences in expression or activity of ABCB1 or the verapamil uptake transporter at the BRB and BBB. In agreement with previous rodent studies (3,4), the effect of ABCB1 inhibition on retinal distribution of (R)-11C-verapamil was found to be much smaller than the effect on brain distribution (1.5 ± 0.3-fold vs. 3.8 ± 0.6-fold increase in VT for retina and brain, respectively). We compared retinal distribution of (R)-11C-verapamil with its distribution to the eye muscle, a tissue not protected by the BRB. After ABCB1 inhibition, retinal VT reached similar levels to eye-muscle VT (Supplemental Table 2), suggesting that ABCB1 was completely inhibited at the BRB. Even though our data show that in humans, ABCB1 is functionally less important at the BRB than at the BBB, we provide the first direct evidence that ABCB1 can limit distribution of ABCB1 substrate drugs to the human eye and possibly contribute to transporter-mediated drug–drug interactions at the BRB that may have a direct impact on drug toxicity and efficacy.
Two different methods of action have been described for ABCB1 to influence the brain distribution of systemically administered drugs (12). First, ABCB1 may decrease the distribution of drug from blood into brain by working against the concentration gradient (influx hindrance). Second, ABCB1 may increase the exit of drug from brain parenchyma (efflux enhancement). PET studies with the ABCB1 substrates 11C-verapamil or 11C-N-desmethyl-loperamide showed that ABCB1 inhibition mainly results in an increase in the influx rate constant of radiotracer from blood into brain, K1 (8,10,13). As opposed to the brain, we observed in the retina a pronounced and significant decrease in (R)-11C-verapamil efflux rate constant k2 during ABCB1 inhibition with only a relatively small increase in K1 (Fig. 3). Our data thus suggest a pharmacokinetically different impact of ABCB1 on distribution of systemically administered drugs to the retina as compared with the brain. ABCB1 may primarily influence the clearance of drug from the retina and be a critical determinant of retinal residence time of drugs rather than influencing the initial uptake of drug from blood into retina. In comparison to the retina, distribution of radioactivity to the vitreous humor was much lower and unchanged after ABCB1 inhibition (Fig. 2C). This may be related to a slow equilibration of the vitreous humor with the retina compartment and possibly a small impact of ABCB1 at the blood–aqueous humor barrier on the overall vitreous humor drug distribution.
CONCLUSION
We found a significant increase in distribution of the ABCB1 substrate (R)-11C-verapamil to the retina during ABCB1 inhibition, which provides the first in vivo evidence for ABCB1 transport activity at the human BRB. Consistent with previous rodent data, the increase in (R)-11C-verapamil distribution to the retina was less pronounced than the increase in brain distribution. Our novel PET protocol may find application to assess the consequences of alterations in retinal ABCB1 transport activity caused by polymorphisms in the ABCB1 gene, by drug–drug interactions, or by different ocular diseases.
DISCLOSURE
Financial support was received from the Austrian Science Fund (FWF) (grants F 3513-B20 and KLI 480-B30). No other potential conflict of interest relevant to this article was reported.
Acknowledgments
We thank Maria Weber, Beatrix Wulkersdorfer, and Johann Stanek from the Department of Clinical Pharmacology and Cécile Philippe, Harald Ibeschitz, and Ingrid Leitinger from the Division of Nuclear Medicine for supporting this study. Oliver Langer, Marcus Hacker, and Wolfgang Wadsak are members of the Medical Imaging Cluster (MIC) of the Medical University Vienna.
Footnotes
Published online Oct. 13, 2016.
- © 2017 by the Society of Nuclear Medicine and Molecular Imaging.
REFERENCES
- Received for publication August 3, 2016.
- Accepted for publication September 22, 2016.


Jump to section
Related Articles
Cited By...
- No citing articles found.