


Article Figures & Data
Figures
- FIGURE 1.
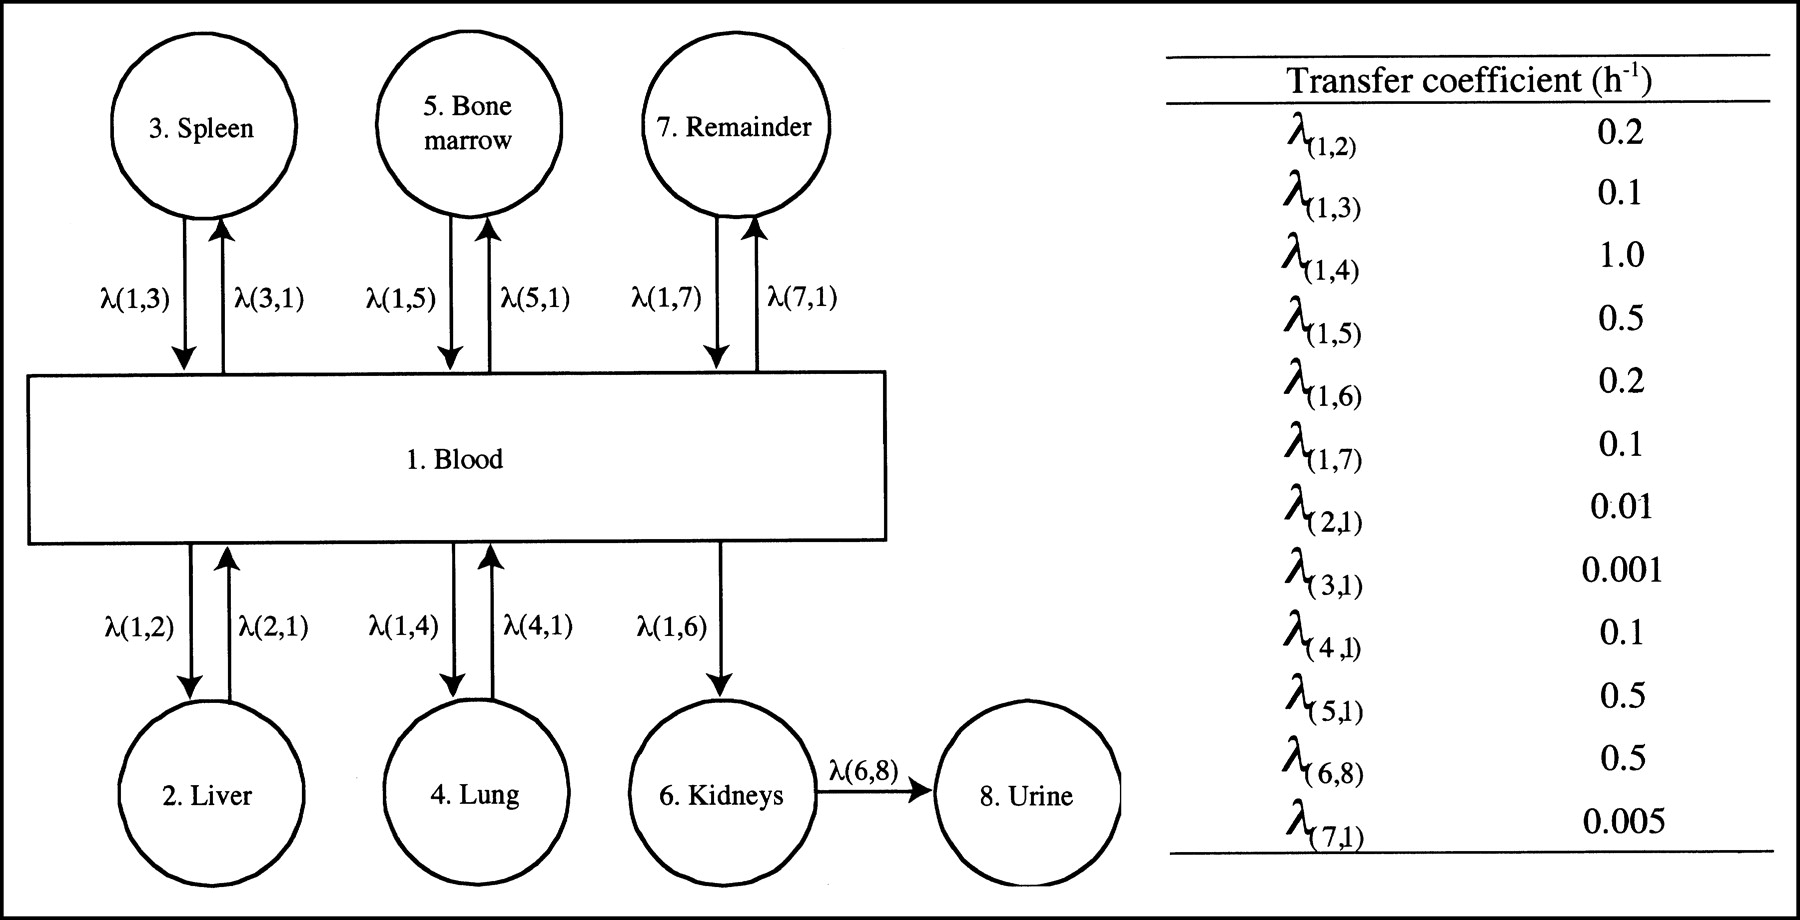
Pharmacokinetic model used to assess residence time in lung tissue. Transfer coefficients λi,j were estimated from uptake and clearance data from previous animal experiments (21). Solution of compartmental model was carried out using algorithm for solving first-order compartmental models involving recycling (29).
- FIGURE 2.
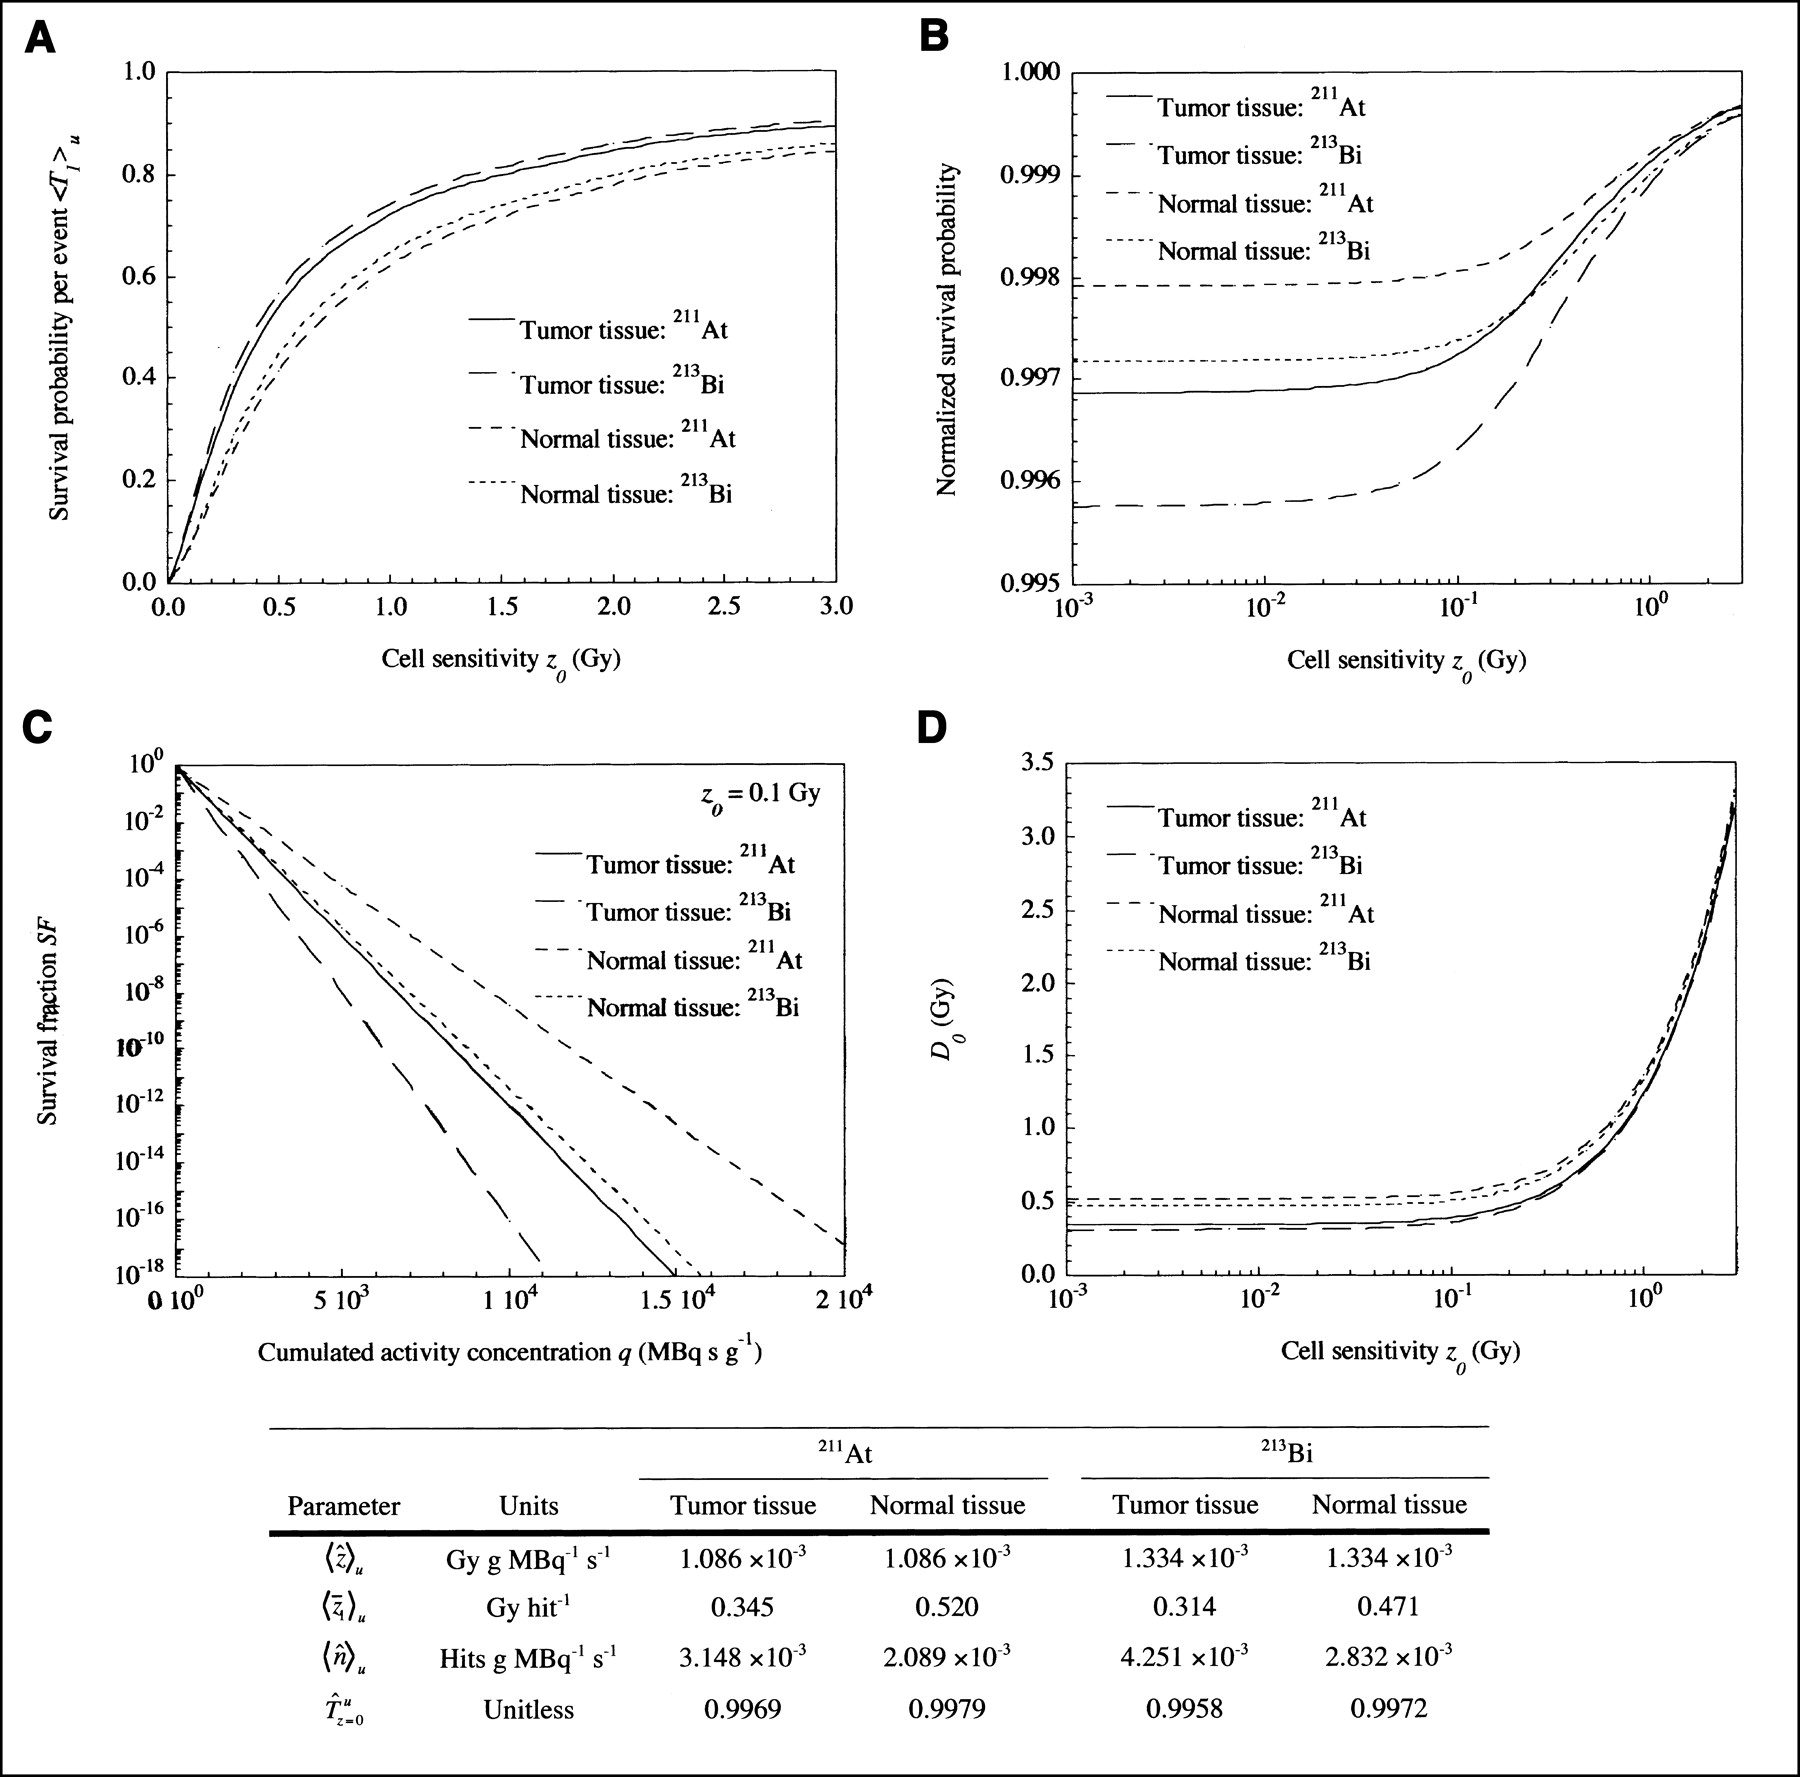
Baseline microdosimetry calculations for EMT-6 tumor cells and normal lung tissue cells assuming uniform activity distribution. Estimated cell and nuclear radii for EMT-6 cells were 4.4 and 3.9 μm, respectively, and for normal lung cells were 3.7 and 3.2 μm, respectively. (A) Average survival probability per event 〈T1〉u as function of z0. (B) Average normalized survival probability 〈T̂z0〉u as function of z0. (C) Survival fraction SF as function of cumulated activity concentration q for 211At for cell sensitivity z0 of 0.1 Gy. (D) D0 as function of cell sensitivity z0 for 211At and 213Bi for tumor and normal tissue cells. T̂z=0u represents probability per every unit cumulated activity (MBq s g−1) that cell will receive zero hits under uniform cumulated activity distribution—that is, T̂z=0u = exp[−〈n̂〉u].
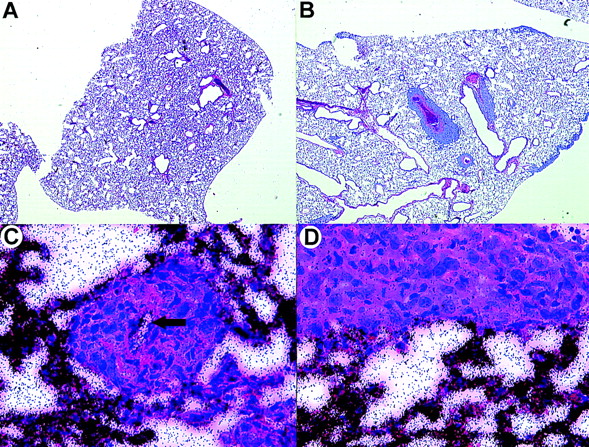
- FIGURE 3.
Histological images of mouse lungs with EMT-6 tumor colonies (hematoxylin-eosin), where image size was 640 × 480 pixels with magnification of ∼×20, resulting in pixel size of 8.06 μm. (A) Tumor colonies from animal A, 5 d after inoculation, show minimal tumor growth around blood vessels. (B) In contrast, excessive growth of tumor colonies around blood vessels is seen for animal B, 8 d after inoculation. (C) Autoradiography image shows distribution of 125I-labeled 201B mAb in normal lung and tumor colony growing around blood vessel in animal A (arrow). (D) Autoradiography image shows distribution around solid tumor masses in animal B (∼×400; pixel size of 0.41 μm).
- FIGURE 4.
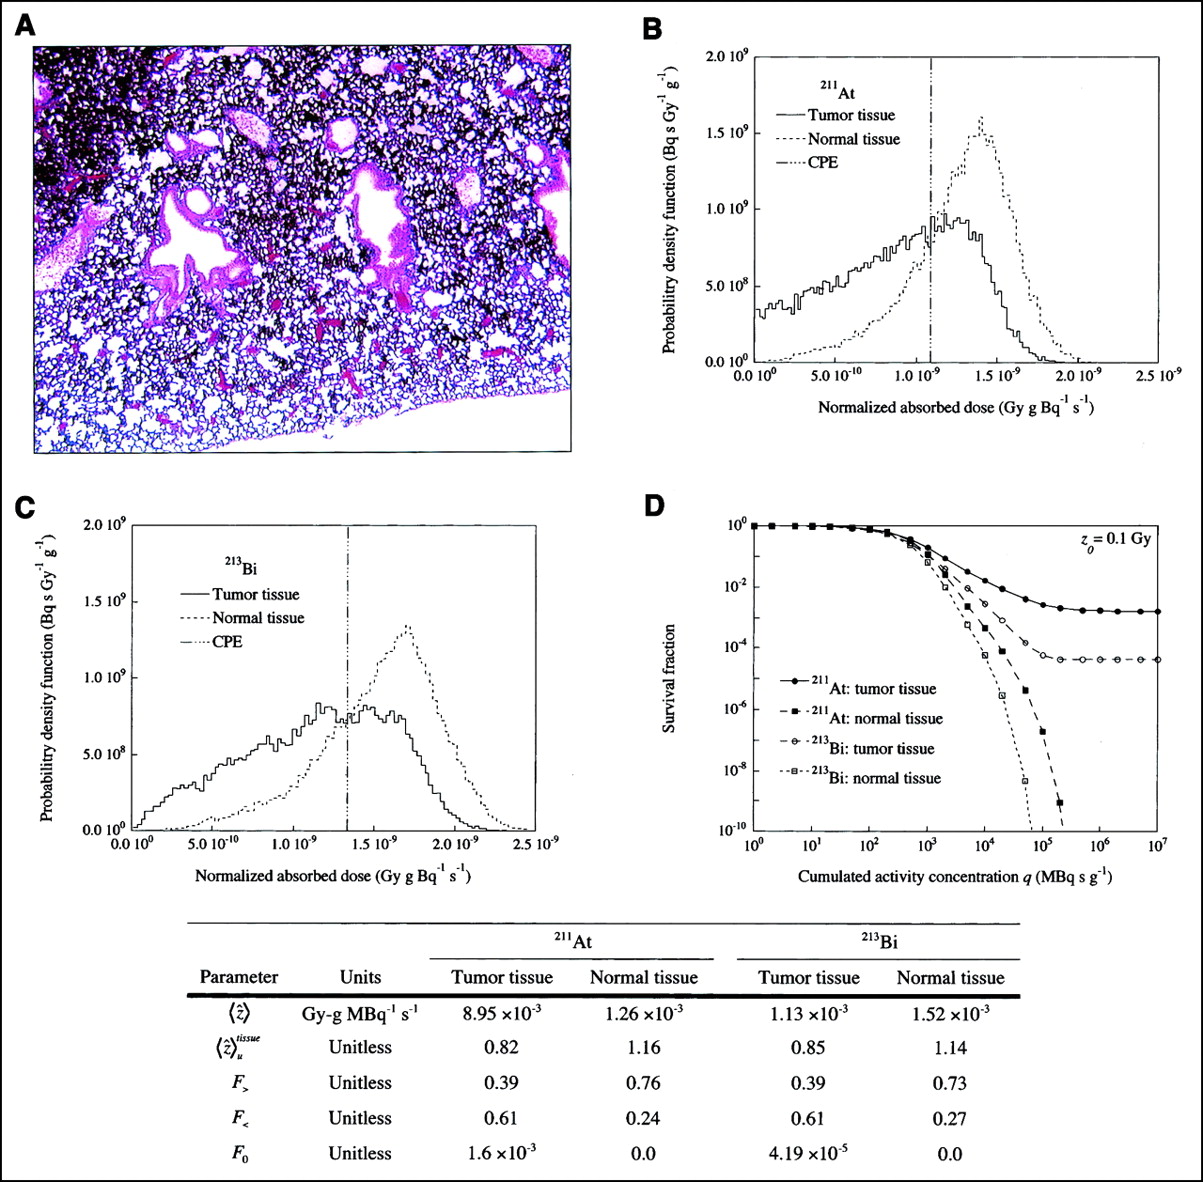
(A) Autoradiography image from animal A with lung tumor colonies measuring <100 μm in cross length. (B and C) Probability density function (pdf) for normalized absorbed dose for tumor and normal tissue for 211At (B) and 213Bi (C). Normalized absorbed dose under uniform cumulated activity distribution is given. (D) Survival fraction SF as function of cumulated activity concentration q for cell sensitivity z0 = 0.1 Gy for tumor and normal lung tissue for 211At and 213Bi. Table presents summary of average normalized absorbed dose, tumor and normal tissue CPE ratio, over-dose fraction, under-dose fraction, and zero-dose fraction.
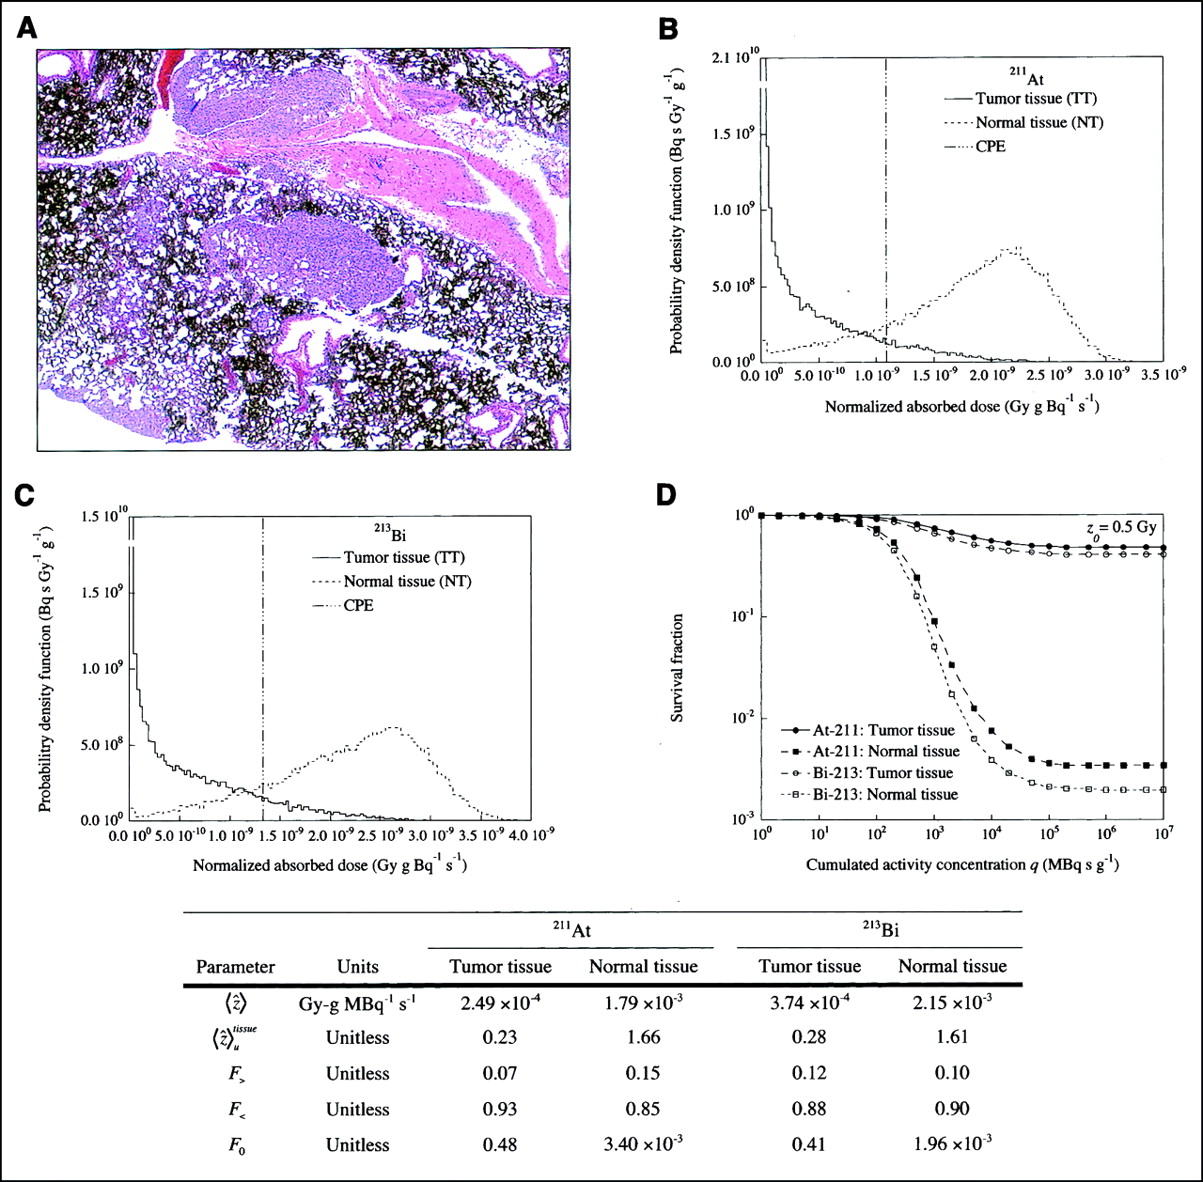
- FIGURE 5.
(A) Autoradiography image from animal B with large tumor colonies measuring >400 μm in cross length. (B and C) Probability density function (pdf) for normalized absorbed dose for tumor and normal tissue for 211At (B) and 213Bi (C). (D) Survival fraction SF as function of q for cell sensitivity z0 = 0.5 Gy for tumor and normal tissue for 211At and 213Bi. Table presents summary of average normalized absorbed dose, tumor and normal tissue CPE ratio, over-dose fraction, under-dose fraction, and zero-dose fraction.
- FIGURE 6.
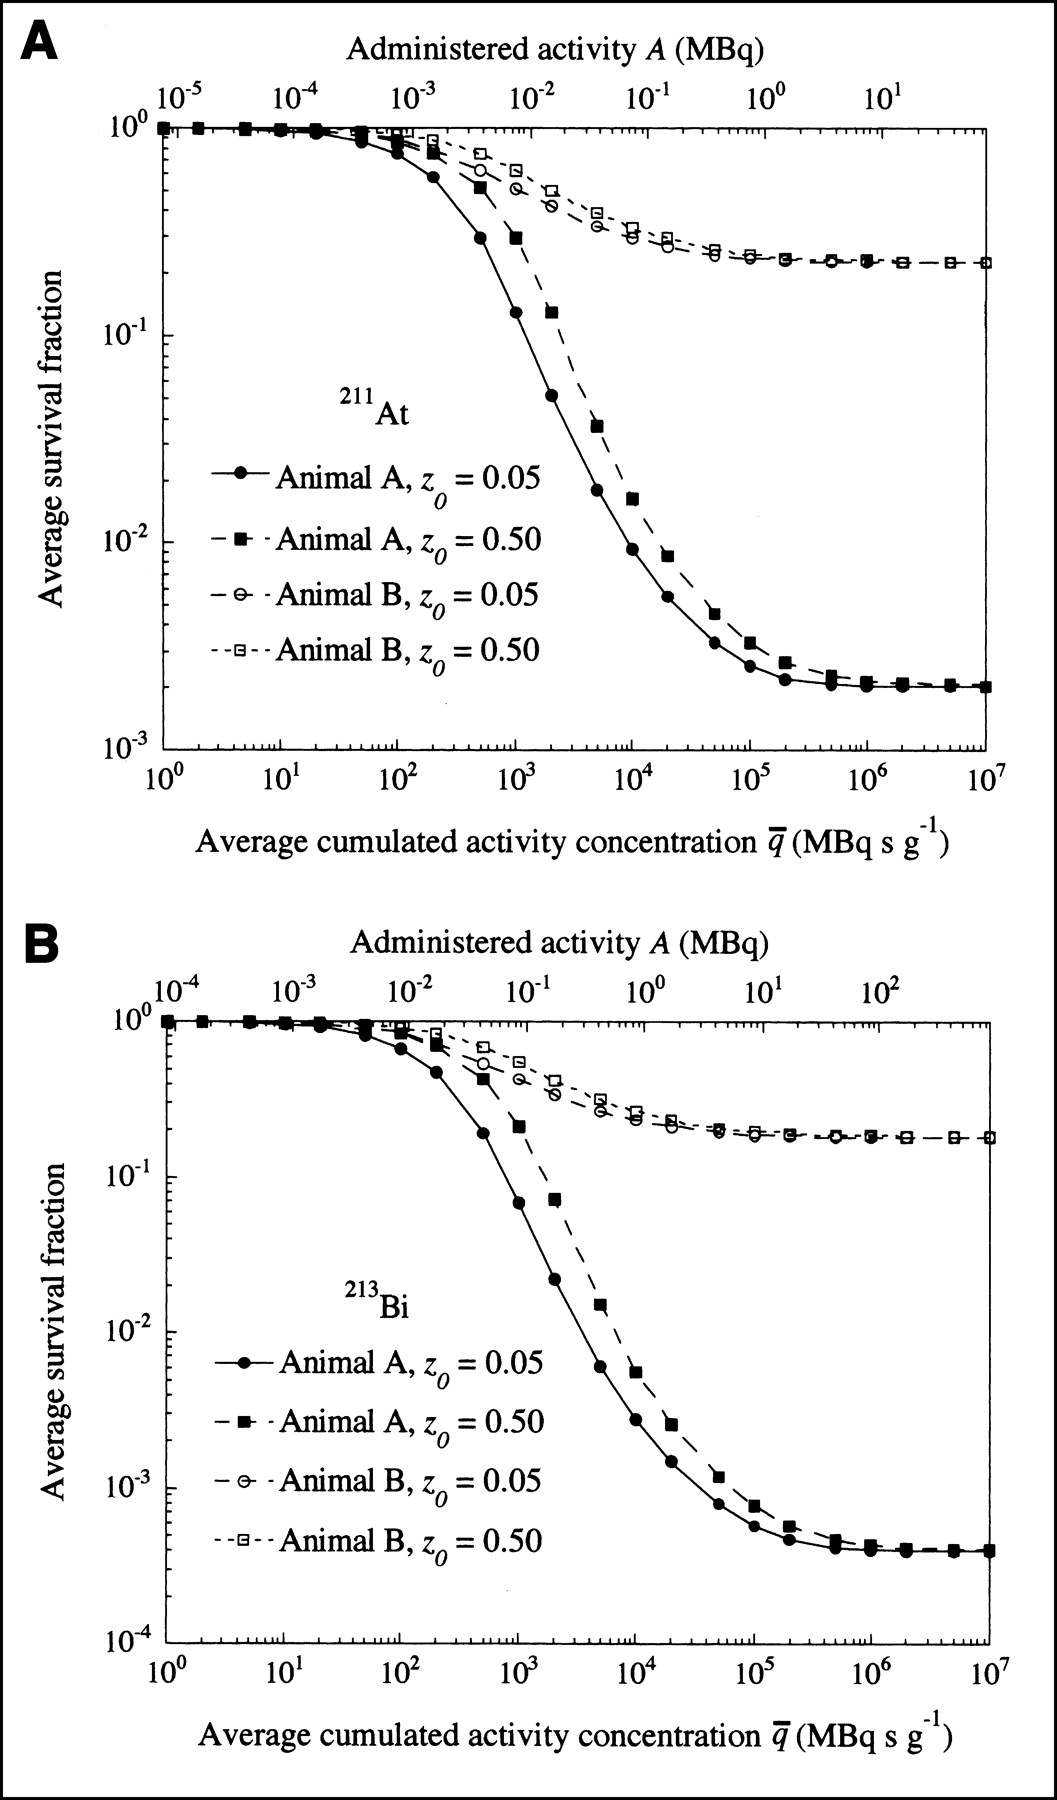
Estimated average survival fraction S̅F̅ as function of average cumulated activity concentration q̄ (or administered activity A) for cell sensitivities z0 of 0.05 and 0.50 Gy for animal A and animal B for 211At (A) and 213Bi (B), respectively. Average survival fraction when q̄ → ∞ for animal A was 2.0 × 10⁻³ and 4.0 × 10⁻⁴ for 211At and 213Bi, respectively, and for animal B was 0.23 and 0.18 for 211At and 213Bi, respectively.
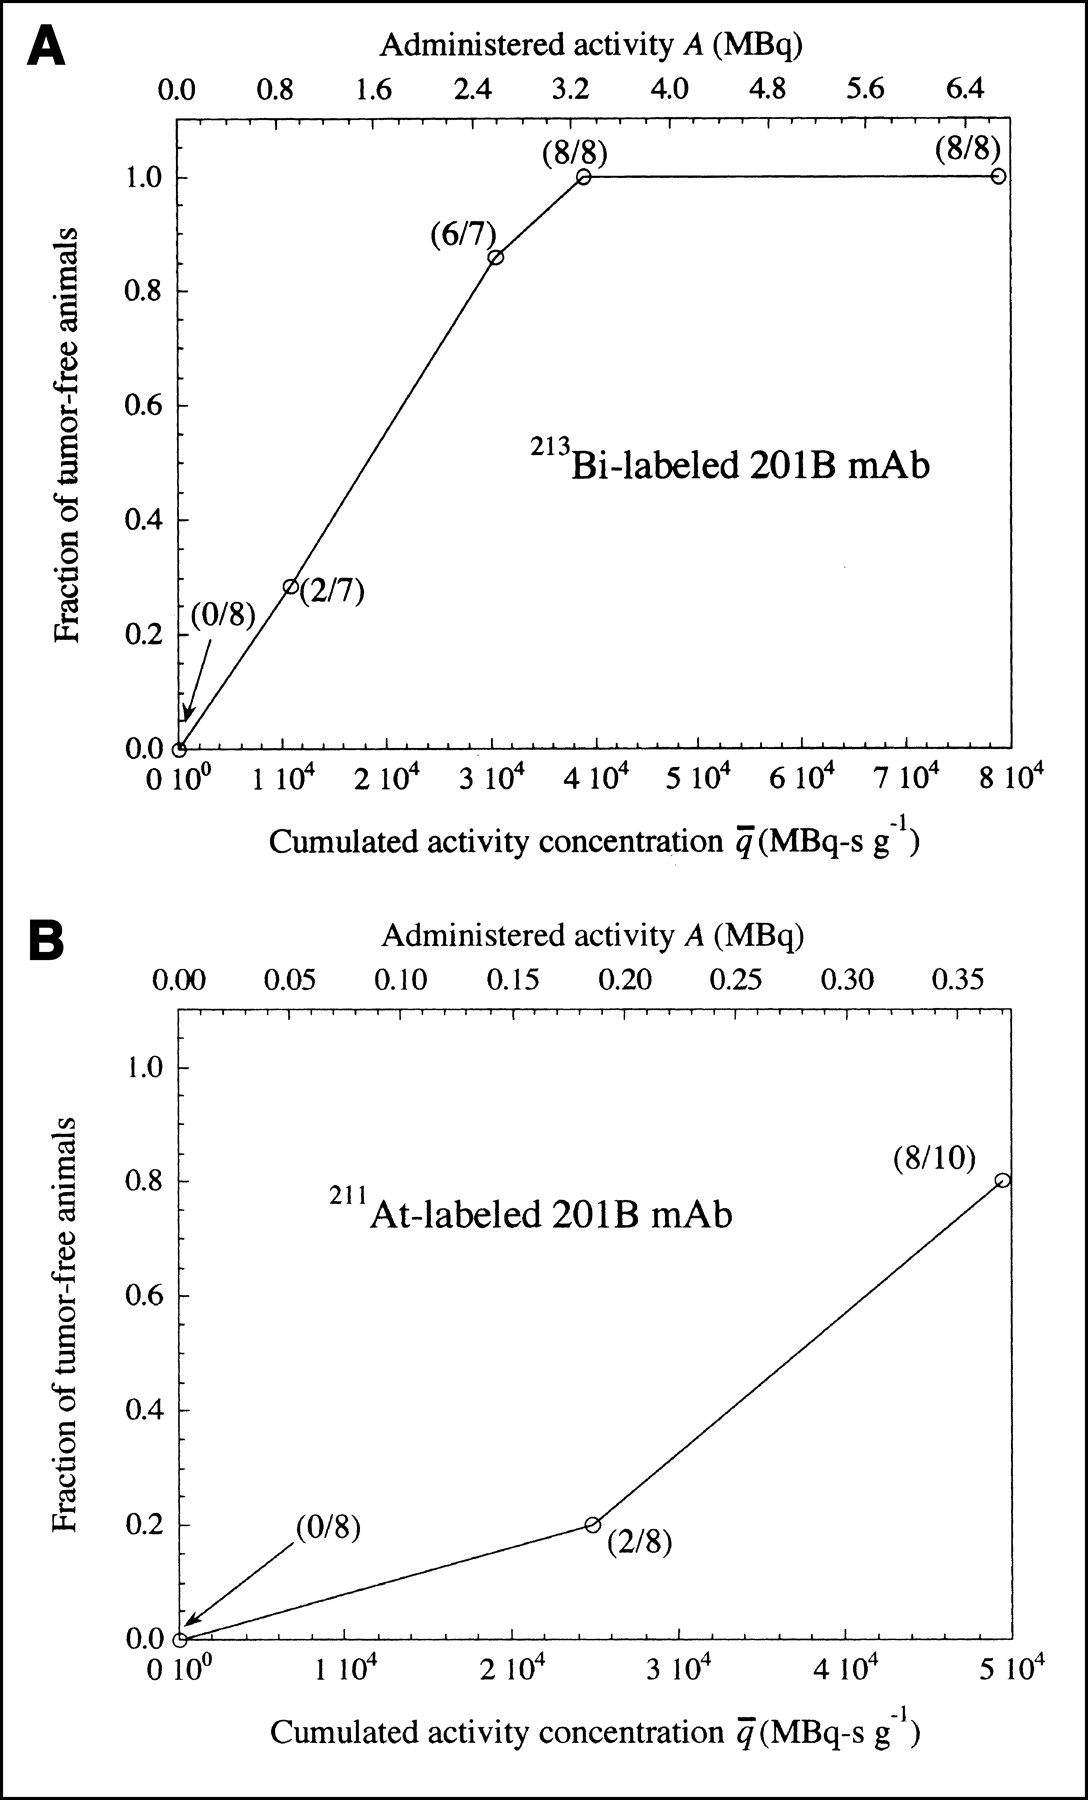
- FIGURE 7.
Fraction of tumor-free animals in group A treated at different administered doses with 213Bi-labeled 201B mAb (A) (7,21,22) and 211At-labeled 201B mAb (B) (23) 5 d after inoculation with EMT-6 tumor cells. Ratio of tumor-free animals and treated animals is given for each data point. Lungs of treated animals that were free of tumors contained localized foci free of tumor cells, which were presumably irradiated by treatment. Cumulated activity concentration in lung tissue was estimated using Equation 14 and residence time for each radionuclide.


Tables
q Cumulated activity per unit mass of tissue MBq s g−1 z̄ Average specific energy to the nucleus of a target cell Gy T z Survival probability to a target cell for cell sensitivity z0 Unitless ẑ Normalized absorbed dose: absorbed dose per unit cumulated activity concentration Gy g MBq−1 s−1 n̂ Normalized average number of hits: average number of hits per unit cumulated activity concentration hits g MBq−1 s−1 T̂ z0 Normalized survival probability: probability of survival per unit cumulated activity concentration for cell sensitivity z0 Unitless T̂ z=0 Normalized probability of zero hits: probability of zero hits per unit cumulated activity concentration Unitless pdf(ẑ) Probability density function for the normalized absorbed dose for all target cells MBq s Gy−1 g−1 pdf(T̂z0) Probability density function for the normalized survival probability for all target cells for a given cell sensitivity z0 Unitless 〈ẑ〉 Average normalized absorbed dose among all target cells Gy g MBq−1 s−1 〈T̂z0〉 Average normalized survival probability among all target cells Unitless F < Fraction of tumor cells receiving a normalized absorbed dose lower than 〈ẑ〉h Unitless F > Fraction of tumor cells receiving a normalized absorbed dose higher than 〈ẑ〉h Unitless F 0 Fraction of tumor cells receiving a zero normalized absorbed dose—i.e., ẑ = 0 Unitless pti Probability of tumor incidence among all analyzed histological samples Unitless SF(q) Survival fraction of tumor cells as a function of cumulated activity concentration q Unitless 〈ẑ〉uNT Normal tissue CPE ratio, 〈ẑ〉NT/〈ẑ〉u Unitless 〈ẑ〉uTT Tumor tissue CPE ratio, 〈ẑ〉TT/〈ẑ〉u Unitless τlung Residence time in lung tissue s - TABLE 1
Microdosimetric Analysis for 211At- and 213Bi-Labeled 201B mAb for Animals A and B
Parameter Animal A Animal B 211At mean (range) 213Bi mean (range) 211At mean (range) 213Bi mean (range) 〈ẑ〉NT 1.08 (0.49–1.40) × 10−3 1.30 (0.60–1.65) × 10−3 1.30 (1.10–1.70) × 10−3 1.60 (1.40–2.10) × 10−3 〈ẑ〉uNT 0.99 (0.45–1.29) 0.98 (0.45–1.23) 1.25 (1.09–1.60) 1.22 (1.08–1.57) 〈ẑ〉TT 1.10 (0.49–2.14) × 10−3 1.37 (0.71–2.64) × 10−3 3.80 (0.40–7.40) × 10−4 5.60 (0.80–9.60) × 10−4 〈ẑ〉uTT 1.10 (0.45–1.97) 1.03 (0.54–1.97) 0.36 (0.04–0.71) 0.42 (0.06–0.73) F̄0 2 × 10⁻³ (0.0–0.024) 4 × 10⁻⁴ (0.0–0.011) 0.31 (0.00–0.54) 0.25 (0.00–0.46) F̄< 0.49 (0.11–0.96) 0.49 (0.09–0.95) 0.89 (0.63–1.00) 0.87 (0.63–1.00) F̄> 0.51 (0.04–0.89) 0.51 (0.05–0.91) 0.11 (0.00–0.37) 0.13 (0.00–0.37) pti 0.32 0.25 1.0 0.96 〈ẑ〉NT = average normalized absorbed dose for normal tissue (Gy g MBq−1 s−1); 〈ẑ〉uNT = normal tissue CPE ratio (unitless); 〈ẑ〉TT = average normalized absorbed dose for tumor tissue (Gy g MBq−1 s−1); 〈ẑ〉uTT = tumor tissue CPE ratio (unitless); F̄0 = tumor-weighted average zero-dose fraction; F̄< = tumor-weighted average under-dose fraction; F̄> = tumor-weighted average over-dose fraction; pti = probability of tumor incidence.
In this issue


Jump to section
Related Articles
Cited By...
- Ex Vivo Activity Quantification in Micrometastases at the Cellular Scale Using the {alpha}-Camera Technique
- The {alpha}-Camera: A Quantitative Digital Autoradiography Technique Using a Charge-Coupled Device for Ex Vivo High-Resolution Bioimaging of {alpha}-Particles
- Lognormal Distribution of Cellular Uptake of Radioactivity: Statistical Analysis of {alpha}-Particle Track Autoradiography
- Phase 1 trial study of 131I-labeled chimeric 81C6 monoclonal antibody for the treatment of patients with non-Hodgkin lymphoma
- In Vitro Cytotoxicity of 211At-Astatide and 131I-Iodide to Glioma Tumor Cells Expressing the Sodium/Iodide Symporter