


Abstract
This study presents and evaluates a model-based image analysis method to calculate from gated cardiac 18F-FDG PET images diastolic and systolic volumes, ejection fraction, and myocardial mass of the left ventricle. The accuracy of these estimates was delineated using measurements obtained by MRI, which was considered the reference standard because of its high spatial resolution. Methods: Twenty patients (18 men, 2 women; mean age ± SD, 59 ± 12 y) underwent electrocardiography-gated cardiac PET and MRI to acquire a set of systolic and diastolic short-axis images covering the heart from apex to base. For PET images, left ventricular radius and wall thickness were estimated by model-based nonlinear regression analysis applied to the observed tracer concentration along radial rays. Endocardial and epicardial contours were derived from these estimates, and left ventricular volumes, ejection fraction, and myocardial mass were calculated. For MR images, an expert manually drew contours. Results: Left ventricular volumes by PET and MRI were 101 ± 60 mL and 112 ± 93 mL, respectively, for end-systolic volume and 170 ± 68 mL and 189 ± 99 mL, respectively, for end-diastolic volume. Ejection fraction was 44% ± 13% by PET and 46% ± 18% by MRI. The left ventricular mass by PET and MRI was 196 ± 44 g and 200 ± 46 g, respectively. PET and MRI measurements were not statistically significant. A significant correlation was observed between PET and MRI for calculation of end-systolic volumes (r = 0.93, SEE = 23.4, P < 0.0001), end-diastolic volumes (r = 0.92, SEE = 26.7, P < 0.0001), ejection fraction (r = 0.85, SEE = 7.4, P < 0.0001), and left ventricular mass (r = 0.75, SEE = 29.6, P < 0.001). Conclusion: Model-based analysis of gated cardiac PET images permits an accurate assessment of left ventricular volumes, ejection fraction, and myocardial mass. Cardiac PET may thus offer a near-simultaneous assessment of myocardial perfusion, metabolism, and contractile function.
Cardiac PET is a noninvasive diagnostic method that is clinically used to assess regional myocardial perfusion and metabolism (1–3). State-of-the-art PET systems also offer the capability to perform an electrocardiography (ECG)-gated acquisition and to generate systolic and diastolic images of the heart (4–9). Therefore, cardiac PET has the potential to provide a near-simultaneous assessment of myocardial perfusion, glucose metabolism, and cardiac function. However, unlike gated cardiac SPECT (10–12), gated cardiac PET (13,14) has not yet found widespread clinical use.
Estimation of cardiac geometry from cardiac PET images needs to account for the limited spatial resolution of PET images known as partial-volume effect (15). In cardiac PET, partial-volume effect is introduced by image acquisition, image reconstruction, and image reorientation (16) and leads to blurring of the image, so an accurate delineation of the borders of the myocardial wall is difficult to achieve. However, it is possible to model and thus compensate for the blurring effect in PET images (17).
A previous study used a model-based approach to cardiac PET image analysis in healthy subjects and could derive reliable regional estimates of left ventricular radius and wall thickness on single image planes (6). However, it has remained undetermined whether this approach is also applicable to patients with normal and reduced left ventricular function and whether global parameters such as left ventricular volume, ejection fraction, and left ventricular mass can accurately be estimated from gated cardiac PET images.
In this study, model-based image analysis was applied to gated PET images of cardiac patients to estimate cardiac geometry and calculate systolic and diastolic cardiac volumes, ejection fraction, and left ventricular mass. The accuracy of these PET estimates was evaluated using measurements obtained from ECG-gated MRI as the reference method.
MATERIALS AND METHODS
Patient Population
The study population included 20 patients (18 men, 2 women; mean age ± SD, 59 ± 12 y) who underwent 18F-FDG PET for evaluation of myocardial viability. Twelve patients had a history of a chronic myocardial infarction (5 anterior infarction, 5 inferior infarction, 2 anterior and inferior infarction), and 5 patients had diabetes mellitus. Patients were studied by MRI 17 ± 15 d after PET. All patients were in stable condition; there was no cardiac event between PET and MRI.
PET
A high-spatial-resolution full-ring dedicated PET scanner (Advance; General Electric Medical Systems) was used to acquire gated images during 8 cardiac phases covering the entire R-R interval. Patients received an oral glucose load of 75 g to enhance myocardial 18F-FDG uptake and to increase the ratio of myocardial activity to background activity. Diabetic patients were excluded from glucose load. When, 40 min after glucose loading, the blood-sugar level exceeded 140 mg/dL, 2–8 units of insulin were injected intravenously (2 units for each 20 mg of glucose per deciliter over a level of 140 mg/dL). 18F-FDG was injected immediately afterward. Forty minutes after the intravenous injection of 370 MBq of 18F-FDG, a 10-min transmission scan was acquired to correct photon attenuation in the emission images. Finally, an ECG-gated image acquisition was performed for 20 min.
Image reconstruction was performed with filtered backprojection using a Shepp-Logan filter with a cutoff frequency of 0.48 cycles per centimeter, yielding a final value of 10 mm in full width at half maximum (FWHM). The reconstruction matrix was 128 × 128 pixels, with a 2-mm pixel size.
PET Image Analysis
The transaxial images of all 8 images phases were reoriented into short-axis views using commercially available image-processing software (General Electric Medical Systems). The reoriented short-axis images were transferred to an image-processing workstation (Onyx; Silicon Graphics) for further processing. For gated image analysis, a semiautomated image-processing tool was developed using Interactive Data Language software (Research Systems, Inc.), which can be executed under the UNIX or Windows (Microsoft) operating system.
For image processing, a model-based method was used that accounts for partial-volume effects and estimates myocardial contours by nonlinear regression analysis of the tracer distribution observed along radial rays derived from short-axis images. A detailed description of the mathematic model is given elsewhere (17,18).
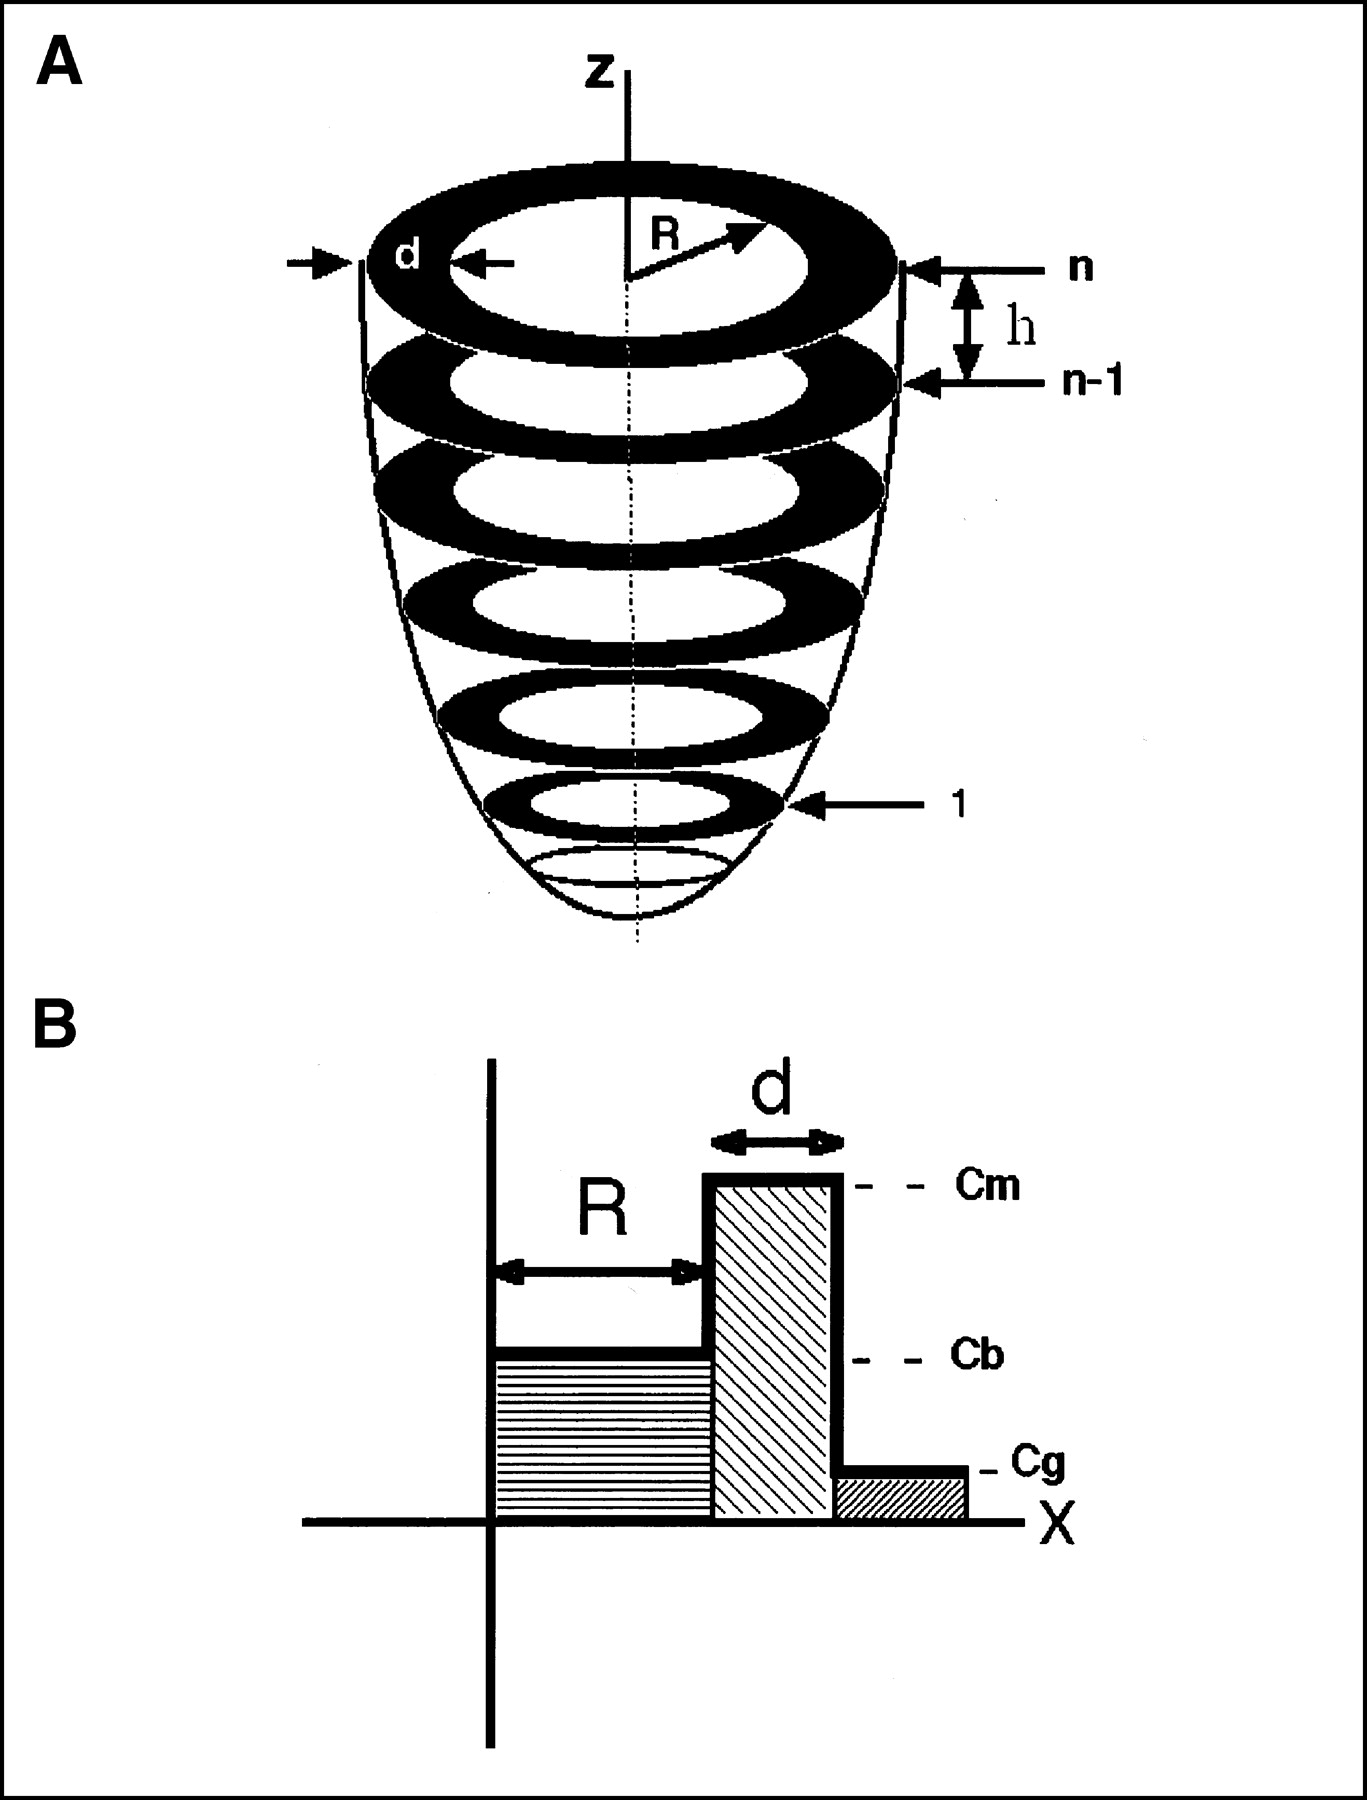
In short, the left ventricle with the myocardial wall is treated as an annular ellipsoid with the z-axis as its central axis (Fig. 1A). By neglecting the variation in activity along the z-axis, a simplified 2-dimensional model of a short-axis image is used to derive the expected tracer distribution along a radial ray originating from the center of the left ventricle and extending through the myocardium to the background (Fig. 1B). The radial tracer distribution C(x) can be considered the sum of rectangular functions specified by the left ventricular radius R, the wall thickness d, and tracer activities in the blood pool Cb, the myocardium Cm, and the background Cg. The resolution effects of PET can be modeled using a blurring function specified by the FWHM value as measured by phantom experiments (15). The expected tracer concentration as observed in an actual short-axis PET image can be calculated as given in the following equation:
 Eq. 1 where s = FWHM/2.355 and erf() denotes the error function.

(A) Three-dimensional model of left ventricle as used for calculation of volume and mass. (B) One-dimensional model of radial tracer profile originating from center of left ventricle and extending through myocardium into background. Cb = blood-pool activity; Cg = background activity; Cm = myocardial activity; d = wall thickness; h = slice thickness; n = slice number; R = left ventricular radius; z = left ventricular long axis.
For image processing, the gated images that showed the smallest and largest left ventricular cavity during a cardiac cycle were selected by visual inspection as end-systolic and end-diastolic frames. In both image sets, the most apical and basal slices were defined to indicate the range of images for further volume calculation.
For each selected short-axis slice, a circular region of interest was drawn with its center in the left ventricular cavity and extending into the background. Sixty profiles were then generated along radial rays from the center of the left ventricle to the boundary of the circular region. Nonlinear regression analysis (19) was applied to fit the observed radial profile to the mathematic model (Eq. 1) and to obtain estimates for the 5 model parameters (Cm, Cb, Cg, R, and d). Thus, parameter values were independently obtained for each radial direction around a full 360° arc.
An adequate counting rate along the radial rays is required for parameter estimation to converge successfully. To preempt an invalid fitting result, the image analysis software attempts to identify radial profiles that are inadequate for parameter estimation by using a threshold for the maximal count activity and removing profiles with a low activity (segments with reduced or absent tracer uptake) from the fitting process. Also, radial profiles are discarded if the algorithm of parameter estimation does not converge. In addition, after the fitting process, results are screened for consistency, and profiles with clearly erroneous results are also excluded. For radial profiles that either were excluded from the fitting process or are associated with invalid fitting results, a redefinition procedure is applied that calculates parameter values on the basis of the fitting results from neighboring profiles.
The results of the nonlinear regression analysis include numeric values for R and d for each radial profile and thus border points of the endocardial and epicardial borders. Using these estimated borders, the endocardial and epicardial areas were calculated and end-systolic and end-diastolic volumes were obtained on the basis of Simpson’s rule. From the calculated endocardial volumes, global left ventricular ejection fraction was derived. The left ventricular mass was obtained from the volume of end-diastolic left ventricular myocardium by multiplication with a specific density of 1.05 g/mL. Figures 2 and 3 depict 2 examples of short- and long-axis images and estimated endocardial and epicardial contours for a study with homogeneous tracer uptake and a study with a segmental defect.

Example of model-based parameter estimation of cardiac geometry. Short-axis images obtained at basal (left), midventricular (middle), and apical (right) level by MRI (first and fourth rows) and PET (second and fifth rows) for diastolic (top 3 rows) and systolic (bottom 3 rows) time points. Third and sixth rows depict short-axis views with overlay of estimated endocardial and epicardial contours.

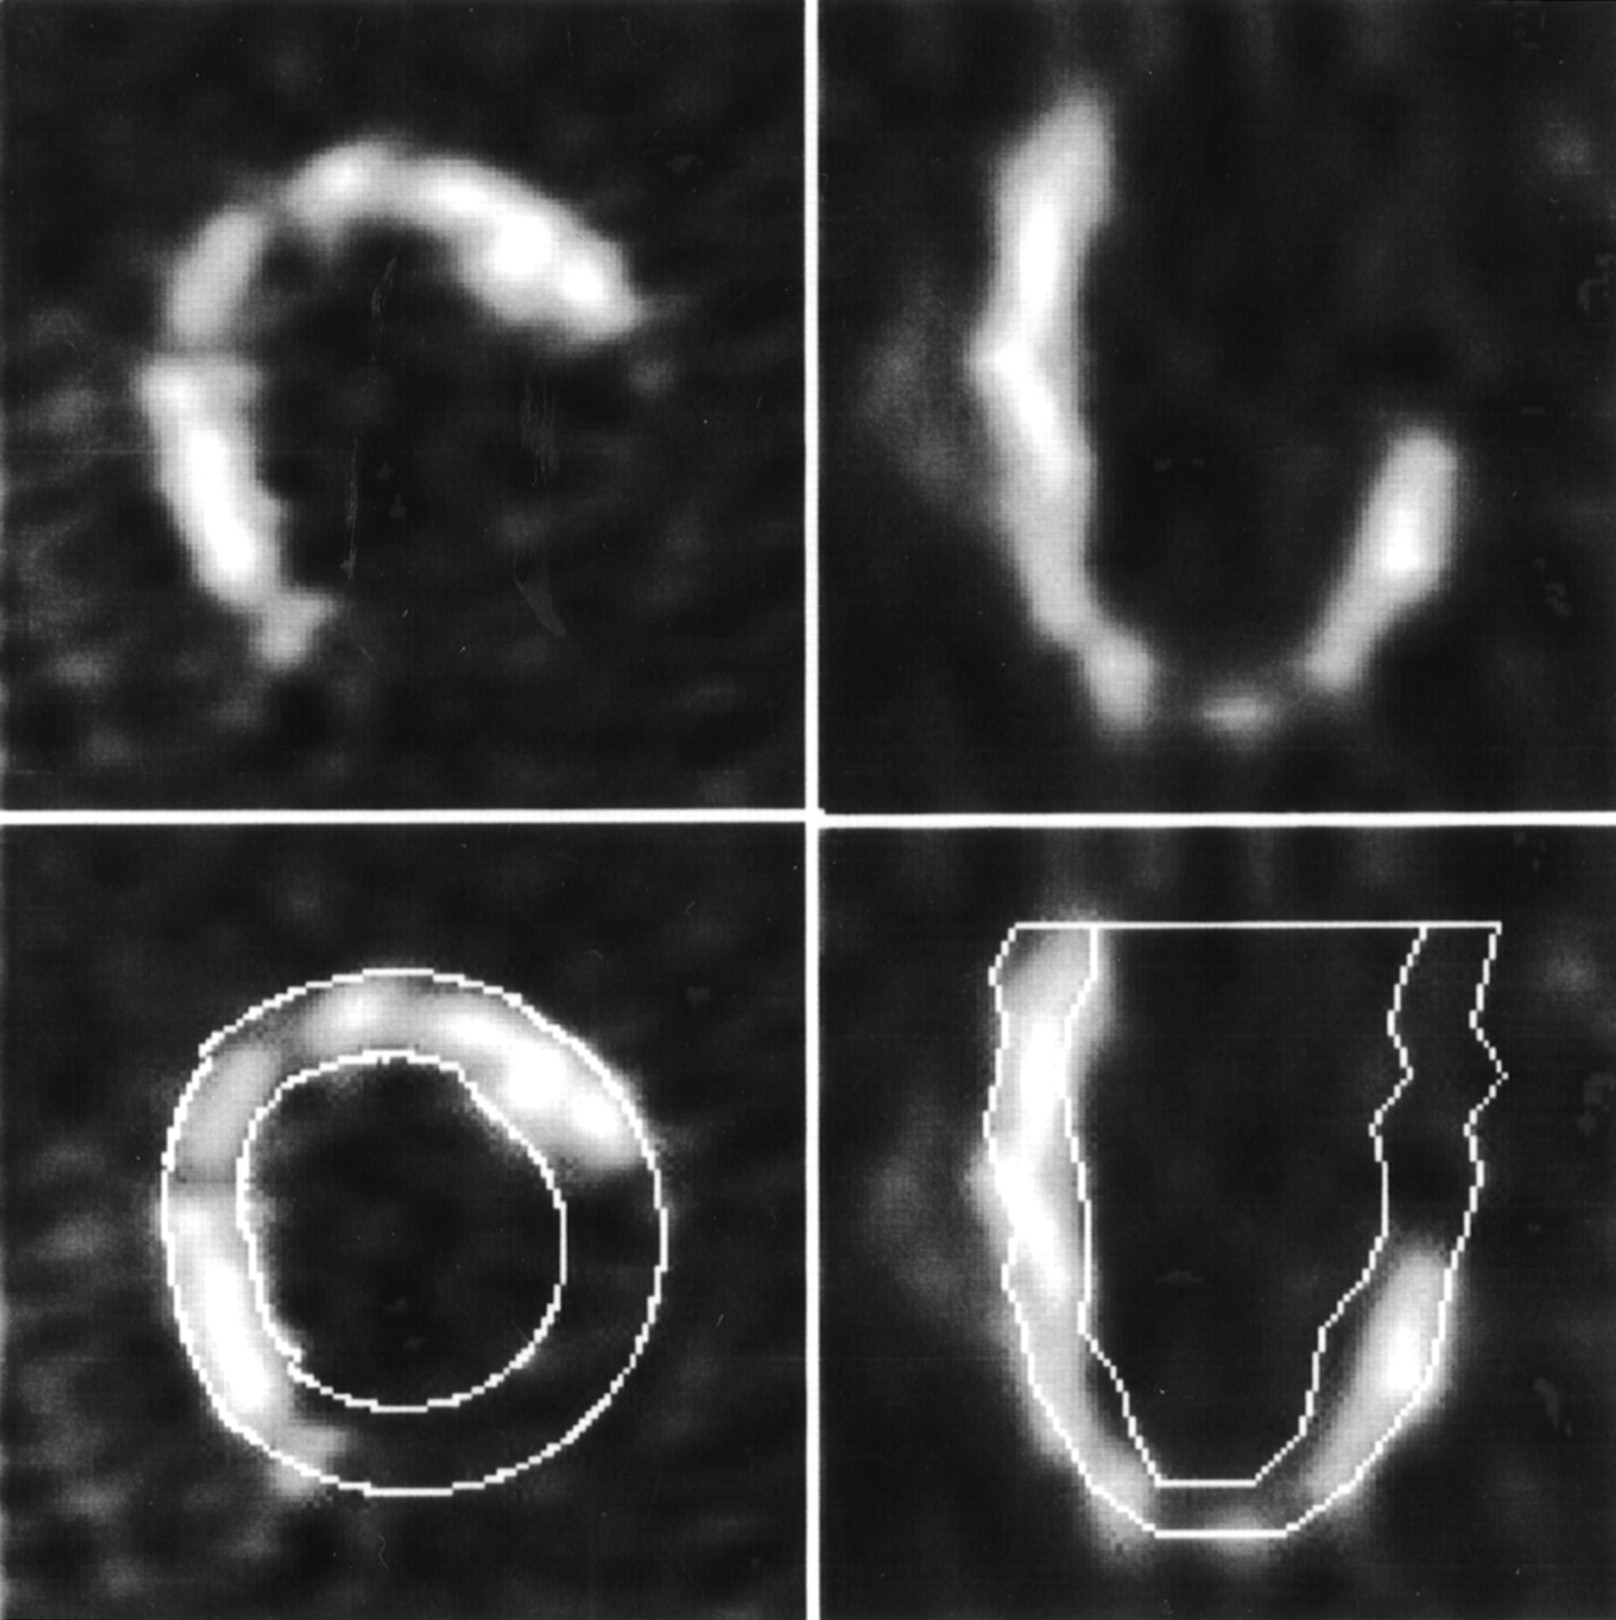
Example of model-based parameter estimation in patient with large defect in tracer uptake due to myocardial infarction: short-axis (left) and horizontal long-axis (right) images with estimated endocardial and epicardial contours (bottom row).
The interobserver variability of PET image analysis was 1% ± 5% (mean ± SD) for ejection fraction, 5 ± 16 mL for left ventricular volume, and 24 ± 17 g for left ventricular mass (A. Khorsand et al., unpublished data, 2003; all values not significantly different from 0).
MRI
A 1.5-Tesla MRI scanner (Gyroscan ACS NT; Philips) with a phased-array coil was used to acquire cardiac MR images. Guided by a spin-echo sequence in the axial position, a double-angulated multislice-multiphase sequence was performed using 12–16 phases for each slice. Interleaved images were obtained in 8–10 planes from the apex to the base (gradient-echo technique: echo time, 3.0 ms; repetition time, 6.4 ms; flip angle, 30°; slice thickness, 10 mm; no gap between slices). MR images were reconstructed using a matrix of 256 × 256 pixels.
After visual selection of the end-systolic and end-diastolic image sets, the endo- and epicardial contours of the left ventricle were traced by an operator on each short-axis image. Based on these contours, the left ventricular volumes and mass were calculated using Simpson’s method. The ejection fraction was then calculated from end-diastolic and end-systolic volumes. Experts who were unaware of the PET results analyzed the MRI data. In 2 of 20 patients, because of technical reasons only endocardial contours, not epicardial contours, could be derived. Thus, the comparison of left ventricular mass between PET and MRI was based on the data of 18 patients.
Statistical Analysis
Values are expressed as mean ± SD. Group comparisons between MRI and PET were performed using a paired t test. Regression analysis and Bland-Altmann analysis (20) were used to elucidate the relationship between MRI and PET measurements. A P value < 0.05 was considered to indicate statistical significance.
RESULTS
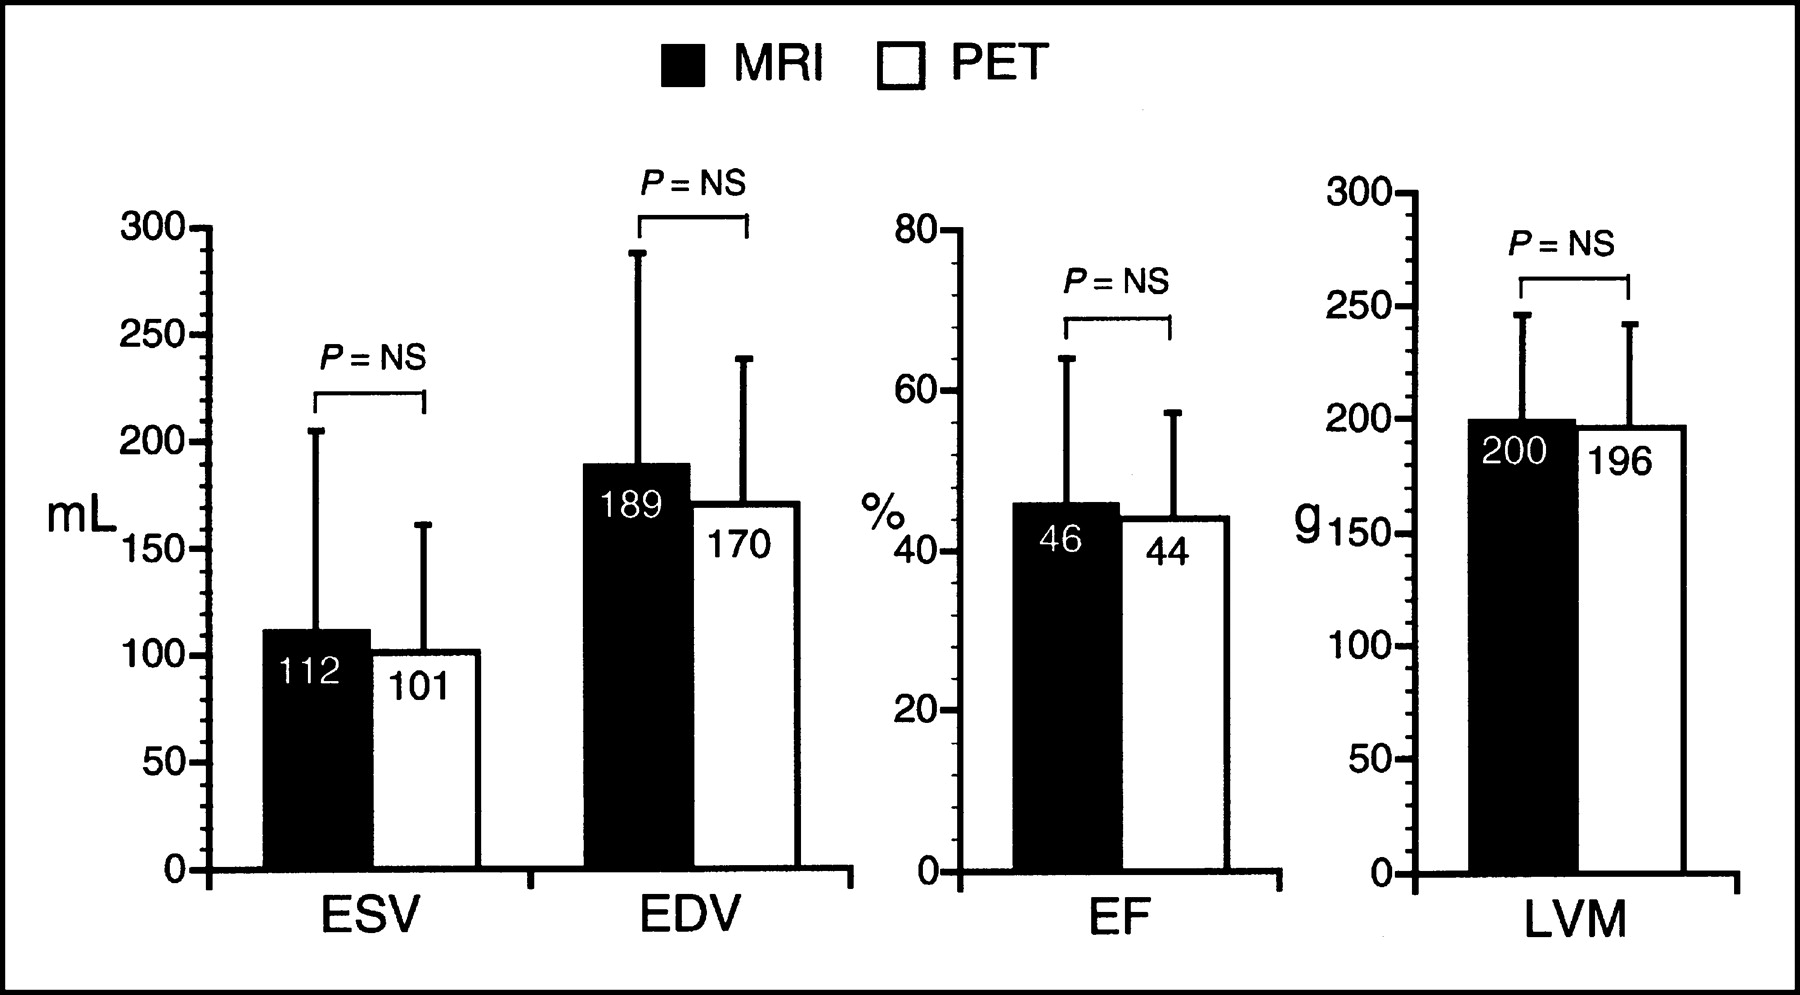
In the 20 patients, left ventricular volumes as measured by PET and MRI were 101 ± 60 mL and 112 ± 93 mL, respectively, at end systole and 170 ± 68 and 189 ± 99 mL, respectively, at end diastole. The left ventricular volume as estimated by PET was slightly lower than the value measured by MRI. Global ejection fraction was 44% ± 13% and 46% ± 18% by PET and MRI, respectively. Left ventricular mass by PET and MRI was 196 ± 44 g and 200 ± 46 g, respectively. There was no significant difference between PET and MRI measurements (P = not statistically significant, paired t test) (Fig. 4).

End-systolic (ESV) and end-diastolic (EDV) volumes of left ventricle, ejection fraction (EF), and left ventricular mass (LVM) as obtained from MRI and PET (P = not statistically significant [NS], paired t test).
A significant correlation was observed between PET and MRI for calculation of end-systolic volume (ESVPET = 0.6ESVMRI + 34.3, r = 0.93, SEE = 23.4, P < 0.0001) (Fig. 5A), end-diastolic volume (EDVPET = 0.63EDVMRI + 51.2, r = 0.92, SEE = 26.7, P < 0.0001) (Fig. 5B), ejection fraction (EFPET = 0.63EFMRI + 14.3, r = 0.85, SEE = 7.4, P < 0.0001) (Fig. 6A), and left ventricular mass (LVMPET = 0.71LVMMRI + 53, r = 0.75, SEE = 29.6, P < 0.001) (Fig. 6B).
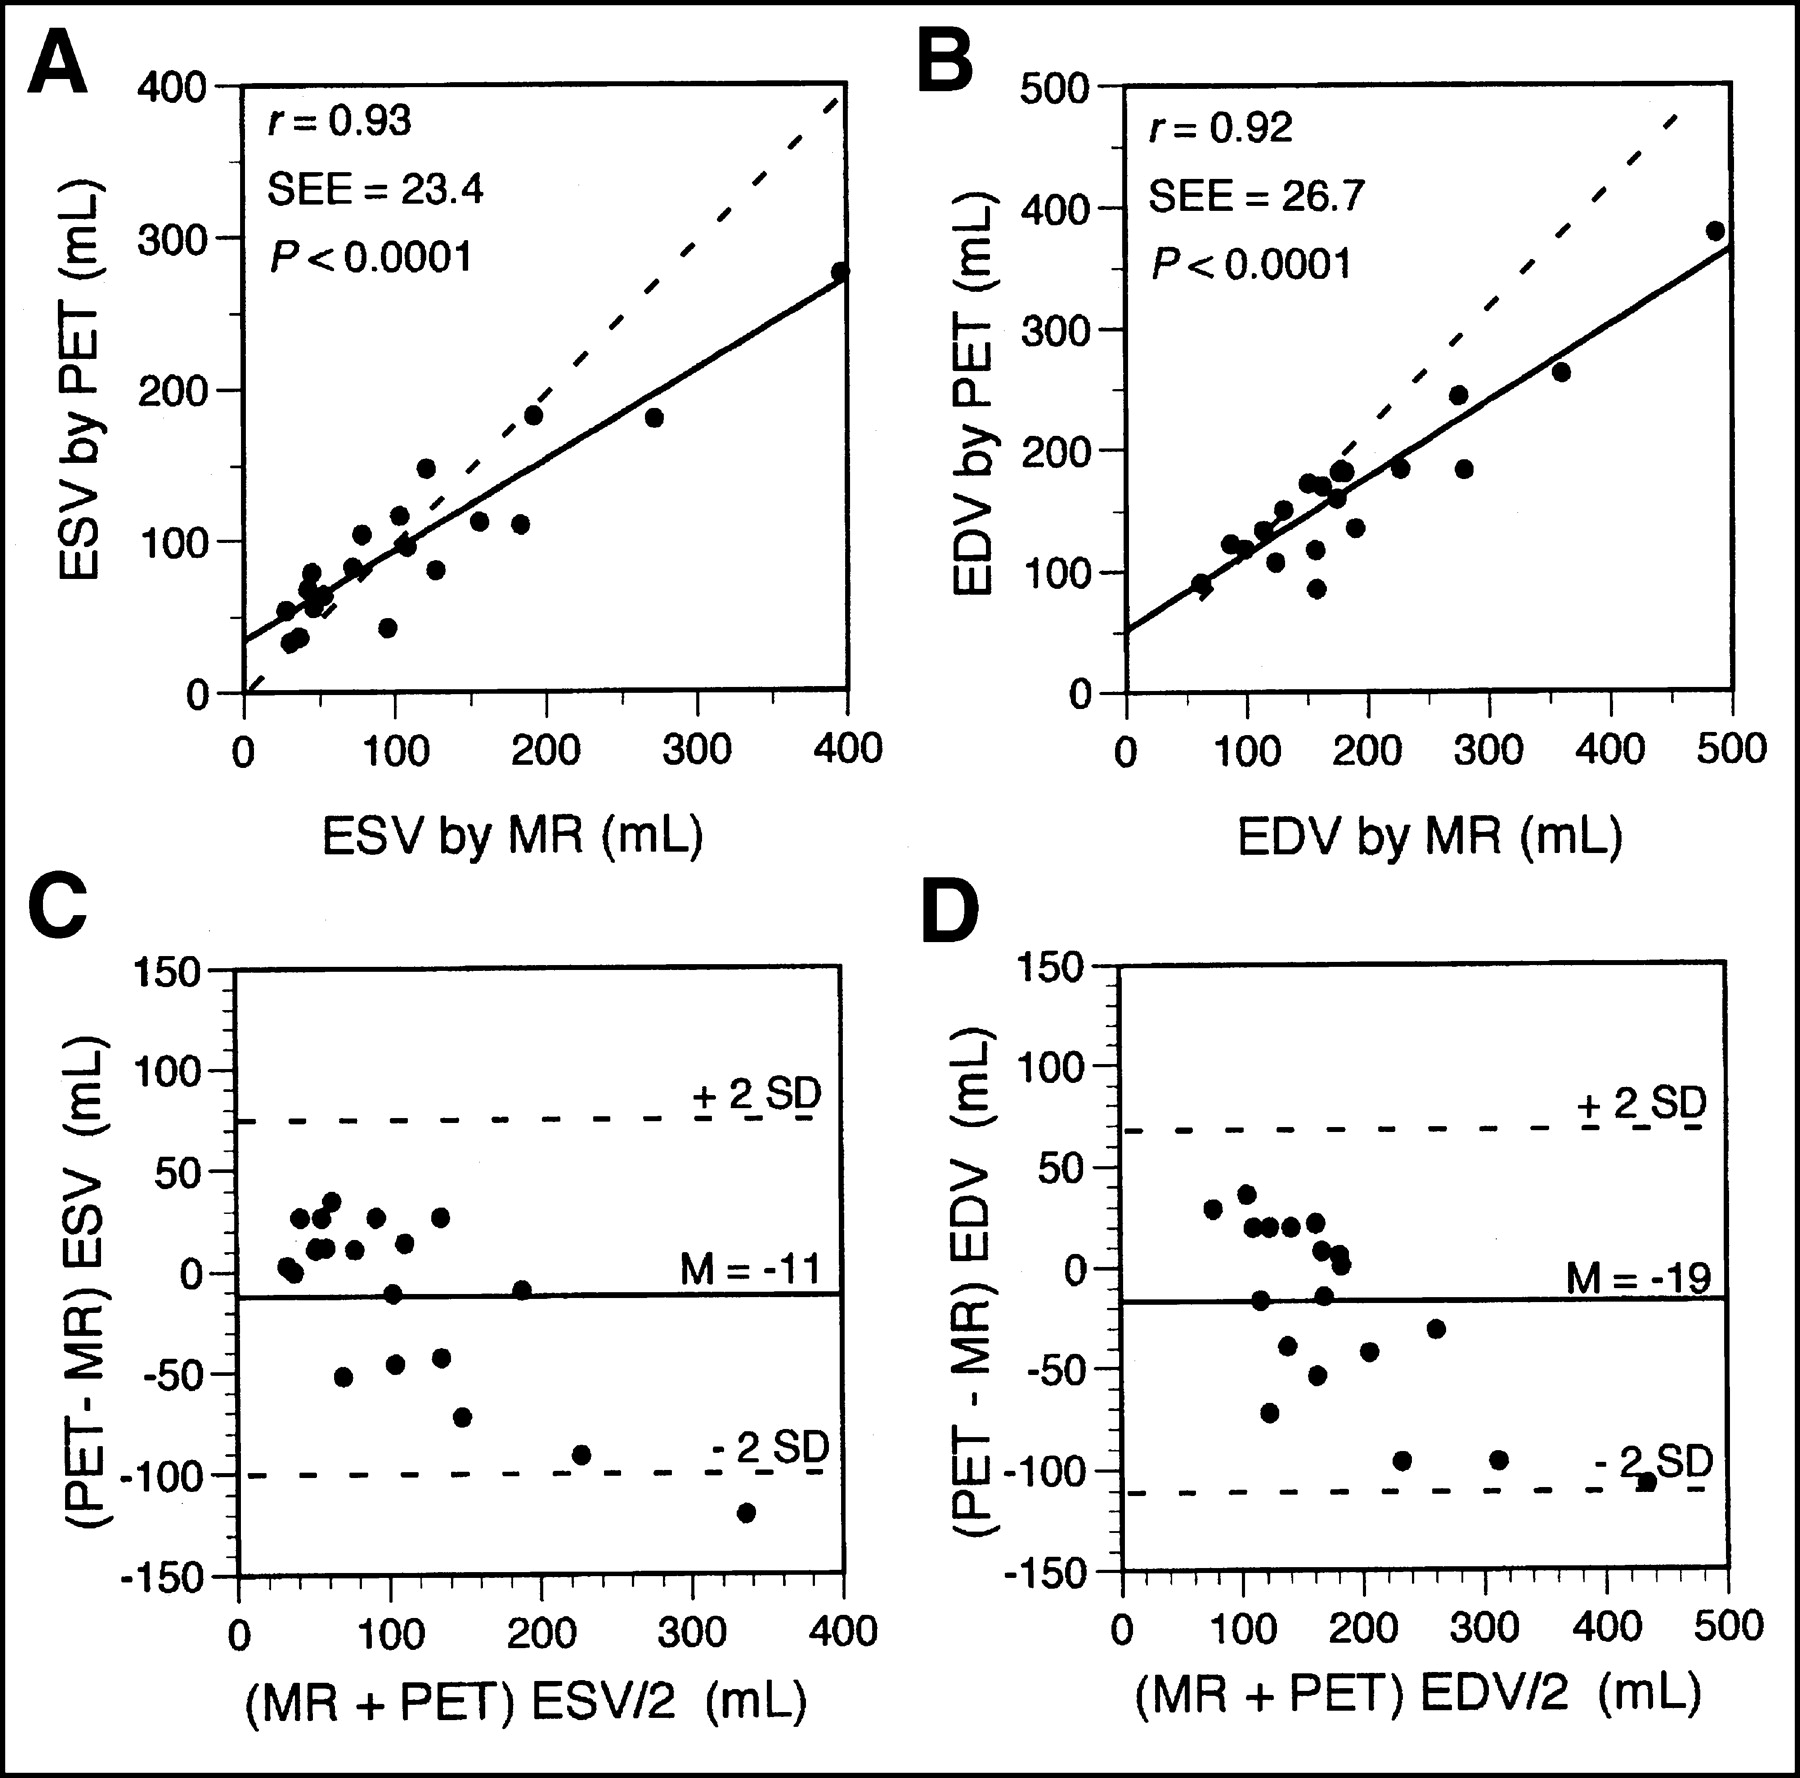
Regression analysis and Bland-Altman plots of end-systolic (ESV) (A and C) and end-diastolic (EDV) (B and D) volumes measured by PET and MRI. Dashed lines in A and B are lines of identity (PET value = MRI value). Mean difference (M) with 95% confidence limits (± 2 SDs) in C and D are presented by solid and dashed lines, respectively.
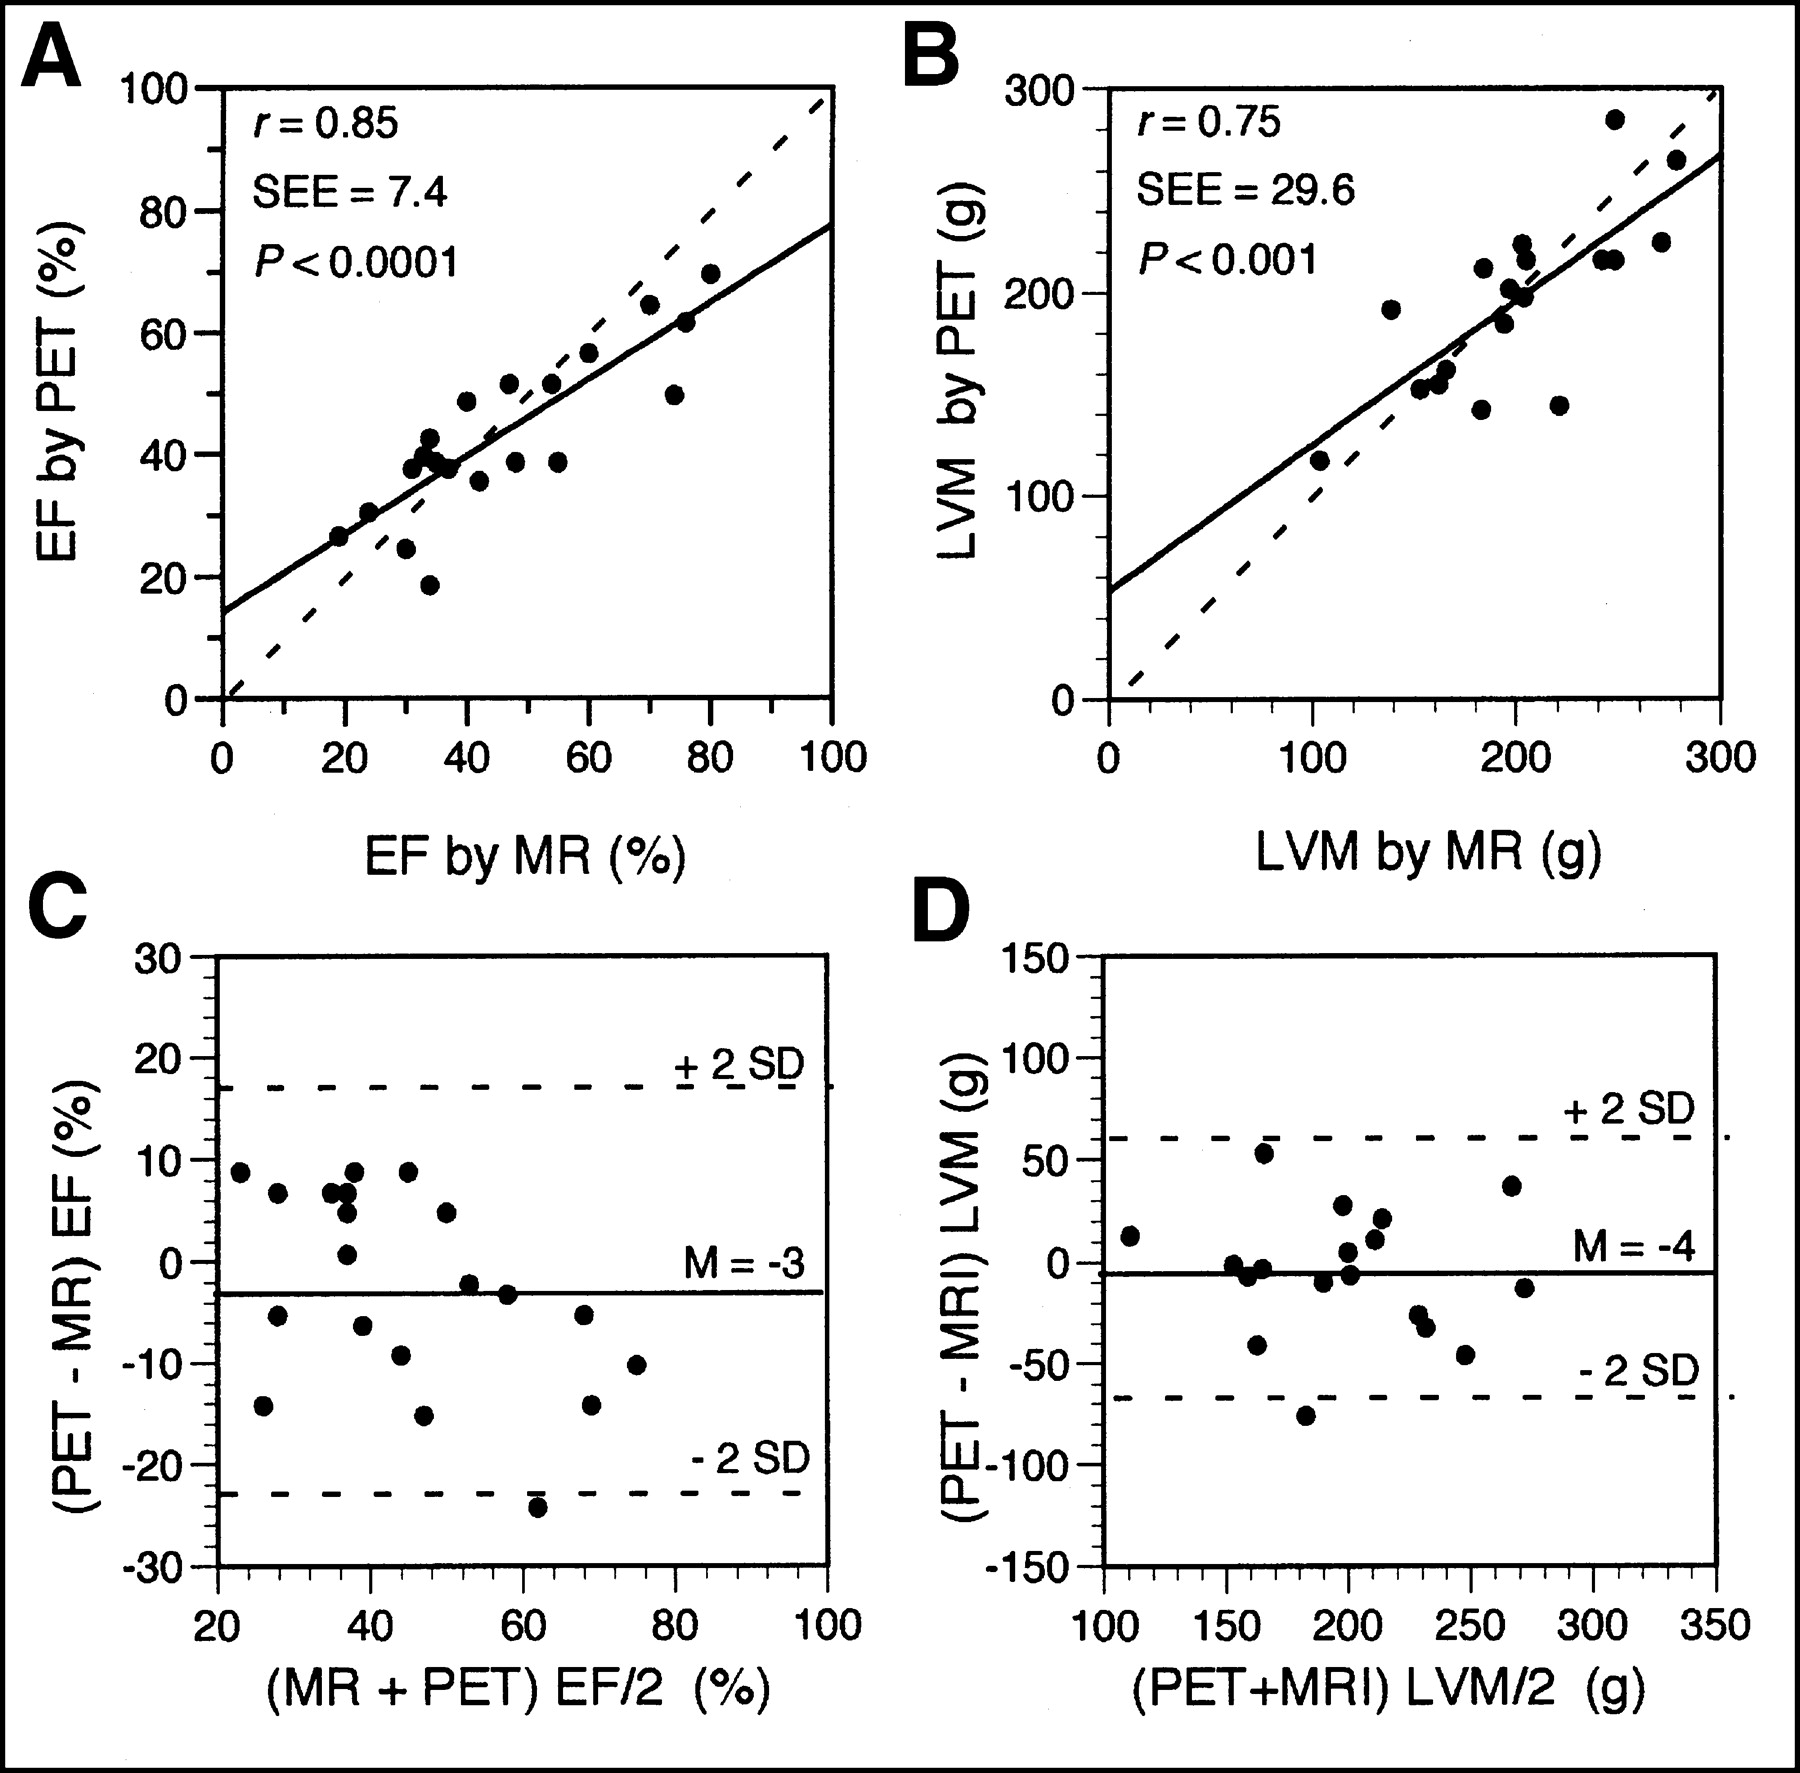
Regression analysis and Bland-Altman plots of ejection fraction (EF) (A and C) and left ventricular mass (LVM) (B and D) measured by PET and MRI. Dashed lines in A and B are lines of identity (PET value = MRI value). Mean difference (M) with 95% confidence limits (± 2 SDs) in C and D are presented by solid and dashed lines, respectively.
Bland-Altman analysis (Figs. 5C, 5D, 6C, and 6D) showed an excellent concordance between PET and MRI data, with PET yielding slightly lower values for volumes (−11 ± 44 mL for end-systolic volume and −19 ± 46 mL for end-diastolic volume), ejection fraction (−3% ± 10%), and mass (−4 ± 32 g).
DISCUSSION
This study used a semiautomated model-based parameter estimation method to derive from gated cardiac 18F-FDG PET images systolic and diastolic measurements of left ventricular volume and to calculate ejection fraction and myocardial mass. PET measurements were validated with reference values obtained from MRI. Excellent agreement was found between the 2 methods, indicating that gated cardiac PET and model-based image analysis can be used to assess and quantify global left ventricular function and left ventricular mass.
The accuracy of the model-based method for estimation of cardiac geometry depends on the quality of the gated images. A cardiac PET image of high quality and with sufficient tracer uptake is necessary for successful profile fitting. However, observed profiles are not always of high quality, and tracer uptake may be severely reduced in myocardial regions because of myocardial infarction. In addition, image noise may be excessive because of an inadequate counting rate, as may occur in diabetic patients. Another factor that may lead to poor-quality ECG-gated images is the irregular cardiac rhythm that may occur in patients with arrhythmias, such as atrial fibrillation or frequent extrasystoles.
In order also to apply the model-based method successfully in studies with limited image quality, segments with reduced tracer uptake were excluded from the fitting process. The information from neighboring segments was used to estimate the left ventricular radius and wall thickness for such segments. This method leads to acceptable results for most small regions and for some large regions with reduced tracer uptake. However, in some studies with large defects of tracer uptake, the results of the redefinition procedures for borders were not entirely adequate. This may partly account for the small differences between PET and MRI measurements. In addition, these differences may in part also be attributed to the selection of end-systolic and end-diastolic image frames, as the number of gates per cardiac cycle used for MRI (12–16 gates) and PET (8 gates) was different.
The impact of image quality on model fitting is particularly relevant for the estimation of wall thickness. A decrease in regional count activity and segmental interpolation may lead to unreliable estimates of regional wall thickness. Estimates of wall thickness, which range from 8 to 15 mm, are more affected than are estimates of left ventricular radius, which are usually larger than 15 mm. Therefore, PET estimates of myocardial mass, which is primarily determined by wall thickness, are less accurate than PET estimates of volume. Thus, for global parameters of ventricular function such as volumes or ejection fraction, these limitations were less important. Consequently, even for studies with low image quality or large defects in tracer uptake, the estimates of volume were sufficiently accurate.
The present study used filtered backprojection for PET image reconstruction. Recently, iterative image reconstruction has been increasingly used in PET, as the image quality of iterative reconstruction may be superior to that of filtered backprojection. Whether the accuracy of model-based parameter estimation may be improved by iterative image reconstruction remains undetermined. In cardiac SPECT, Quantitative Gated SPECT (QGS) software (Cedars-Sinai Medical Center) (10) is frequently used for automated calculation of cardiac volumes and ejection fraction. This method has found widespread application in clinical practice because of its ease of use. However, the correlation of quantitative estimates by QGS with MRI-derived data has been shown to be poor in animal experiments (21). As QGS has been specifically developed for SPECT, a QGS analysis tool for PET images is currently not available. Before a comparison of our model-based image analysis with QGS can be performed, the QGS algorithm would need to be adapted to reflect the characteristics of gated PET.
In contrast to an earlier study that reported regional wall geometry and contractile function as determined by PET and MRI in healthy subjects (6), the present study focused on global parameters of the left ventricle in a group of patients with cardiac disorders. With the use of a high-resolution MRI device and a sequence of short-axis rather than selected transaxial MR images, the validity of PET estimates of global parameters such as volume, ejection fraction, and left ventricular mass could be demonstrated.
CONCLUSION
Left ventricular volume, mass, and contractile function can be accurately measured from ECG-gated cardiac PET images using a model-based analysis technique to determine endocardial and epicardial borders. Cardiac PET using static, dynamic, and ECG-gated image acquisition may thus offer a near-simultaneous assessment of myocardial perfusion, metabolism, and contractile function.
Acknowledgments
The authors are grateful to the technologists of the PET center of the Department of Nuclear Medicine for their technical assistance in performing ECG-gated cardiac PET studies and for the support of the technicians in the MRI laboratory at the Vienna University and the Department of Radiology at the General Hospital, St. Poelten. This study was partly supported by the Verein zur Förderung der wissenschaftlichen Forschung am Rudolfinerhaus.
Footnotes
Received Dec. 18, 2002; revision accepted Jun. 10, 2003.
For correspondence or reprints contact: Gerold Porenta, MD, PhD, Rudolfinerhaus, Billrothstrasse 78, A-1190 Vienna, Austria.
E-mail: g.porenta{at}rudolfinerhaus.at


