
Main menu

  • Home
  • Content
    • Current
    • Ahead of print
    • Past Issues
    • JNM Supplement
    • SNMMI Annual Meeting Abstracts
    • Continuing Education
    • JNM Podcasts
  • Subscriptions
    • Subscribers
    • Institutional and Non-member
    • Rates
    • Journal Claims
    • Corporate & Special Sales
  • Authors
    • Submit to JNM
    • Information for Authors
    • Assignment of Copyright
    • AQARA requirements
  • Info
    • Reviewers
    • Permissions
    • Advertisers
  • About
    • About Us
    • Editorial Board
    • Contact Information
  • More
    • Alerts
    • Feedback
    • Help
    • SNMMI Journals
  • SNMMI
    • JNM
    • JNMT
    • SNMMI Journals
    • SNMMI

User menu

  • Subscribe
  • My alerts
  • Log in
  • Log out
  • My Cart

Search

  • Advanced search
Journal of Nuclear Medicine
  • SNMMI
    • JNM
    • JNMT
    • SNMMI Journals
    • SNMMI
  • Subscribe
  • My alerts
  • Log in
  • Log out
  • My Cart
Journal of Nuclear Medicine

Advanced Search

  • Home
  • Content
    • Current
    • Ahead of print
    • Past Issues
    • JNM Supplement
    • SNMMI Annual Meeting Abstracts
    • Continuing Education
    • JNM Podcasts
  • Subscriptions
    • Subscribers
    • Institutional and Non-member
    • Rates
    • Journal Claims
    • Corporate & Special Sales
  • Authors
    • Submit to JNM
    • Information for Authors
    • Assignment of Copyright
    • AQARA requirements
  • Info
    • Reviewers
    • Permissions
    • Advertisers
  • About
    • About Us
    • Editorial Board
    • Contact Information
  • More
    • Alerts
    • Feedback
    • Help
    • SNMMI Journals
  • View or Listen to JNM Podcast
  • Visit JNM on Facebook
  • Join JNM on LinkedIn
  • Follow JNM on Twitter
  • Subscribe to our RSS feeds
OtherBasic Science Investigations

A 3-Dimensional Absorbed Dose Calculation Method Based on Quantitative SPECT for Radionuclide Therapy: Evaluation for 131I Using Monte Carlo Simulation

Michael Ljungberg, Katarina Sjögreen, Xiaowei Liu, Eric Frey, Yuni Dewaraja and Sven-Erik Strand
Journal of Nuclear Medicine August 2002, 43 (8) 1101-1109;
Michael Ljungberg
  • Find this author on Google Scholar
  • Find this author on PubMed
  • Search for this author on this site
Katarina Sjögreen
  • Find this author on Google Scholar
  • Find this author on PubMed
  • Search for this author on this site
Xiaowei Liu
  • Find this author on Google Scholar
  • Find this author on PubMed
  • Search for this author on this site
Eric Frey
  • Find this author on Google Scholar
  • Find this author on PubMed
  • Search for this author on this site
Yuni Dewaraja
  • Find this author on Google Scholar
  • Find this author on PubMed
  • Search for this author on this site
Sven-Erik Strand
  • Find this author on Google Scholar
  • Find this author on PubMed
  • Search for this author on this site
  • Article
  • Figures & Data
  • Info & Metrics
  • PDF
Loading

Article Figures & Data

Figures

  • Tables
  • FIGURE 1.
    • Download figure
    • Open in new tab
    • Download powerpoint
    FIGURE 1.

    (A) Planar projection of defined activity distribution. (B) Monte Carlo simulated projection image of 131I of same activity distribution in air, that is, including only deterioration caused by collimator response and septal penetration. (C) Projection image obtained when including attenuation and scatter, which thus simulates real patient situation. (D) Projection image obtained for 32- to 132-keV scatter energy window, used for image registration procedure.

  • FIGURE 2.
    • Download figure
    • Open in new tab
    • Download powerpoint
    FIGURE 2.

    Mass density images used to mimic CT-derived mass density map for quantification. Maps 1–3 show transversal, coronal, and sagittal slices for the 3 test cases, before and after registration to SPECT image.

  • FIGURE 3.
    • Download figure
    • Open in new tab
    • Download powerpoint
    FIGURE 3.

    Flow chart describing methodology of quantification procedure and evaluation. Known activity map and gold standard absorbed dose distribution are compared with corresponding maps obtained from quantitative SPECT calculation scheme.
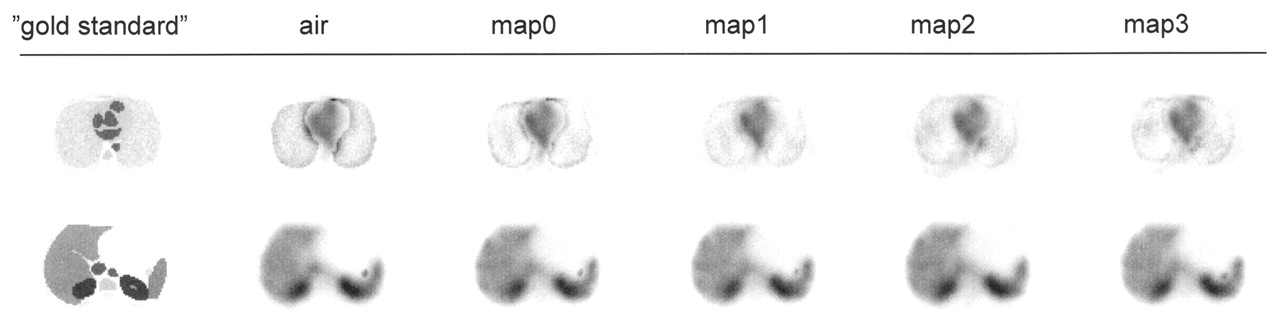
  • FIGURE 4.
    • Download figure
    • Open in new tab
    • Download powerpoint
    FIGURE 4.

    Transversal section of absorbed dose distribution for slice through lungs (top row) and liver (bottom row) for different cases. Images were all normalized to same gray level.

Tables

  • Figures
    • View popup
    TABLE 1

    The Defined Activity and Activity Concentration for Major Organs

    OrgankBq/cm3Volume (cm3)MBq in VOI
    Bladder67553.7
    Blood pool267528141.1
    Bone marrow8344537.1
    Heart8336830.7
    Kidney334299100.0
    Liver1671,151192.1
    Lung172,41340.3
    Pelvis10033333.4
    Spleen20021943.8
    Urine16712020.0
    Bone structures501,18759.4
    Remaining tissues1719,917332.6
    • View popup
    TABLE 2

    Activity Concentration per Voxel Within VOI

    Simulated organKnownAirNonuniform attenuation correction
    ESSE + map 0ESSE + map 1ESSE + map 2ESSE + map 3
    Kidney334 ± 0.0248 ± 75.3255 ± 73.1253 ± 72.4258 ± 75.0258 ± 75.7
    Lung17 ± 0.028 ± 16.423 ± 16.224 ± 16.827 ± 19.425 ± 17.2
    Pancreas17 ± 0.047 ± 18.667 ± 22.168 ± 22.266 ± 22.165 ± 21.7
    Spleen200 ± 0.0163 ± 54.9173 ± 51.9174 ± 51.2166 ± 47.3169 ± 46.7
    Liver167 ± 0.0152 ± 36.6164 ± 40.5163 ± 39.8166 ± 40.4166 ± 41.3
    Heart83 ± 0.0117 ± 52.3128 ± 55.5129 ± 54.8127 ± 55.3127 ± 55.7
    Bone marrow83 ± 0.067 ± 21.081 ± 25.480 ± 23.379 ± 26.781 ± 22.3
    Total activity in phantom (GBq)1.0001.0891.0901.0901.0881.096
    • Data are mean ± SD, in kBq/cm3.

    • View popup
    TABLE 3

    Absorbed Dose per Voxel Within VOI

    Simulated organKnownAirNonuniform attenuation correction
    ESSE + map 0ESSE + map 1ESSE + map 2ESSE + map 3
    Kidney10.1 ± 0.58.7 ± 2.48.6 ± 2.28.5 ± 2.28.7 ± 2.38.7 ± 2.3
    Lung2.4 ± 0.43.3 ± 1.52.5 ± 1.22.3 ± 1.02.3 ± 1.02.4 ± 1.1
    Pancreas1.3 ± 0.22.2 ± 0.72.8 ± 0.82.9 ± 0.82.8 ± 0.82.8 ± 0.8
    Spleen6.2 ± 0.45.8 ± 1.75.9 ± 1.65.9 ± 1.55.7 ± 1.45.7 ± 1.4
    Liver5.5 ± 0.45.6 ± 1.25.8 ± 1.35.7 ± 1.35.8 ± 1.35.8 ± 1.3
    Heart3.1 ± 0.34.4 ± 1.74.6 ± 1.74.7 ± 1.64.7 ± 1.74.6 ± 1.7
    Bone marrow2.9 ± 0.32.6 ± 0.72.9 ± 0.92.8 ± 0.82.8 ± 0.92.9 ± 0.8
    • Data are mean ± SD, in grays.

PreviousNext
Back to top

In this issue

Journal of Nuclear Medicine: 43 (8)
Journal of Nuclear Medicine
Vol. 43, Issue 8
August 1, 2002
  • Table of Contents
  • Index by author
Print
Download PDF
Article Alerts
Sign In to Email Alerts with your Email Address
Email Article

Thank you for your interest in spreading the word on Journal of Nuclear Medicine.

NOTE: We only request your email address so that the person you are recommending the page to knows that you wanted them to see it, and that it is not junk mail. We do not capture any email address.

Enter multiple addresses on separate lines or separate them with commas.
A 3-Dimensional Absorbed Dose Calculation Method Based on Quantitative SPECT for Radionuclide Therapy: Evaluation for 131I Using Monte Carlo Simulation
(Your Name) has sent you a message from Journal of Nuclear Medicine
(Your Name) thought you would like to see the Journal of Nuclear Medicine web site.
Citation Tools
A 3-Dimensional Absorbed Dose Calculation Method Based on Quantitative SPECT for Radionuclide Therapy: Evaluation for 131I Using Monte Carlo Simulation
Michael Ljungberg, Katarina Sjögreen, Xiaowei Liu, Eric Frey, Yuni Dewaraja, Sven-Erik Strand
Journal of Nuclear Medicine Aug 2002, 43 (8) 1101-1109;

Citation Manager Formats

  • BibTeX
  • Bookends
  • EasyBib
  • EndNote (tagged)
  • EndNote 8 (xml)
  • Medlars
  • Mendeley
  • Papers
  • RefWorks Tagged
  • Ref Manager
  • RIS
  • Zotero
Share
A 3-Dimensional Absorbed Dose Calculation Method Based on Quantitative SPECT for Radionuclide Therapy: Evaluation for 131I Using Monte Carlo Simulation
Michael Ljungberg, Katarina Sjögreen, Xiaowei Liu, Eric Frey, Yuni Dewaraja, Sven-Erik Strand
Journal of Nuclear Medicine Aug 2002, 43 (8) 1101-1109;
Twitter logo Facebook logo LinkedIn logo Mendeley logo
  • Tweet Widget
  • Facebook Like
  • Google Plus One
Bookmark this article

Jump to section

  • Article
    • Abstract
    • MATERIALS AND METHODS
    • RESULTS
    • DISCUSSION
    • CONCLUSION
    • Acknowledgments
    • Footnotes
    • REFERENCES
  • Figures & Data
  • Info & Metrics
  • PDF

Related Articles

  • No related articles found.
  • PubMed
  • Google Scholar

Cited By...

  • Study of the Impact of Tissue Density Heterogeneities on 3-Dimensional Abdominal Dosimetry: Comparison Between Dose Kernel Convolution and Direct Monte Carlo Methods
  • An Evidence-Based Review of Quantitative SPECT Imaging and Potential Clinical Applications
  • Lung Dosimetry for Radioiodine Treatment Planning in the Case of Diffuse Lung Metastases
  • Accurate Dosimetry in 131I Radionuclide Therapy Using Patient-Specific, 3-Dimensional Methods for SPECT Reconstruction and Absorbed Dose Calculation
  • Dosimetry of Internal Emitters
  • Google Scholar

More in this TOC Section

  • Tumor Uptake of Anti-CD20 Fabs Depends on Tumor Perfusion
  • How Sensitive Is the Upper Gastrointestinal Tract to 90Y Radioembolization? A Histologic and Dosimetric Analysis in a Porcine Model
  • 11C-Methionine PET of Myocardial Inflammation in a Rat Model of Experimental Autoimmune Myocarditis
Show more Basic Science Investigations

Similar Articles

SNMMI

© 2025 SNMMI

Powered by HighWire