


Article Figures & Data
Figures
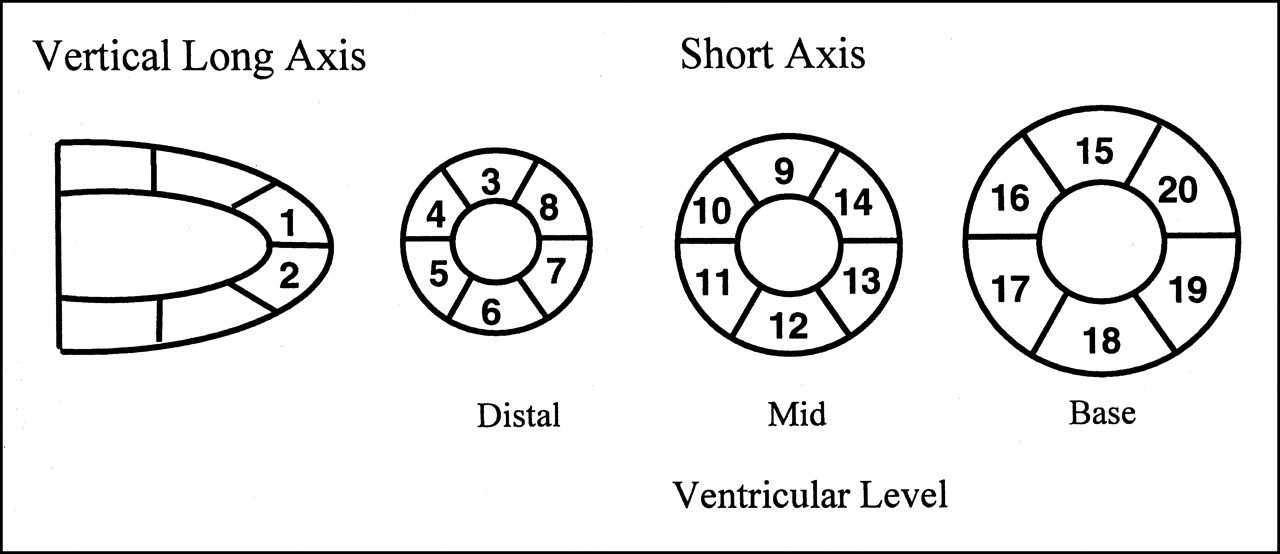
- FIGURE 1.
Schematic representation of 20-segment model of left ventricle.
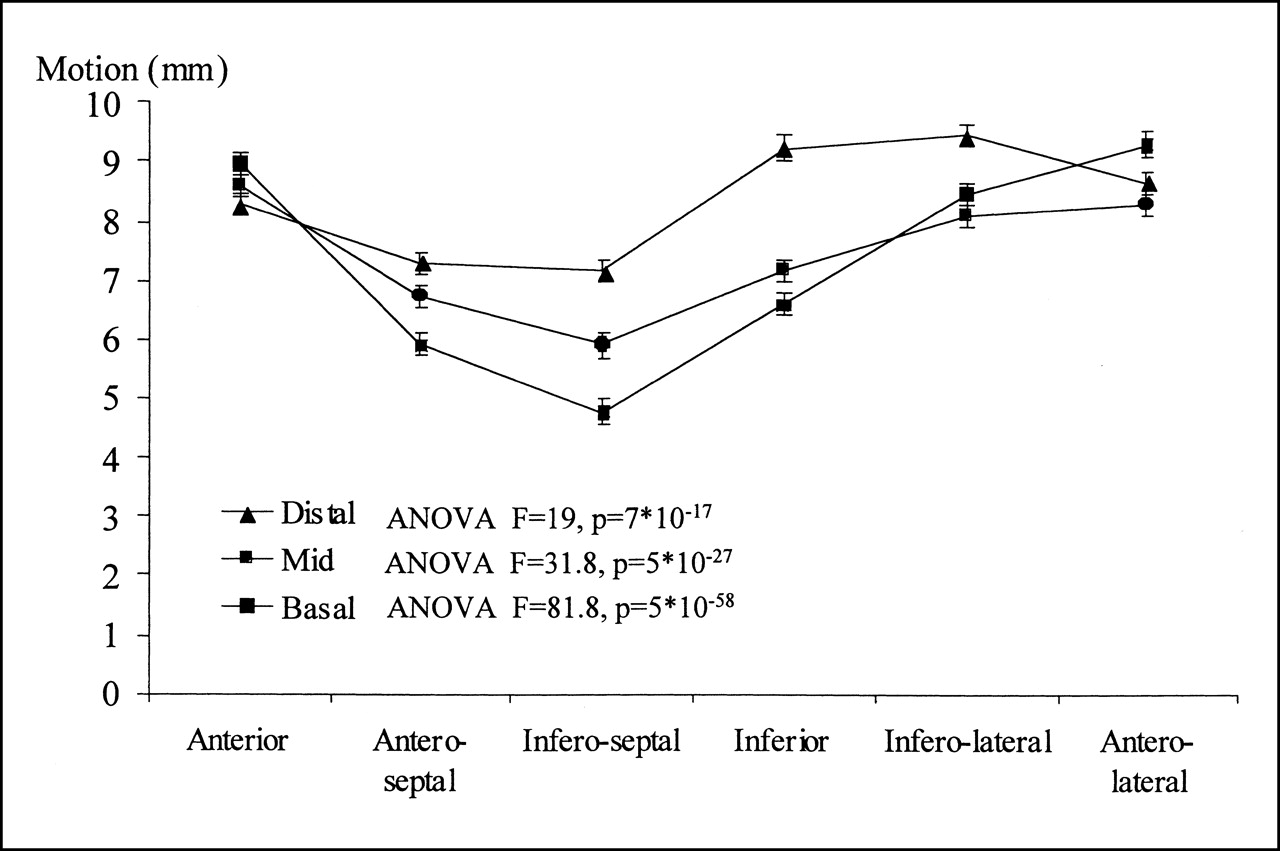
- FIGURE 2.
Plot of normal motion and thickening (mean ± SEM) at 4 levels from apex to base.
- FIGURE 3.
Circumferential variations in normal segmental motion at distal, mid, and basal ventricular levels.
- FIGURE 4.
Circumferential variations in normal segmental thickening at distal, mid, and basal ventricular levels.
- FIGURE 5.
Thresholds (number of SDs below reference value) for defining motion (A) and thickening (B) abnormalities.
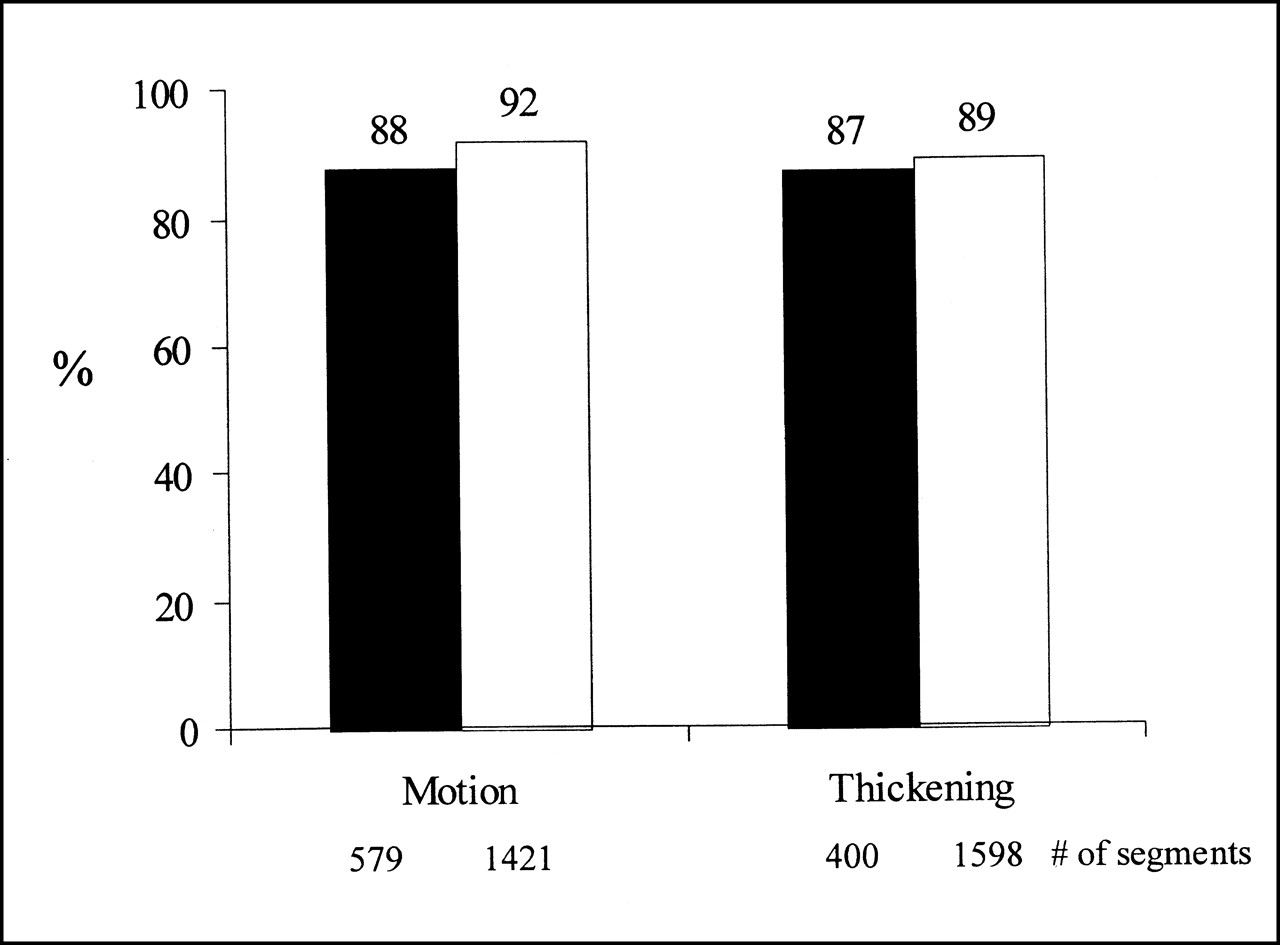
- FIGURE 6.
Overall sensitivity (black bars) and specificity (white bars) in detecting segmental motion and thickening abnormalities by quantitative algorithm in validation group.
- FIGURE 7.
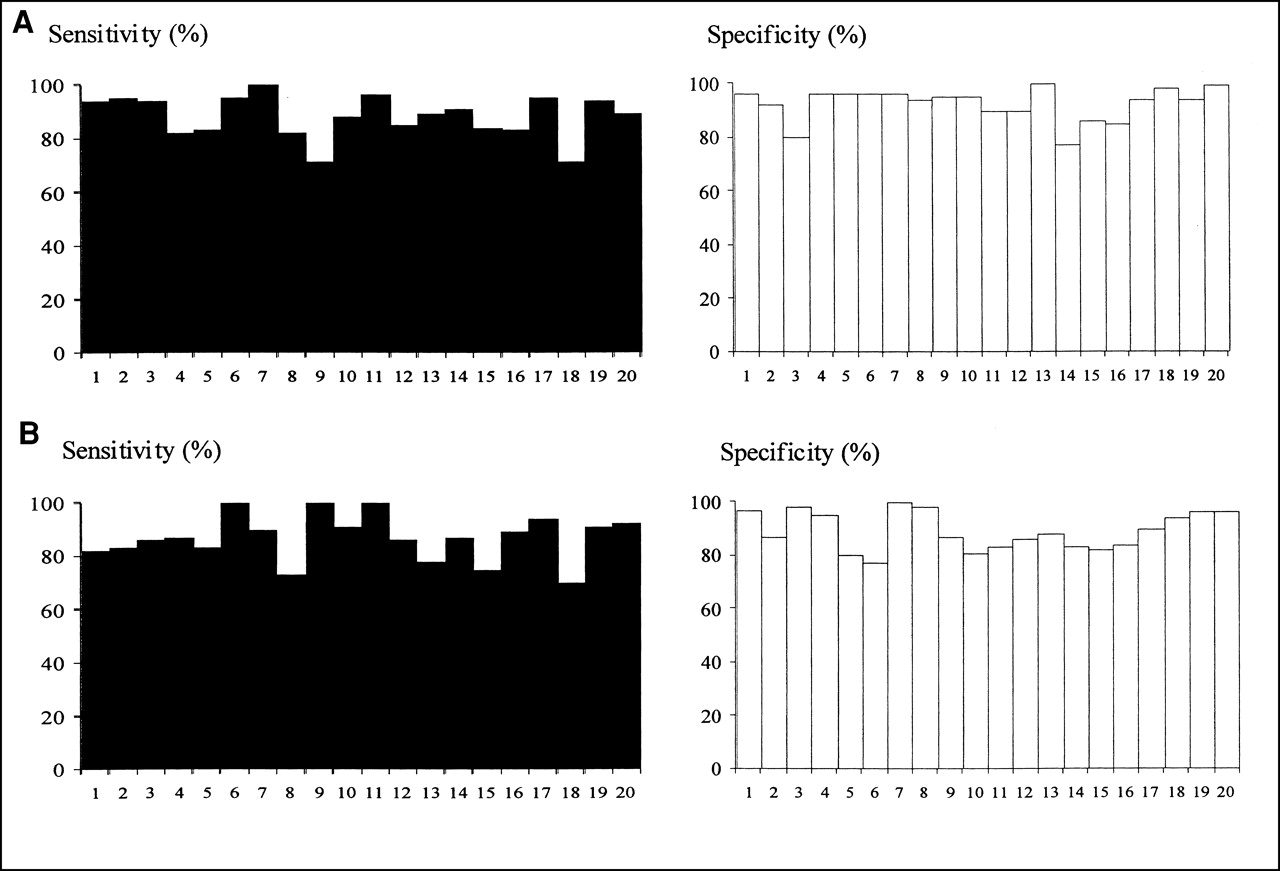
Segment-by-segment sensitivity (black bars) and specificity (white bars) in detecting motion (A) and thickening (B) abnormalities by quantitative algorithm in validation group.
- FIGURE 8.
Correlation between quantitative versus visual summed motion score (A) and summed thickening score (B). Solid line indicates linear fit and dashed line indicates line of identity.


Tables
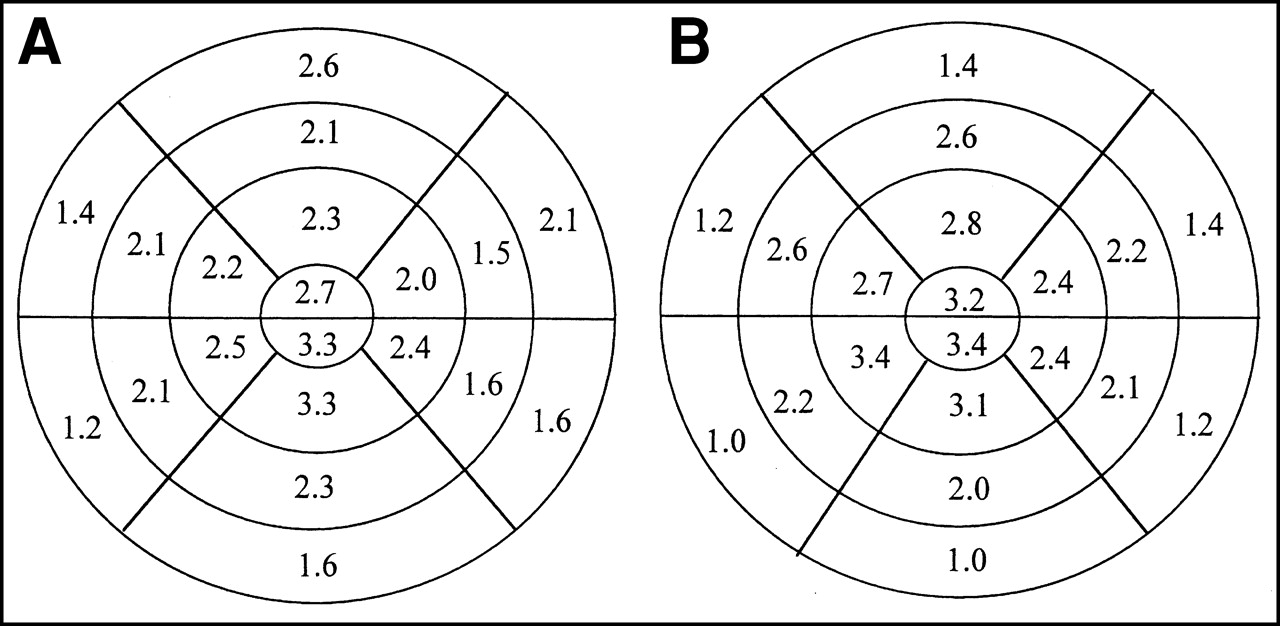
Parameter Low likelihood (n = 64) Training (n = 101) Validation (n = 100) Age (y) 56 ± 11*† 65 ± 12 64 ± 13 Men 33 (52%) 65 (64%) 63 (63%) History of myocardial infarction 0 (0%)*† 35 (34.7%) 31 (31%) History of coronary angioplasty 0 (0%)*† 24 (23.8%) 26 (26%) History of bypass surgery 0 (0%)*† 10 (9.9%) 12 (12%) Diabetes mellitus 1 (1.5%)*† 17 (16.8%) 11 (11%) Hypertension 0 (0%)† 47 (64.5%) 57 (57%) Typical angina 0 (0%)*† 16 (15.8%) 15 (15%) Shortness of breath 5 (7.8%) 14 (13.9%) 11 (11%) Prescan likelihood of CAD 0.02 ± 0.01*† 0.63 ± 0.41 0.60 ± 0.40 Summed stress score 0.3 ± 1.0*† 11 ± 11 9 ± 10 Summed rest score 0 ± 0*† 5 ± 8 4 ± 8 Summed difference score 0.3 ± 1.0*† 6 ± 8 5 ± 6 Ejection fraction (%) 66 ± 8*† 46 ± 17 43_16 Segment Location Motion (mm) Thickening (%) 1 Anteroapical 8.4 ± 1.8 68 ± 14 2 Inferoapical 9.1 ± 1.8 69 ± 13 3 Distal anterior 8.1 ± 1.5 59 ± 13 4 Distal anteroseptal 7.2 ± 1.6 58 ± 13 5 Distal inferoseptal 7.2 ± 1.6 61 ± 12 6 Distal inferior 9.1 ± 1.6 60 ± 13 7 Distal inferolateral 9.5 ± 1.7 60 ± 14 8 Distal anterolateral 9.2 ± 1.7 61 ± 13 9 Mid anterior 8.6 ± 1.4 48 ± 10 10 Mid anteroseptal 6.7 ± 1.6 45 ± 11 11 Mid inferoseptal 5.9 ± 1.6 43 ± 9 12 Mid inferior 7.2 ± 1.3 45 ± 11 13 Mid inferolateral 8.1 ± 1.5 49 ± 12 14 Mid anterolateral 8.3 ± 1.5 48 ± 12 15 Basal anterior 9.0 ± 1.6 23 ± 10 16 Basal anteroseptal 5.9 ± 1.7 23 ± 10 17 Basal inferoseptal 4.8 ± 1.7 20 ± 9 18 Basal inferior 6.6 ± 1.5 22 ± 10 19 Basal inferolateral 8.5 ± 1.6 28 ± 13 20 Basal anterolateral 9.3 ± 1.6 26 ± 12 Average 7.8 ± 2.0 46 ± 20 Data are expressed as mean ± SD; n = 64.
Automatic scores Visual scores Total 0–1 2 3 4 5 0–1 1,314 60 6 3 0 1,383 2 73 132 42 7 2 256 3 27 75 99 19 9 229 4 5 11 17 31 6 70 5 2 3 6 31 20 62 Total 1,421 281 170 91 37 2,000 Agreement = 80%; weighted κ = 0.71; SE = 0.02.
Boldface type indicates segments with exact agreement.
Automatic scores Visual scores Total 0–1 2 3 0–1 1,426 48 3 1,477 2 163 209 27 401 3 11 31 82 127 Total 1,600 288 112 2,000 Agreement = 86%; weighted κ = 0.68; SE = 0.02.
Boldface type indicates segments with exact agreement.
In this issue


Jump to section
Related Articles
Cited By...
- Comparison Between Ultrafast and Standard Single-Photon Emission CT in Patients With Coronary Artery Disease: A Pilot Study
- Are Shades of Gray Prognostically Useful in Reporting Myocardial Perfusion Single-Photon Emission Computed Tomography?
- Stress/Rest Myocardial Perfusion Abnormalities by Gated SPECT: Still the Best Predictor of Cardiac Events in Stable Ischemic Heart Disease
- Automatic Global and Regional Phase Analysis from Gated Myocardial Perfusion SPECT Imaging: Application to the Characterization of Ventricular Contraction in Patients with Left Bundle Branch Block
- Effect of Intramyocardial Injection of Autologous Bone Marrow-Derived Mononuclear Cells on Perfusion, Function, and Viability in Patients with Drug-Refractory Chronic Ischemia
- Attenuation Correction of Myocardial SPECT Perfusion Images with Low-Dose CT: Evaluation of the Method by Comparison with Perfusion PET
- Gated Myocardial Perfusion SPECT: Basic Principles, Technical Aspects, and Clinical Applications
- Prognostic Value of Rest 201Tl-Dipyridamole Stress 99mTc-Sestamibi Gated SPECT for Predicting Patient-Based Clinical Outcomes After Bypass Surgery in Patients with Ischemic Left Ventricular Dysfunction
- Gated SPECT and the Visual Gold Standard: Gold Standard or Not?