


Abstract
18F-FDG has been used to image mouse xenograft models with small-animal PET for therapy response. However, the reproducibility of serial scans has not been determined. The purpose of this study was to determine the reproducibility of 18F-FDG small-animal PET studies. Methods: Mouse tumor xenografts were formed with B16F10 murine melanoma cells. A 7-min small-animal PET scan was performed 1 h after a 3.7- to 7.4-MBq 18F-FDG injection via the tail vein. A second small-animal PET scan was performed 6 h later after reinjection of 18F-FDG. Twenty-five sets of studies were performed. Mean injected dose per gram (%ID/g) values were calculated from tumor regions of interest. The coefficient of variation (COV) from studies performed on the same day was calculated to determine the reproducibility. Activity from the second scans performed after 6 h were adjusted by subtracting the estimated residual activity from the first 18F-FDG injection. For 7 datasets, an additional scan immediately before the second injection was performed, and residual activity from this additional delayed scan was subtracted from the activity of the second injection. COVs of both subtraction methods were compared. Blood glucose values were measured at the time of injection and used to correct the %ID/g values. Results: The COV for the mean %ID/g between 18F-FDG small-animal PET scans performed on the same day 6 h apart was 15.4% ± 12.6%. The delayed scan subtraction method did not produce any significant change in the COV. Blood glucose correction increased the COV. The injected dose, tumor size, and body weight did not appear to contribute to the variability of the scans. Conclusion: 18F-FDG small-animal PET mouse xenograft studies were reproducible with moderately low variability. Therefore, serial small-animal PET studies may be performed with reasonable accuracy to measure tumor response to therapy.
Tumors have a high metabolic rate and accumulate glucose at a higher rate than normal surrounding tissues in the body (1). 18F-FDG is an analog of deoxyglucose that has been used for cancer imaging using the radioactive label 18F (110-min half-life) and PET imaging techniques (2).
Applications of 18F-FDG include assessing response to therapy for tumor models. Serial scans are performed to monitor changes in tracer accumulation over time. 18F-FDG can therefore be used to test the efficacy of anticancer drugs, including drugs under development with microPET in preclinical animal studies (3,4). Serial studies are potentially useful to determine if the drug inhibits tumor metabolism.
With the increased use of 18F-FDG microPET scans for determining therapy response and drug efficacy, the reproducibility of scans needs to be studied. The levels of variation in these scans must be known so that serial changes reflect therapy effects rather than changes related to mouse physiology and method variability. The purpose of this study was to determine the reproducibility of microPET scans with 18F-FDG in a mouse xenograft model. We show that the reproducibility has a moderately low variability, which would likely be useful in serial drug or therapy evaluation. Changes in blood glucose levels can affect 18F-FDG accumulation in tumors (5). Glucose can compete with 18F-FDG, resulting in the decrease of 18F-FDG tumor accumulation. Changes in blood glucose levels depend on many factors, such as mode of anesthesia and fasting duration (6,7). Therefore, the other purpose of this study was to assess the relationship between blood glucose levels and 18F-FDG tumor accumulation.
MATERIALS AND METHODS
Radiotracers
18F-FDG was supplied by PETNET Pharmaceuticals with high specific activity.
Cell Culture
B16F10 murine melanoma cells were grown in Dulbecco's modified Eagle media with high glucose and l-glutamine (Invitrogen) supplemented with 10% fetal bovine serum and 1% penicillin (100 U/mL)/streptomycin (100 μg/mL). Cells were harvested by trypsinization at approximately 90% confluence.
Mouse Tumor Xenograft Model
Animal protocols were approved by the Stanford Administrative Panel on Laboratory Animal Care. Eighteen 10- to 12-wk-old female nude (nu/nu) mice (Charles River Laboratories) were injected in the shoulder region with 2 million B16F10 cells in 100 μL of phosphate-buffered saline (PBS) using 28-gauge ½-in. insulin syringes (Becton Dickinson). Mice were anesthetized with 2% isoflurane in 2 L/min oxygen during cell injection. The tumor xenografts grew for 1–2 wk. Tumors were measured externally with calipers, and the mean tumor diameter was 15 mm, with a range of 9–20 mm.
microPET
An R4 microPET (Siemens Medical Solutions USA, Inc.) was used for imaging, which has an approximate resolution of 2 mm in each axial direction (8). After a tail vein injection of 3.7–7.4 MBq of 18F-FDG in 200 μL of PBS, a 7-min prone acquisition scan was performed approximately 60 min after injection. Mice were maintained under isoflurane anesthesia during the injection, accumulation, and scanning periods. A heating pad, heat lamp, or hot water was used to dilate the tail veins for injections. A second scan was performed with a repeat injection of 18F-FDG approximately 6 h after the first injection. Six hours was chosen to allow for the activity from the first injection to decay for approximately 3–4 half lives. It was assumed that the tumor xenografts did not significantly change during the 6 h. Caliper tumor measurements were not significantly different between the 2 scans. Mouse body weight, tumor size, and rectal temperature were also recorded. Mice were fasted for 4 h before the first tracer injection. After the first scan, the mice recovered from anesthesia and were given access to food for 1 h. The mice were then fasted for 4 h before the second injection. Mice were kept warm using a heating pad or heat lamp while under anesthesia to maintain a body temperature of around 35°C.
microPET images were reconstructed with the ordered-subsets expectation-maximization algorithm (9) using 16 subsets and 4 iterations. No attenuation correction was applied, as an attenuation-corrected cylinder phantom study and an attenuation-correction scan performed with the body outline of a mouse using uniform attenuation both showed very little change in the activity profile across the mouse (10).
Imaging Sessions
Eighteen mice were used for scanning. Five of the mice had 3 sets of studies performed. Ten mice had 1 set of studies performed. Twenty-five datasets were obtained. During the experiment 5 mice died. One scan could not be retrieved and, therefore, was excluded from analysis. In addition, we performed an additional microPET scan just before the second injection to determine the residual activity from the first injection in 7 of the mice.
microPET Image Analysis
Ellipsoidal 3-dimensional regions of interest (ROI) were manually drawn around the edge of the tumor xenograft activity by visual inspection using AMIDE software (11). Because the positions and orientations of the mice and tumors were somewhat different between scans, separate ROIs were drawn for each scan. The mean and maximum activities were recorded from the entire ROI. The percentage injected dose per gram (%ID/g) was calculated as follows: %ID/g = ROI activity divided by injected dose multiplied by 100%. The standardized uptake value (SUV) was calculated as follows: SUV = ROI activity multiplied by mouse weight divided by injected dose. The coefficient of variation (COV) was calculated as the SD of the %ID/g (or SUV) of the first scan and repeat second scan divided by their mean %ID/g (or SUV). COV has been used as a statistical measure of absolute reliability (12). In addition, the intraclass correlation coefficient was calculated between scans.
Delayed Scan Subtraction Method
For all mice, activity in the second 6-h scan was adjusted by subtracting the decay-corrected activity of the first scan. For 7 mice, an additional delayed scan was performed just before the second injection. The residual activity from this delayed scan was decayed and was then subtracted from the activity of the second scan. COVs of 2 subtraction methods were compared.
Mouse Blood Glucose Measurements
Mouse blood glucose levels were measured from lateral tail vein pricks around the time of the 18F-FDG injection of 16 mice using an Ascensia Elite XL glucose meter (Bayer) and Glucometer Elite test strips (Fisher Scientific). In the case of a successful initial 18F-FDG injection, a tail vein prick was performed on the opposite side of the tail for the glucose measurement. In the case of a failure of 18F-FDG injection in the first attempt, blood that flowed out was used for glucose measurements, and an 18F-FDG injection was later given on the opposite side of the tail. One glucose measurement required approximately 3 μL of blood. Depending on the volume of blood that flowed out by a tail vein prick, 1 or 2 glucose measurements were taken. In the case of 2 measurements, the average was used in the calculations.
Reproducibility of Glucose Strips
The reproducibility of glucose measurements was tested by 2 methods. In the first method, 51.1 mg of d-glucose anhydrous was dissolved in 50 mL of distilled water, leading to a concentration of 102.2 mg/dL. Ten readings were taken. In the second method, 75 μL of retroorbital blood were removed from a mouse, and 10 readings were taken. COVs were calculated for both methods.
Glucose Correction Method
Glucose correction was applied to the %ID/g by normalizing to a value of 100 mg/dL as follows: Glucose corrected %ID/g = %ID/g multiplied by the glucose concentration divided by 100. COVs were calculated for the glucose corrected %ID/g and compared with the noncorrected values.
Effect of Anesthesia on Blood Glucose Levels
Six female nude mice without xenografts were maintained under 3% isoflurane anesthesia in 2 L/min oxygen, and mouse blood glucose levels were measured via tail vein pricks at various time points up to 2 h. The blood glucose concentration was plotted against time.
Statistical Analysis
Statistical analysis was performed using Excel 2002 (Microsoft). Data were reported as mean ± SD. Paired t tests were used when comparing paired data from the same mouse. Correlation coefficients were calculated when assessing associations between datasets. A significance value of P < 0.05 was used.
RESULTS
18F-FDG microPET Studies of B16F10 Mouse Xenografts
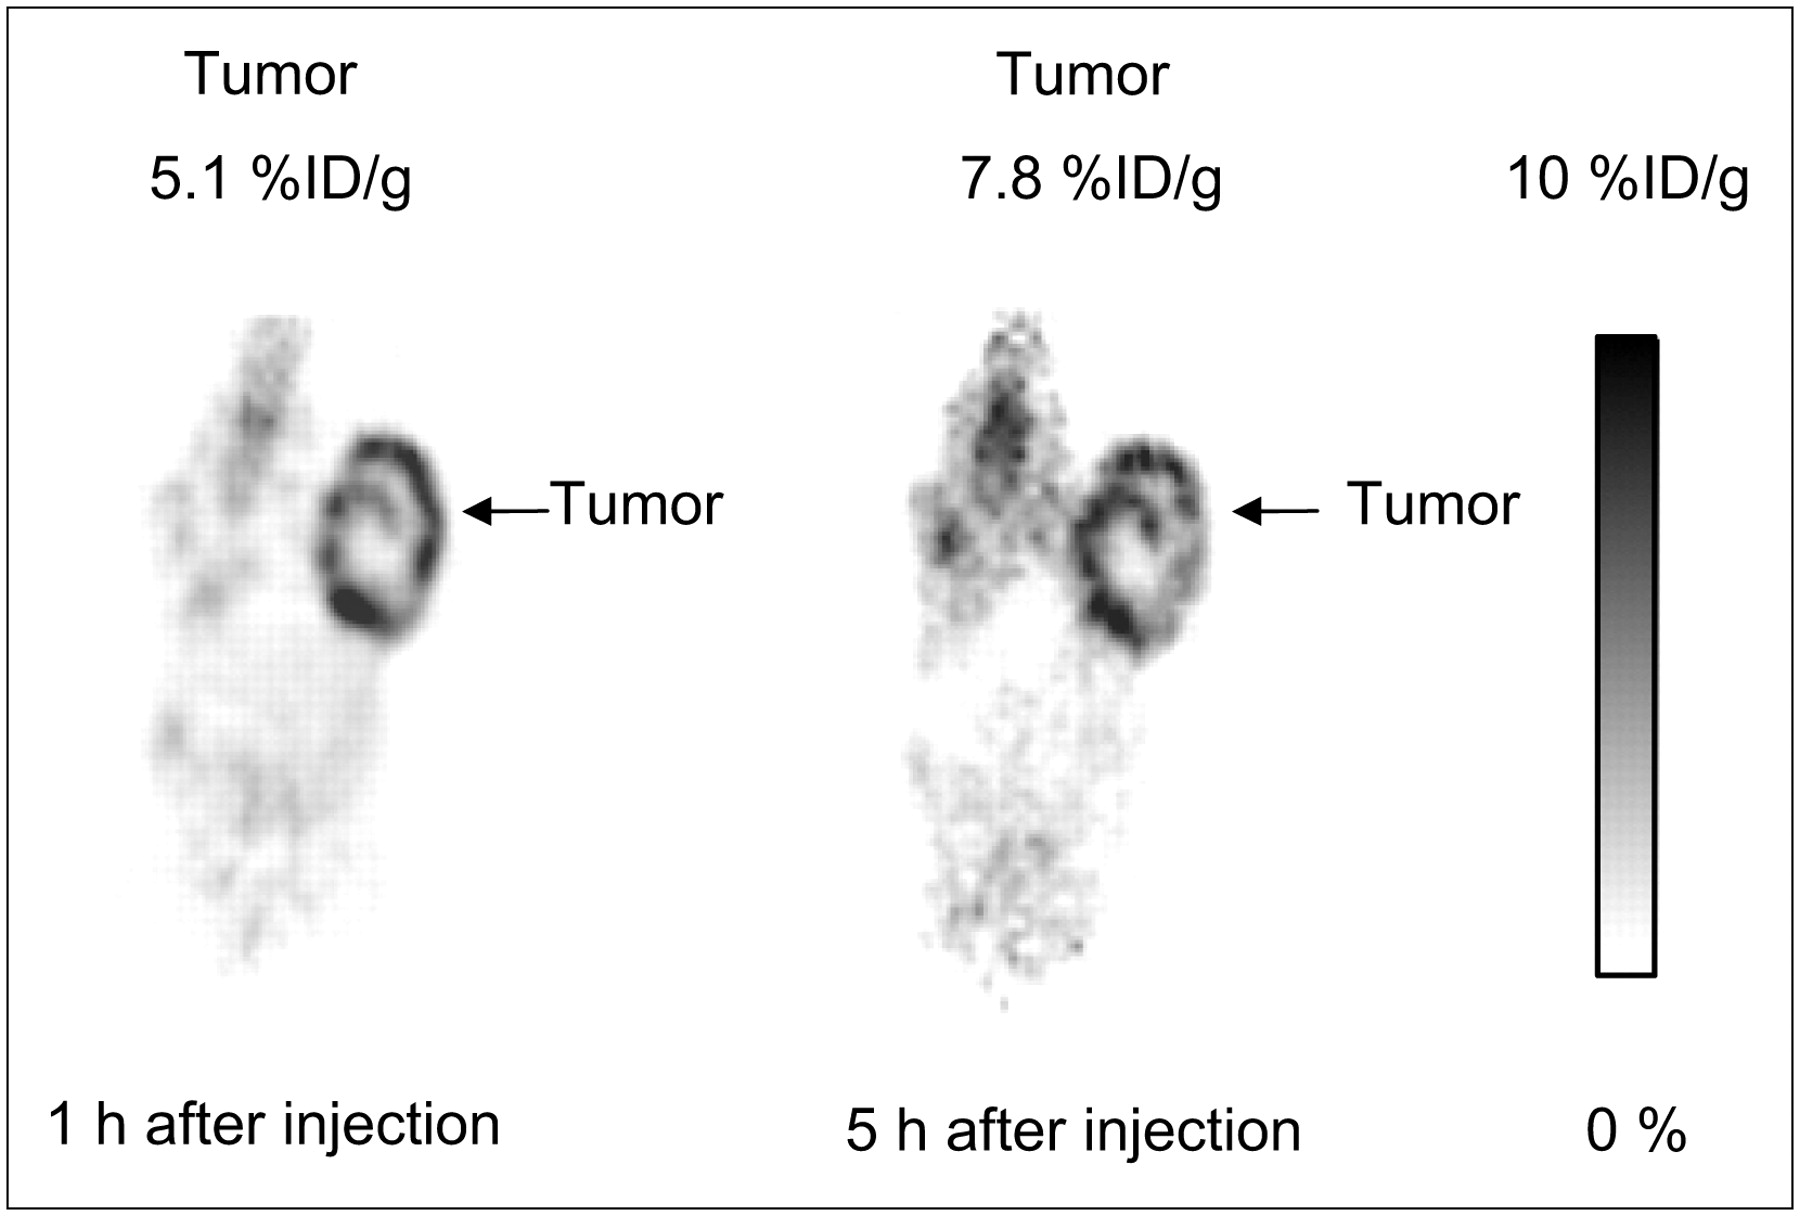
Tumor xenografts were clearly visible in the microPET images of all mice. The peripheries of the tumors were easily delineated for ROI placement on the images. The tumor volumes of the ROIs drawn around the tumor activity in the AMIDE software correlated well with the tumor volumes measured by calipers (R2 = 0.7; data not shown). Several tumors exhibited more intense activity at the periphery, suggesting higher metabolism compared with central areas of necrosis (Fig. 1).

Coronal section of B16F10 nude mouse xenograft scan 1 h (left) and 5 h (right) after single 18F-FDG injection using microPET to show change in tumor activity and tracer distribution over time. Both images are from a single mouse after a single injection of 18F-FDG. This is mouse 5 in Table 2. Mean %ID/g values are shown adjacent to tumor xenograft. Note central photopenia consistent with central necrosis.
Reproducibility of 18F-FDG microPET Studies of B16F10 Mouse Xenografts
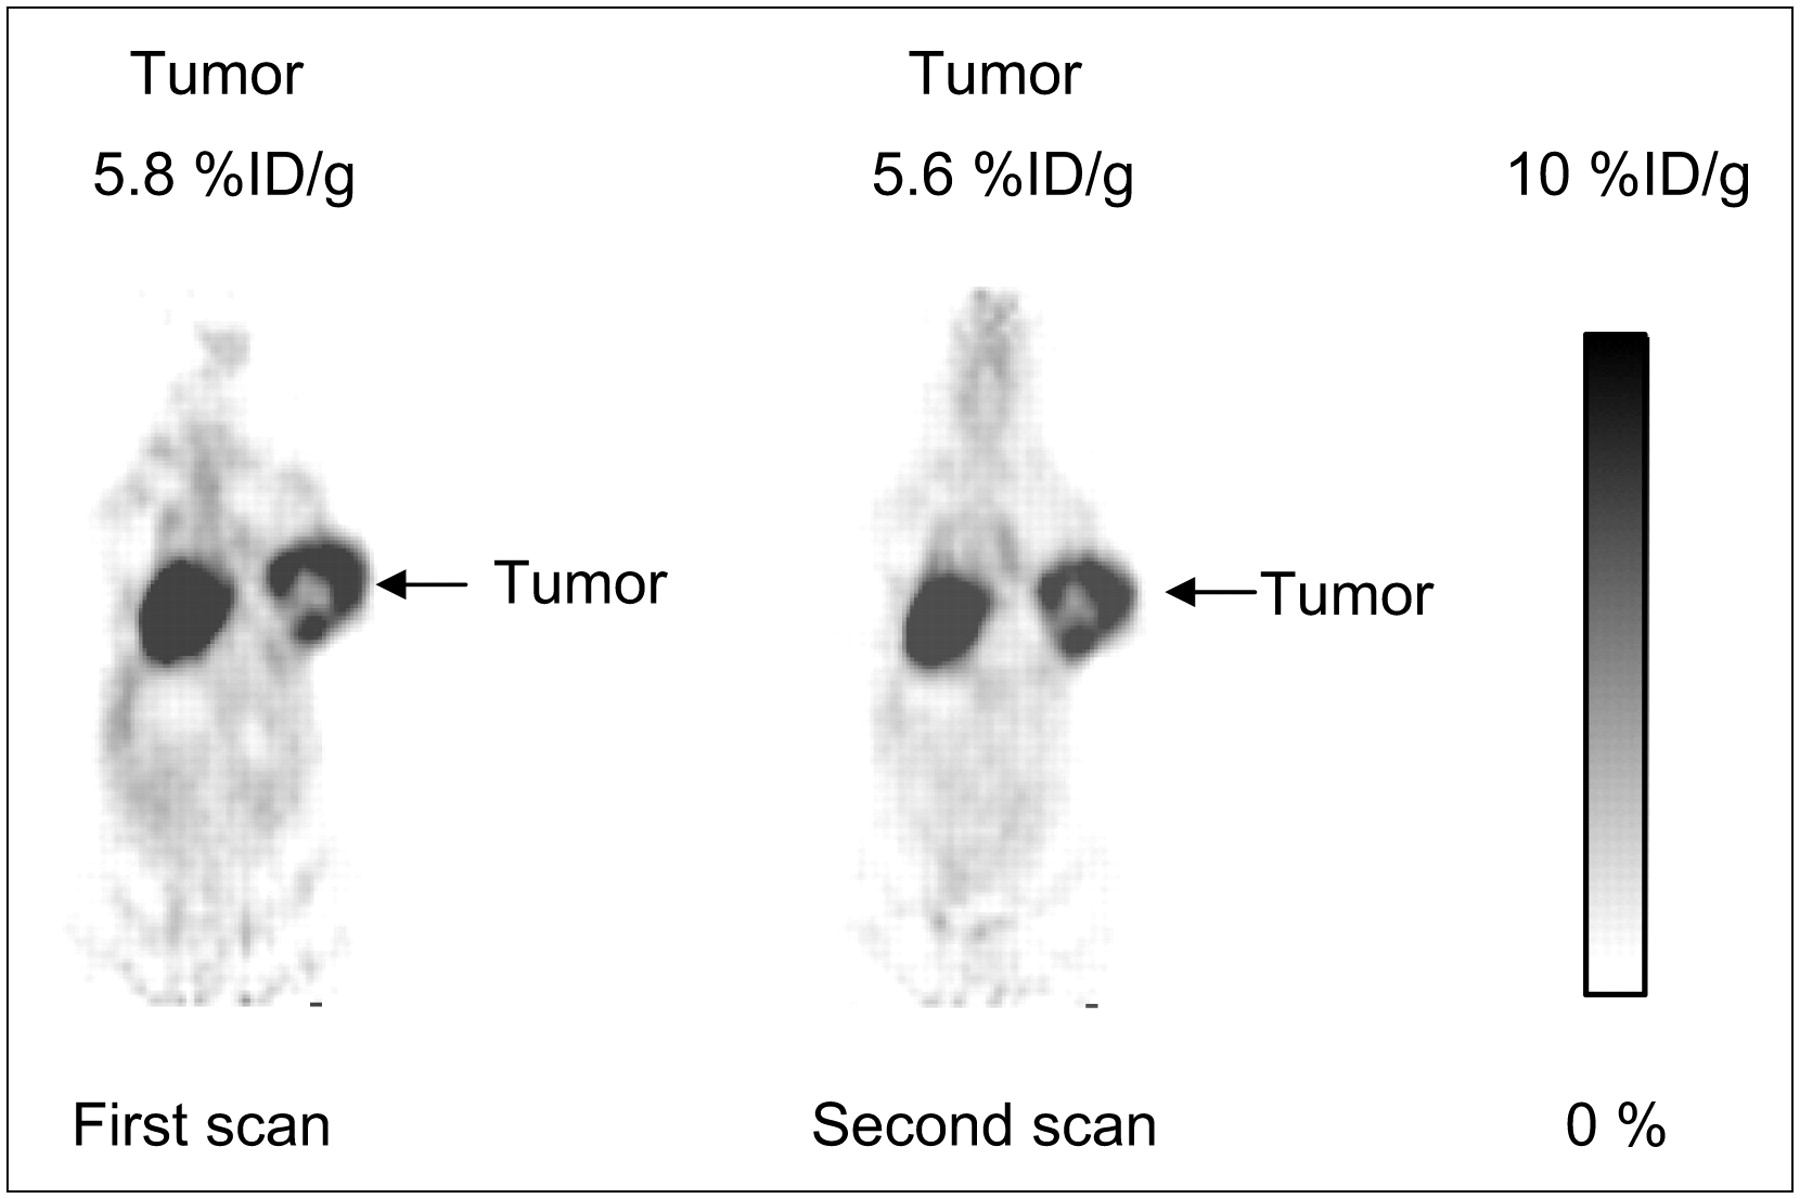
Twenty-five datasets were analyzed to assess the reproducibility of 18F-FDG (Fig. 2). The COV for the mean %ID/g between 18F-FDG microPET scans performed on the same day 6 h apart was 15.4% ± 12.6% (Table 1). The intraclass correlation coefficient between scans was 0.66. The mean %ID/g values of the first scans (5.6% ± 1.3%) and the second scans (5.8% ± 2.2%) were not significantly different (P = 0.44). No significant correlations were seen between the COV and the parameters of body weight (R2 = 0.02), injected dose (R2 = 0.02), temperature (R2 = 0.02), or tumor size (R2 = 0.004).

Coronal section of representative B16F10 nude mouse xenograft scan shows reproducibility of 18F-FDG microPET. This is mouse 3 in Table 1. Initial first scan is shown (left), which is followed by repeat second scan 6 h later (right) after repeat second injection of 18F-FDG. Mean %ID/g values are shown adjacent to tumor xenograft. Arrows point to tumor. Heart also shows high 18F-FDG accumulation in both images.
COV in B16F10 Tumor Xenografts in Nude Mice Using Mean %ID/g from Repeat 18F-FDG microPET Studies
The COV for the mean SUV was 15.1% ± 13.0%, similar to the mean %ID/g value. The COVs for the maximum %ID/g and maximum SUV were 18.0% ± 22.0% and 17.5% ± 22.4%, respectively, which were both higher than the mean values.
Effect of Delayed Scan Subtraction Method
The COV between the values of mean %ID/g of the 2 scans in 7 mice, using the delayed scan subtraction method, was 13.9% ± 10.8%, which was not significantly different from the COV obtained without the delayed scan, which was 13.9% ± 11.8% (P = 0.95). Three mice had a slight increase in COV, whereas 4 mice had a slight decrease when using the delayed scan subtraction method. The %ID/g values calculated with the 2 different subtraction methods are provided in Supplemental Table 1 (supplemental tables are available online only at http://jnm.snmjournals.org). 18F-FDG accumulation in the tumors changed over time. In the third dataset, the mean %ID/g of the first scan and the delayed scan (without repeat tracer injection) in 7 mice were compared (Fig. 1). One mouse showed a decrease in the 18F-FDG accumulation, whereas the other 6 showed increases (Table 2). Overall the %ID/g increased by 2.1 %ID/g, which was a statistically significant finding (P = 0.04) and was consistent with the fact that 18F-FDG accumulation generally increased over time in most of these tumors.
Comparison Between Tumor Mean %ID/g of Initial 1-Hour Scan and Delayed 5-Hour Scan to Reveal Change in %ID/g Over Time
Reproducibility of Glucose Strips
The reproducibility of the glucose strips was tested by 2 methods. In the first method, 10 readings were taken from a 102.2-mg/dL solution of glucose in water, and the COV of the strips was found to be 3.8%. In the second method, a retroorbital blood sample was tested, and the COV was 4.7%. In both methods, the COVs were similar to the COV from the package insert of the glucose strips, which was listed as 4.0%.
Glucose Correction Method
Mouse blood glucose levels were measured around the time of the 18F-FDG injections. The mean blood glucose level for the first injection was 91.3 ± 25.3 mg/dL (range, 53–134 mg/dL). The mean glucose level for the second injection 6 h later was 58.1 ± 20.1 mg/dL (range, 27–104 mg/dL). There was a significant difference in the glucose values between the first and second injections (P = 0.0005). No significant correlation was found between the glucose levels and the %ID/g (R2 = 0.05), and no correlation was found between the change in glucose levels compared with the change in %ID/g between the first and second scans (R2 = 0.007).
The glucose correction method was applied to data from 16 mice. We expected that applying the glucose correction to the %ID/g would decrease the COV. In contrast, the COV increased from 16.2% ± 14.4% to 37.2% ± 30.7% (P = 0.007) after application of glucose correction.
Effect of Anesthesia on Glucose Levels
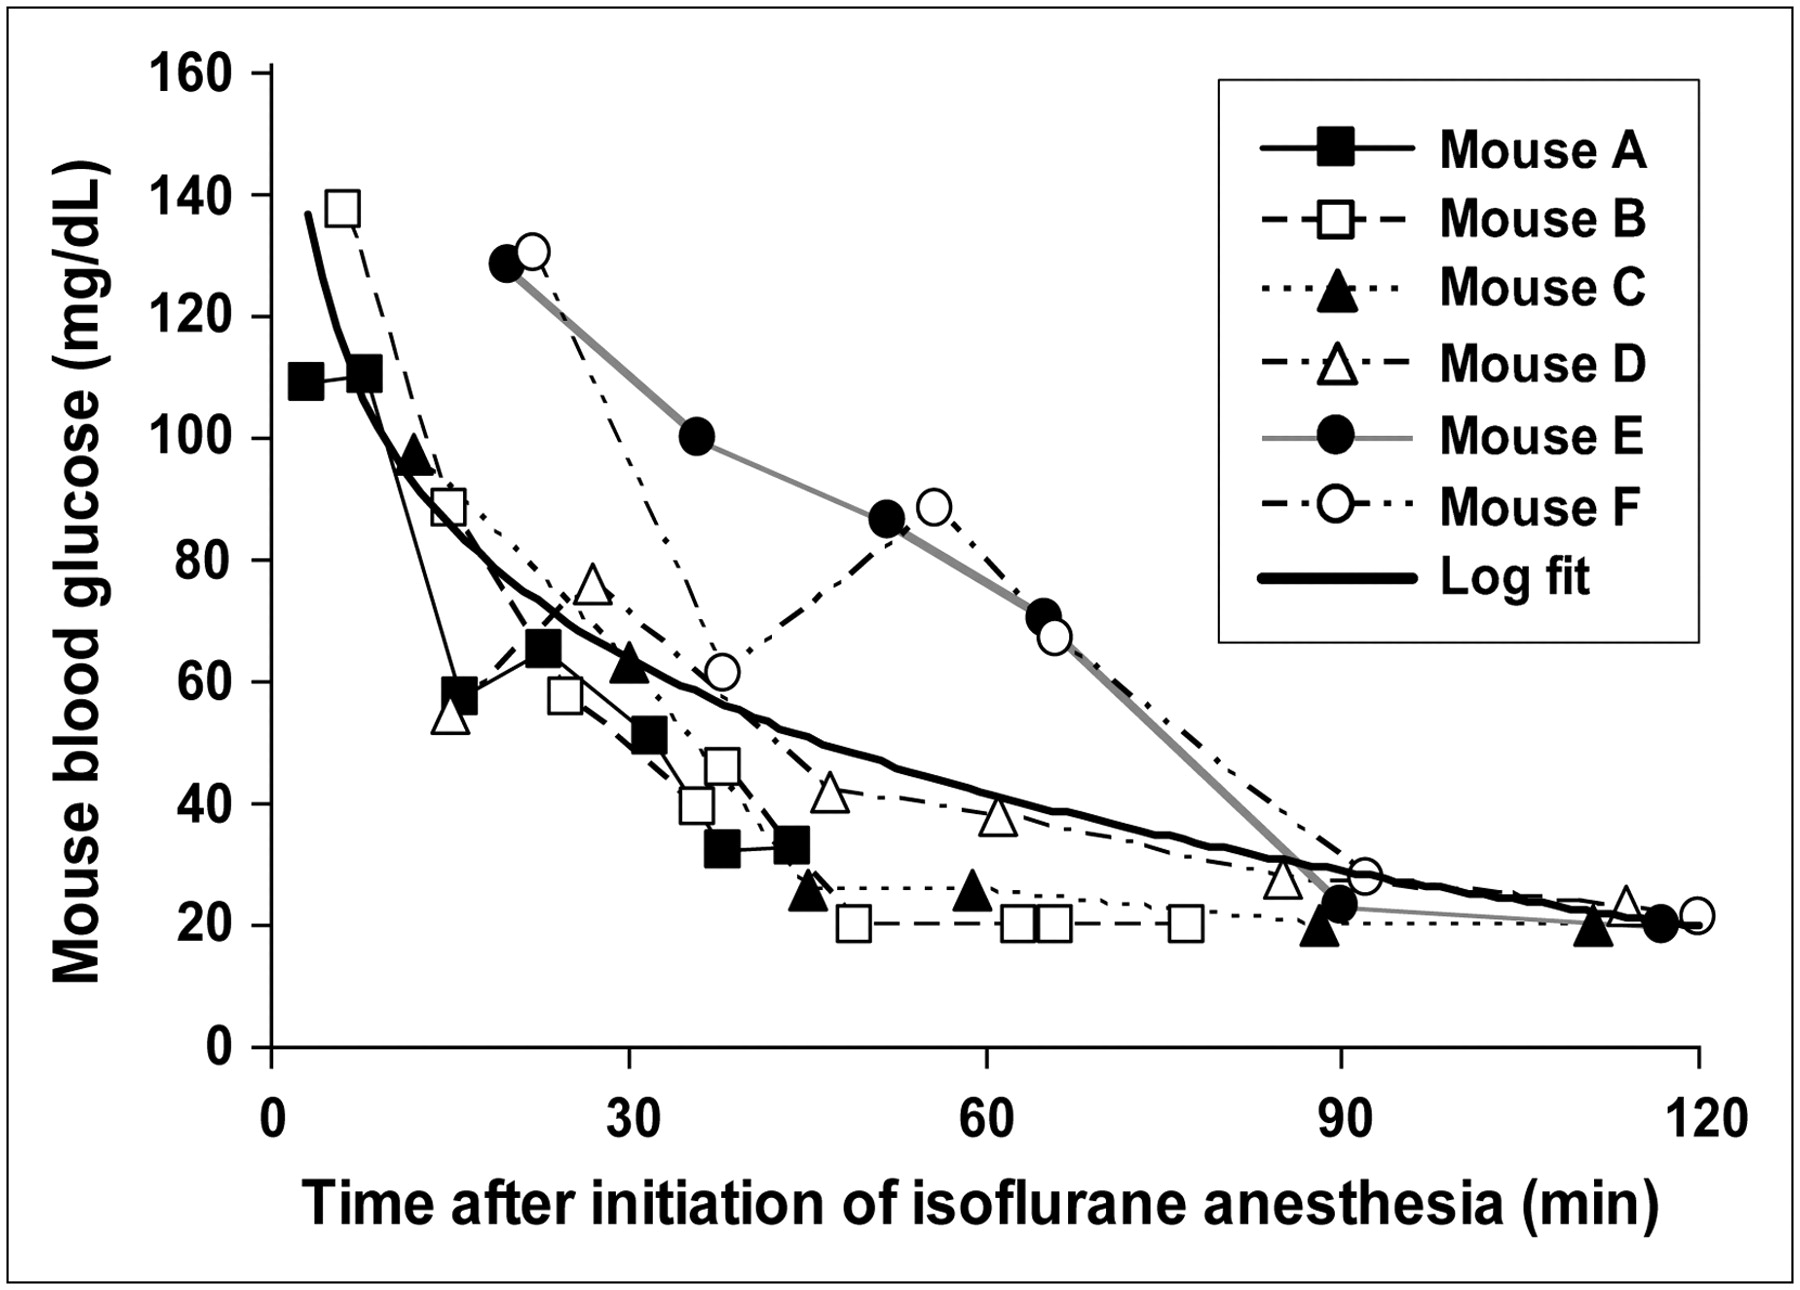
The effect of 3% isoflurane anesthesia over time on the mouse blood glucose levels was measured. The blood glucose concentration was plotted against time over 2 h (Fig. 3). Blood glucose values decreased over the first hour and remained very low over the second hour.

Effect of isoflurane anesthesia on mouse blood glucose levels. Mouse blood glucose levels are plotted as function of time for 6 mice sampled at various times points after initiation of 3% isoflurane anesthesia. Composite logarithmic (log) fit is also displayed (solid black curve).
DISCUSSION
We determined the reproducibility of 18F-FDG microPET scans for B16F10 tumor xenografts in nude mouse. The COV for the mean %ID/g was found to be 15.4% ± 12.6%. The 18F-FDG microPET studies were found to be reproducible with a moderately low variability. We recently reported a similar finding for 3′-deoxy-3′-18F-fluorothymidine (18F-FLT) microPET scans, in which the COV was 14% ± 10% (10). Taken together, the reported variabilities suggest that small changes (<15%) on serial scans used to assess therapy are not likely reliable to indicate changes due to therapy in a single mouse. Larger changes are required to indicate a significant effect in assessing therapy response. However, if a larger number of animals were used in a therapy trial, then smaller changes may indicate a significant change due to therapy.
The variability of our animal 18F-FDG microPET studies was somewhat higher than the reported variabilities for human 18F-FDG PET studies, which ranged from 6% to 10% (13,14). The difference in variabilities highlights some of the difficulties in working with small animals. Several factors have been investigated that contribute to the variability, including anesthesia, fasting state, and temperature (6,7,10), which can be more difficult to regulate in animals. Variations in ROI placement were investigated in our previous study and found to be small when the analysis was performed by a single person (10).
One factor that required more investigation was the effect of blood glucose levels on the variability of scans. Wahl et al. reported that rat xenografts under extreme hyperglycemic conditions (>500 mg/dL) had significantly decreased 18F-FDG tumor accumulation, suggesting competition between glucose and 18F-FDG; however, only small changes were seen in some normal tissues, such as liver, heart, muscle, and fat (5). Nakamoto et al. found that applying a glucose correction to human 18F-FDG PET scans by normalizing to a glucose value of 100 mg/dL reduced the variability from 10.1% to 6.7% (13). When we applied a similar glucose correction to our studies, we found the opposite effect—namely, the COV increased from 16.2% to 37.2%. Our measured glucose value varied widely from as low as 27 mg/dL to as high as 134 mg/dL. This large range resulted in large correction factors being applied to the COV for the glucose corrected values compared with the noncorrected values. We also found that the blood glucose values were lower after the second injection; however, the %ID/g values were not significantly different between the 2 scans. This suggests that competition between glucose and 18F-FDG may not be the only factor affecting the %ID/g value in our studies.
Several factors may contribute to the variability in glucose values. Isoflurane anesthesia was found to alter the mouse glucose concentrations over time. By measuring glucose values in 6 mice over a period of 2 h, the glucose values dropped considerably from a normal range around 100 mg/dL to values around 20 mg/dL (Fig. 3). This is in contrast to Fueger et al., who revealed a modest increase in blood glucose with isoflurane anesthesia from 73 to 104 mg/dL (7). Possible explanations for the difference may include differences in mouse type, tumor type, or mouse handling. They also reported that isoflurane anesthesia slightly decreased tumor SUV from 1.8 ± 0.6 to 1.60 ± 0.47, but the SUVs do not appear to be significantly different when inspecting the SD value. We have preliminary data showing mildly decreased tumor accumulation with isoflurane anesthesia, suggesting that anesthesia may influence 18F-FDG accumulation, perhaps due to decreased metabolism during anesthesia. Studies of Lee et al. have shown that injectable anesthetics, such as xylazine, ketamine, or pentobarbital, can have large effects on blood glucose levels and 18F-FDG accumulation in tumors (6).
An additional factor that is difficult to control is the effect of stress on glucose levels. Several reports, summarized by Balcombe et al. (15), indicate that differences in the handling of animals (e.g., movement of cages, cage changing, physical contact with animals, and blood collection) can lead to wide variations in glucose levels. In addition, there are inherent difficulties in measuring glucose levels around the time of injection due to difficulties associated with tail vein injection. This may also contribute to the variability in glucose values.
Maintaining and measuring a consistent glucose level can be a difficult task in a mouse. Further studies into the factors affecting glucose levels are necessary to better understand the complex relationship among such factors as anesthesia, glucose levels, and 18F-FDG accumulation. Use of intravenous catheters would be helpful to attain more consistent blood glucose measurements, and rigorous methodology controls are needed to minimize the variations in blood glucose and to account for the multiple factors that can affect 18F-FDG accumulation. In addition, use of slower growing tumors and a separate-day protocol may be investigated to reduce the frequency of anesthesia exposure. Measurement of 18F-FDG blood activity and tissue biodistribution may also help clarify some of these issues. Overall, we have developed a protocol to expose animals to the same length and type of anesthesia and to minimize stress to the animals with gentle handling to minimize variations between animals. In our hands, we have shown that despite wide ranges in measured glucose values, moderately low variability can be achieved by adherence to a strict protocol.
Limitations
The accuracy of the %ID/g of the second scan performed 6 h after the first scan relies on the accuracy with which this residual activity from the first scan is subtracted from the second scan (10). For a subset of 7 mice, we performed a delayed scan after the first injection and used that to subtract the residual activity hoping to achieve an improvement in the COV. Although the mean %ID/g increased in the delayed scan for most mice, the COV was 13.9% ± 10.8%, which was not significantly different from the COV obtained without the delayed scan, which was 13.9% ± 11.8%. In our previous study with 18F-FLT microPET in 4 mice, the COV improved from 9.2% ± 6.7% to 4.9% ± 5.4% with the delayed scan method (7). Possible explanations may include difference in the tracer kinetics, tumor types, or the smaller sample size. Overall, the residual activity from the first scan is small after 3–4 half lives, such that the contribution to the variability should be very modest.
The COV was calculated using only 2 data points. Additional data points would be helpful to better delineate the COV; however, tumors continue to grow such that additional scanning would likely be confounded by changes in the tumor metabolism unless slower-growing tumors can be used. Our choice of a single-day protocol using a 6-h delay between scans was a compromise between the changing tumor volume versus the use of anesthesia and fasting twice in the same day. We did see a difference between the glucose values between the 2 scans that may be related to the fasting conditions or anesthesia; however, a simple relationship between the glucose values and the FDG accumulation could not be determined even with a glucose correction factor. Fasting conditions and anesthesia exposures likely affect the FDG accumulation; however, the exact relationship cannot be completely explained from our data. The use of a slower- growing tumor and a separate-day protocol may be helpful to reduce the overall variability and to further investigate the influence of different fasting conditions and anesthesia exposures on FDG accumulation. A separate-day protocol may more closely mimic serial therapeutic response studies performed on separate days.
Future studies will also benefit from exploring other tumor lines as well as other xenograft locations on the mouse to determine if the results reported here generalize further. Studies that determine the blood time–activity curve for 18F-FDG may also lead to lower variation as compared with the current approach of quantifying only with the %ID/g or SUV.
CONCLUSION
18F-FDG microPET mouse xenograft studies are reproducible with moderately low variability. Blood glucose corrections did not lead to an improvement in the variability; however, close monitoring of glucose levels and anesthesia exposure would be helpful for FDG microPET studies to further evaluate the influence of these variables on FDG accumulation. Overall, the level of variability seen in this study is sufficiently small for reasonable assessments of serial changes. These results may be applied to follow tumor therapy response, including preclinical drug evaluation.
Acknowledgments
Many thanks are extended to the members of the Gambhir laboratory, including Dr. Shay Keren for assistance with microPET imaging, Dr. Pritha Ray for assistance with cell culture techniques, and Dr. Andreas Loening for assistance with image processing. Financial support was provided in part by National Institutes of Health grant ICMIC P50 CA114747 (SSG) and in part through the National Cancer Institute Small Animal Imaging Resource Program grant R24CA92862.
Footnotes
-
↵* Contributed equally to this work.
References
- Received for publication September 27, 2006.
- Accepted for publication December 27, 2006.


Jump to section
Related Articles
Cited By...
- Plcg2M28L interacts with high fat-high sugar diet to accelerate Alzheimers disease-relevant phenotypes in mice
- The 677C>T variant in methylenetetrahydrofolate reductase causes morphological and functional cerebrovascular deficits in mice
- Cabozantinib Exhibits Potent Antitumor Activity in Colorectal Cancer Patient-Derived Tumor Xenograft Models via Autophagy and Signaling Mechanisms
- Assessment of Tryptophan Uptake and Kinetics Using 1-(2-18F-Fluoroethyl)-L-Tryptophan and {alpha}-11C-Methyl-L-Tryptophan PET Imaging in Mice Implanted with Patient-Derived Brain Tumor Xenografts
- [18F]CFA as a clinically translatable probe for PET imaging of deoxycytidine kinase activity
- The Reverse Warburg Effect and 18F-FDG Uptake in Non-Small Cell Lung Cancer A549 in Mice: A Pilot Study
- 18F-FDG-PET/CT Imaging of Drug-Induced Metabolic Changes in Genetically Engineered Mouse Lung Cancer Models
- 18F-FAZA PET Imaging Response Tracks the Reoxygenation of Tumors in Mice upon Treatment with the Mitochondrial Complex I Inhibitor BAY 87-2243
- 18F-Alfatide II and 18F-FDG Dual-Tracer Dynamic PET for Parametric, Early Prediction of Tumor Response to Therapy
- Optical Metabolic Imaging Identifies Glycolytic Levels, Subtypes, and Early-Treatment Response in Breast Cancer
- Discovery and validation of small-molecule heat-shock protein 90 inhibitors through multimodality molecular imaging in living subjects
- PET of HER2-Positive Pulmonary Metastases with 18F-ZHER2:342 Affibody in a Murine Model of Breast Cancer: Comparison with 18F-FDG
- 18FDG-PET Predicts Pharmacodynamic Response to OSI-906, a Dual IGF-1R/IR Inhibitor, in Preclinical Mouse Models of Lung Cancer
- 18F-FDG Small-Animal PET/CT Differentiates Trastuzumab-Responsive from Unresponsive Human Breast Cancer Xenografts in Athymic Mice
- Imaging Biomarkers Predict Response to Anti-HER2 (ErbB2) Therapy in Preclinical Models of Breast Cancer
- Impact of Contamination from Scattered Photons in Singles-Mode Transmission Data on Quantitative Small-Animal PET Imaging
- Preclinical Efficacy of the c-Met Inhibitor CE-355621 in a U87 MG Mouse Xenograft Model Evaluated by 18F-FDG Small-Animal PET