


Abstract
Targeted therapies often depend on the expression of the target present in the tumor. This expression can be difficult to ascertain in widespread metastases. 18F-FDG PET/CT, although sensitive, is nonspecific for particular tumor markers. Here, we compare the use of a human epidermal growth factor receptor 2 (HER2)–specific 18F-ZHER2:342-Affibody and 18F-FDG in HER2-expressing pulmonary metastases in a murine model of breast cancer. Methods: The lung metastasis model was established by intravenous injection of MDA-MB-231HER2-Luc human breast cancer cells into the tail vein. Bioluminescence imaging was used to evaluate metastasis progression. Uptake of 18F-ZHER2:342-Affibody and 18F-FDG was confirmed by coregistration of the PET images with MR and CT images. At the end of the study, the presence of neoplastic cells and HER2 expression in lung tissues, and distribution of the tracer, were assessed ex vivo by immunohistochemistry and autoradiography. Results: 18F-ZHER2:342-Affibody successfully targeted HER2-positive lesions in the lung and allowed detection of metastases as early as 9 wk after injection of cells. In contrast, 18F-FDG uptake was often masked by surrounding inflammatory changes and was nonspecific for HER2 expression. HER2 expression at a cellular level correlated well with tracer uptake on autoradiography. Conclusion: 18F-ZHER2:342-Affibody is a promising tracer for evaluation of HER2 status of breast cancer metastases and is more specific for detecting HER2-positive lesions than 18F-FDG.
One of the most promising developments in breast cancer (BC) treatment has been the introduction of agents targeting HER2, a transmembrane receptor belonging to the epidermal growth factor receptor family (1). Amplification or overexpression of HER2 has been detected in approximately 20% of invasive BCs and is associated with increased tumor aggressiveness, resistance to therapies, and increased mortality (2). The introduction of trastuzumab, the humanized monoclonal antibody directed against the extracellular domain of HER2, resulted in an increasing time to recurrence and overall improvement in survival in patients whose tumors overexpressed HER2 (3). However, despite the presence of HER2 overexpression, 44%–64% of patients with metastatic BC show upfront resistance to trastuzumab as a single-agent therapy, whereas only 12%–22% of patients are primarily resistant to trastuzumab when it is given in combination with cytotoxic chemotherapy (4). One issue is the heterogeneity of HER2 expression among metastases. Currently, HER2 status is routinely determined by immunohistochemistry and fluorescence in situ hybridization at the time of diagnosis of the primary tumor. However, in the last few years, a relatively high discordance rate (6%–48%) in HER2 expression between primary tumors and metachronous metastases has been reported, indicating a strong need for reassessment of the marker status as the disease progresses (4). Studies by Pectasides et al. showed that after a few months of trastuzumab therapy, almost 37% of tumors no longer expressed HER2 (5). On the other hand, Zidan et al. demonstrated that patients with a HER2-negative primary tumor could have HER2-positive metastases (1). This finding supports the notion that periodic reassessment of HER2 status could lead to more rational use of trastuzumab.
Anatomic tumor imaging modalities, including radiography, CT, and MRI, are routinely used in the management of metastases. These techniques provide a means to detect and measure the size of pulmonary nodules, allowing assessment of the tumor burden, but they lack the specificity to distinguish benign lesions from cancerous tumors, and HER2-expressing tumors from those without such expression. PET with 18F-FDG has become widely available, visualizing the increased glucose metabolism of cancer tissue. The combined evaluation of morphologic and functional alterations of tumors using 18F-FDG PET/CT is currently considered the most effective means for the evaluation of metastatic disease. However, whereas 18F-FDG plays a pivotal role in detecting and monitoring primary and metastatic BC, it is limited with respect to its ability to selectively identify HER2-positive tumors (6). Moreover, false-positive findings related to inflammation occur frequently.
Affibody molecules (Affibody AB) are a new class of relatively small (∼6.5 kDa), genetically engineered proteins based on a 58–amino acid Z-domain scaffold, derived from the B domain of Staphylococcus aureus protein A. Specific Affibody molecules can be selected by phage-display technology (7). Their small size, high binding affinity, rapid blood clearance, and good tumor penetration make them ideal candidates for in vivo radionuclide imaging. Unlike radiolabeled antibodies, which may take days to clear, these small molecules clear from the background tissues rapidly, leading to clinically relevant scanning windows of 1–4 h after injection. The inclusion of the C-terminal cysteine residue provides a unique thiol group for well-defined conjugation chemistry using maleimide linkers to facilitate labeling (8).
Several studies have demonstrated that the 18F-ZHER2:342-Affibody binds with high affinity to a HER2 epitope that is distinct from the binding site of trastuzumab. And several studies in xenografts demonstrate that it can be successfully used for imaging of HER2 (9–11).
Herein, we validate the use of 18F-ZHER2:342-Affibody to detect and assess HER2 status in small nodules in the lungs and compare it with 18F-FDG uptake. Such an approach could provide global information on the HER2 receptor status of all metastatic sites, which could facilitate the treatment and management of individual BC patients in the future.
MATERIALS AND METHODS
Unless otherwise specified, all reagents were of analytic grade and were obtained from commercial sources. The ZHER2:342-Affibody molecules were kindly provided by Affibody AB. Labeling of ZHER2:342-Affibody molecule with 18F was performed as previously described (8).
Tumor Cell Line
The human BC cell line MDA-MB-231 was transfected with pCMV4. HER2 full-length human complementary DNA, which was kindly provided by Dr. Patricia Steeg. Cells were cultured at 37°C in a humidified atmosphere containing 5% CO2, in Dulbecco modified Eagle medium supplemented with 10% fetal bovine serum, and Zeocin (Invitrogen) (200 μg/mL) to maintain HER2 expression. Cells were subsequently cotransfected with pRR460 plasmid (kindly provided by Dr. Alan Rein) expressing the firefly luciferase (fLuc) gene under the long terminal repeat (LTR) promoter and puromycin resistance gene under the SV40 promotor, using the FuGENE HD transfection reagent (Roche Diagnostic). Transfected cells were selected for antibiotic resistance, and surviving colonies were screened for bioluminescence in complete medium supplemented with d-luciferin using an IVIS100 camera imaging system (Caliper). Bioluminescent, antibiotic-resistant, single-cell clones were amplified in culture and characterized for stable luminescence in vitro and tumorogenic potential in vivo. The clone with the highest luciferin activity (C4) was selected for further in vivo studies. For convenience, the cell line is referred to as MDA-MB-231HER2-Luc.
Tumor Model
Animal care and euthanasia were performed in accordance with the principles and procedures outlined in the Guide for the Care and Use of Laboratory Animals (12) and were approved by the Institutional Animal Care and Use Committee. The BC experimental lung metastasis model was established by intravenous injection of 5.0 × 10⁵ cells suspended in 100 μL of phosphate-buffered saline into the tail vein of 6-wk-old female athymic nude mice.
In Vitro Bioluminescence Imaging (BLI) of Living Cells
To document that luminescence was proportional to cell number, we serially diluted MDA-MB-231HER2-Luc cells and plated them in triplicate in black 96-well plates in 150 μL of culture medium. Medium containing d-luciferin potassium salt (Xenogen) was added to a final concentration of 150 μg/mL in each well, 5 min before imaging. Cells were then imaged for 5 min, using the IVIS100 system (Caliper).
In Vivo BLI
Mice were monitored for potential lung tumor colonization and metastases by BLI once per week for up to 10 wk. The imaging was performed using the IVIS100 system (Caliper). d-luciferin and phosphate-buffered saline (150 mg/kg) were administered by intraperitoneal injection, and imaging was performed 10 min later. A white light reflectance and bioluminescence images were acquired with a 3- to 5-min integration time (Living Image Software 4.0; Caliper). For analysis, the BLI signal intensity was quantified as the total photon flux (photon per second) within the fixed region of interest (ROI) over the thoracic cavity from the dorsal and ventral views. After that, the highest luminescence signal intensity was plotted against time after cell injection.
PET/CT/MRI
The mice were anesthetized using isoflurane/O2 (1%–2% v/v in O2), given an injection of 18F-FDG via the tail vein (7.4 MBq, 100 μL), and scanned. Two days later, they received 18F-ZHER2:342-Affibody (6.6–7.4 MBq, 3.5–4.0 μg, 100 μL) and were reimaged. Before imaging with 18F-FDG, mice were kept fasting for 4 h and allowed to acclimate to the PET facility environment for at least 1 h. For tracer administration, mice were sedated for approximately 10 min and kept awake with minimal activity on warm heating pads to maintain body heat during the uptake period. Subsequently, after a 60-min distribution period, animals were scanned according to previously published protocols (13,14).
The imaging time point for 18F-ZHER2:342-Affibody was chosen on the basis of our previous studies, in which uptake was maximized at 1 h after injection and then maintained at a plateau until 2 h (10). PET scans were obtained using the Advanced Technology Laboratory Animal Scanner (ATLAS) of the National Institutes of Health (15). The ATLAS detector modules possess 2 layers of scintillator crystals, with different scintillation time constants, 40 ns (lutetium oxyorthosilicate) and 60 ns (gadolinium silicate), that enable a 2-level depth-of-interaction discrimination. The central point source resolution is 1.8 mm, with filtered backprojection and a ramp filter with cut-off at the Nyquist frequency. The scanner has a transverse field of view (FOV) of 6.8 cm and an axial FOV of 2 cm.
Animals were placed prone in the center of scanner FOV, and 5- to 10-min emission scans (2 bed positions) were acquired with a 100- to 700-keV energy window. The images were reconstructed by a 2-dimensional ordered-subsets expectation maximization algorithm, without correction applied for attenuation or scatter. For each metastatic lesion, ROIs were manually drawn over the lesions and normal tissue. The maximum counts per pixel within the tumor or normal tissues were obtained from multiple ROIs (counts/s/cm3). The results were calculated as percentage injected dose per gram (%ID/g), using a calibration constant obtained from scanning the 18F source, assuming a tissue density of 1 g/mL, and dividing by the injected dose, decay-corrected to the time of scanning.
CT images without gating were obtained with a NanoSPECT/CT scanner (Bioscan, Inc.), whose CT subsystem was configured to acquire image data, with the x-ray tube high voltage set to 55 keV, a sampling time of 1,100 ms, and a pixel size of 78 μm. The CT images were reconstructed using a filtered backprojection algorithm with a Shepp-Logan filter and a frequency cutoff at 100% of the Nyquist frequency.
MR images were acquired on a Philips Achieva 3.0-T clinical MRI scanner, with a custom-built 44-mm-diameter × 70-mm-long small-animal receiver coil. After a triplanar survey scan, a fast-field echo sequence was acquired (repetition time, 15.3 ms; echo time, 2.4 ms; flip angle, 20°; FOV, 36 × 24 mm; resolution, 0.19 × 0.25 mm; slice thickness, 0.562 mm; number of slices, 32; and scan time, 7.65 min). Then, a respiration-triggered multislice T2-weighted turbo spin echo sequence was acquired to aid in identification of tissue boundaries (repetition time, ∼4,400 ms for 4 breathing cycles; echo time, 65 ms; flip angle, 90°; echo train length, 11; FOV, 36 × 24 mm; resolution, 0.19 × 0.19 mm; slice thickness, 0.562 mm; number of slices, 32; and scan time, ∼14 min). During the scan, animals were maintained under anesthesia with isoflurane (1%–2% v/v in O2), and animal temperature was maintained at 37°C. When scanning was complete, the animals were allowed to recover from anesthesia or sacrificed by cervical dislocation for histopathologic evaluation.
Image Fusion
Because PET, CT, and subsequently MR images were not acquired at the same time point and with the same scanner, coregistration of images was necessary. The spatially registered images were obtained using a custom-designed adapter to the ATLAS bed, allowing the imaging bed (and the animals) to be reproducibly transferred between machines. To provide accurate registration of the images, we used the commercial software PMOD (PMOD Technologies). Each mouse's PET image was automatically coregistered with the corresponding MR image and was then finely adjusted by experienced nuclear medicine physicians and radiologists. The MR image was loaded as a reference, and the slice thickness of the coregistered images was the thickness of the MR image, for which we used a trilinear interpolation method. For the coregistration, rigid transformations were defined by 6 parameters (i.e., 3 rotation angles and 3 translation distances in the 3 spatial directions). Similarly, we automatically coregistered each mouse's PET image to its corresponding CT image and refined the registration manually, if necessary. Validation of the registrations was assessed by visual inspection by 3 independent experts.
Simultaneous Segmentation of PET and MR Images
We determined the tumor area from MR images in a semiautomated way. We used a graph-cut method (16) to segment the ROI globally. In the graph-cut method, user-defined seeds are created for foreground and background objects. The optimal paths between object and foreground objects were found using dynamic programming methods. During dynamic programming, high-intensity value differences between pixels were penalized by a cost function, and smoothness of the boundary of segmented regions was encouraged. Tumor areas were calculated from the total number of segmented pixels multiplied by their spatial resolution units.
High-Resolution Autoradiography Study
Mice were sacrificed after the final scan, and the lungs were inflated with 20% sucrose, removed, immediately embedded in optimal-cutting-temperature compound (Tissue-Tek), and frozen on dry ice. Afterward, the frozen tissue was cut coronally into 20-μm slices using a cytomicrotome (Bright Instrument and Hacker Instrument, Inc.). The sections were placed on slides, air-dried, and placed on a phosphor-imaging plate with a pixel size of 25 μm (Fuji BAS-SR2025). After overnight exposure, the plates were scanned using a high-resolution imaging system (Fuji Bio-imaging Analysis System 5000; Fuji Photographic Co.).
Histopathology
Whole-lung specimens of each mouse were inflated with 20% sucrose, embedded in optimal-cutting-temperature compound, frozen on dry ice or inflated with 10% neutral-buffered formalin solution, and fixed in the same buffer for 24 h. Frozen or paraffin-embedded tissues were sectioned and stained by hematoxylin and eosin (H&E) and HercepTest (Dako) for HER2 evaluation. The tissue samples were scored by a pathologist using ImageScope 11.0.2.725 (Aperio Technologies, Inc.). Representative slides from each animal were scanned, and areas of tumor were determined.
RESULTS
BLI of Metastasis Progression
To confirm the correlation between the level of reporter gene activity and the number of cells, and to determine the detection limit, serially diluted MDA-MB-231HER2-Luc cells were assayed for fLuc enzyme activity. We found a robust linear correlation between the cell numbers and fLuc activity (Fig. 1A).

BLI monitoring of metastasis growth. (A) Strong linear correlation (R2 = 0.99) was found between absolute MDA-MB-231HER2-Luc cell number and BLI signal. (B) Total photon flux from BLI signals acquired 9 wk after intravenous injection of MDA-MB-231HER2-Luc cells. Highest ROI signal from either ventral or dorsal position is presented for each individual mouse. Animals indicated by oval shapes were chosen for further imaging studies. (C) Metastasis progression between 9 and 10 wk after cell injection. (D) Representative in vivo images of lungs of mouse number two 10 wk after cell injection.
Metastasis progression after intravenous injection of HER2-overexpressing MDA-MB-231HER2-Luc cells (Supplemental Table 2; supplemental materials are available online only at http://jnm.snmjournals.org) was monitored with BLI weekly.
Low (1.9 × 10⁴ to 6.5 × 10⁴ [p/s]) BLI signals were found in the lungs 2 wk after cell inoculation. By 9 wk, widespread metastases were observed; however, there was considerable variability in the tumor growth rate among animals (Fig. 1B). The BLI signal reached high values (3.5 × 10⁶ to 5.0 × 10⁷ [p/s]) in 8 of 26 mice, and 4 mice did not develop detectable tumors. For further imaging studies, we selected the 8 mice with bioluminescence signals ranging from a low of 1 × 10⁵ [p/s] (animal 14) to a high of 5.0 × 10⁷ [p/s] (animal 20). Details of the imaging protocol are presented in Supplemental Table 1. We observed a rapid progression of disease, resulting in a dramatic increase in BLI signals (ratio at week 10 to week 9 ≥ 2) in 5 of 8 selected animals, during the 9- to 10-wk period (Fig. 1C). By contrast, the lesions barely changed in the remaining mice during that time. Representative in vivo bioluminescence images of the tumors in the lung at 9 and 10 wk after injection are shown in Figure 1D.
Animals 8 and 20 died before they reached the tenth week and could not be rescanned. Therefore, we replaced them with animals 10 and 27.
PET/MRI/CT
18F-ZHER2:342-Affibody sufficiently targeted HER2-positive metastatic foci within the lungs approximately 9 wk after inoculation of cells, providing a high tumor-to-background ratio in the animals above the arbitrary luminescence signal threshold (1 × 10⁶ [p/s]). The lung of a normal mouse (i.e., no tumor present) had no abnormal tracer uptake (Supplemental Fig. 2). PET images of metastatic lesions (Fig. 2) were acquired 1 h after tracer injection in all the animals. The smallest metastatic deposits detected with 18F-ZHER2-Affibody corresponded to lesions approximately 1.0 mm in diameter on MR images (arrowheads in Fig. 2).

Contiguous axial PET/MRI sections of mouse 2 collected 9 and 10 wk after cells injection showing rapid metastasis progression. HER2-positive lung metastases were visualized with high tumor-to-background ratio 1 h after 18F-ZHER2:342-Affibody injection. Tracer uptake 10 wk after cell inoculation, indicated by white arrows, was as follows: 6.2 %ID/g (lesion 1), 6.9 %ID/g (lesion 2), and 3.4 %ID/g (lesion 3). TBR = tumor-to-background ratio.
One week later, more metastatic foci were detected in all the animals, which also correlated with a noticeable rise in the BLI signal and directly with anatomic growth observed on CT and MR images. At this time, the mean uptake (%ID/g) of 18F-ZHER2:342-Affibody ranged from 3.1 ± 0.65 to 7.4 ± 0.72 %ID/g. The tumor-to-background ratio ranged from 3.4 ± 0.9 to 8.6 ± 0.9 (Supplemental Table 3). Representative results for mouse 2 are presented in Figure 2. It should be stressed that some nodules could not be visualized directly by PET because of low or heterogeneous expression of HER2, as confirmed by immunohistochemistry staining (Table 1). We did not quantify the tracer uptake in the lesions smaller than 1.8 mm, which was below the spatial resolution of our PET scanner. At the end of the experiments, distribution of 18F-ZHER2:342-Affibody binding was also assessed ex vivo by autoradiography. The autoradiograms of the lung sections showed homogeneous uptake of the radioligand within multiple lesions, all confirmed to be metastases by H&E staining (Fig. 3).

Representative autoradiography (left) with corresponding H&E staining (right) of lung tissue sections of mouse 2 injected with 18F-ZHER2:342-Affibody. Arrows indicate tumor nodules. HER2 expression is heterogeneous. N = normal lung tissue.
Percentage of HER2 Immunohistochemistry Scoring from Overall Metastasis Areas That Were Annotated
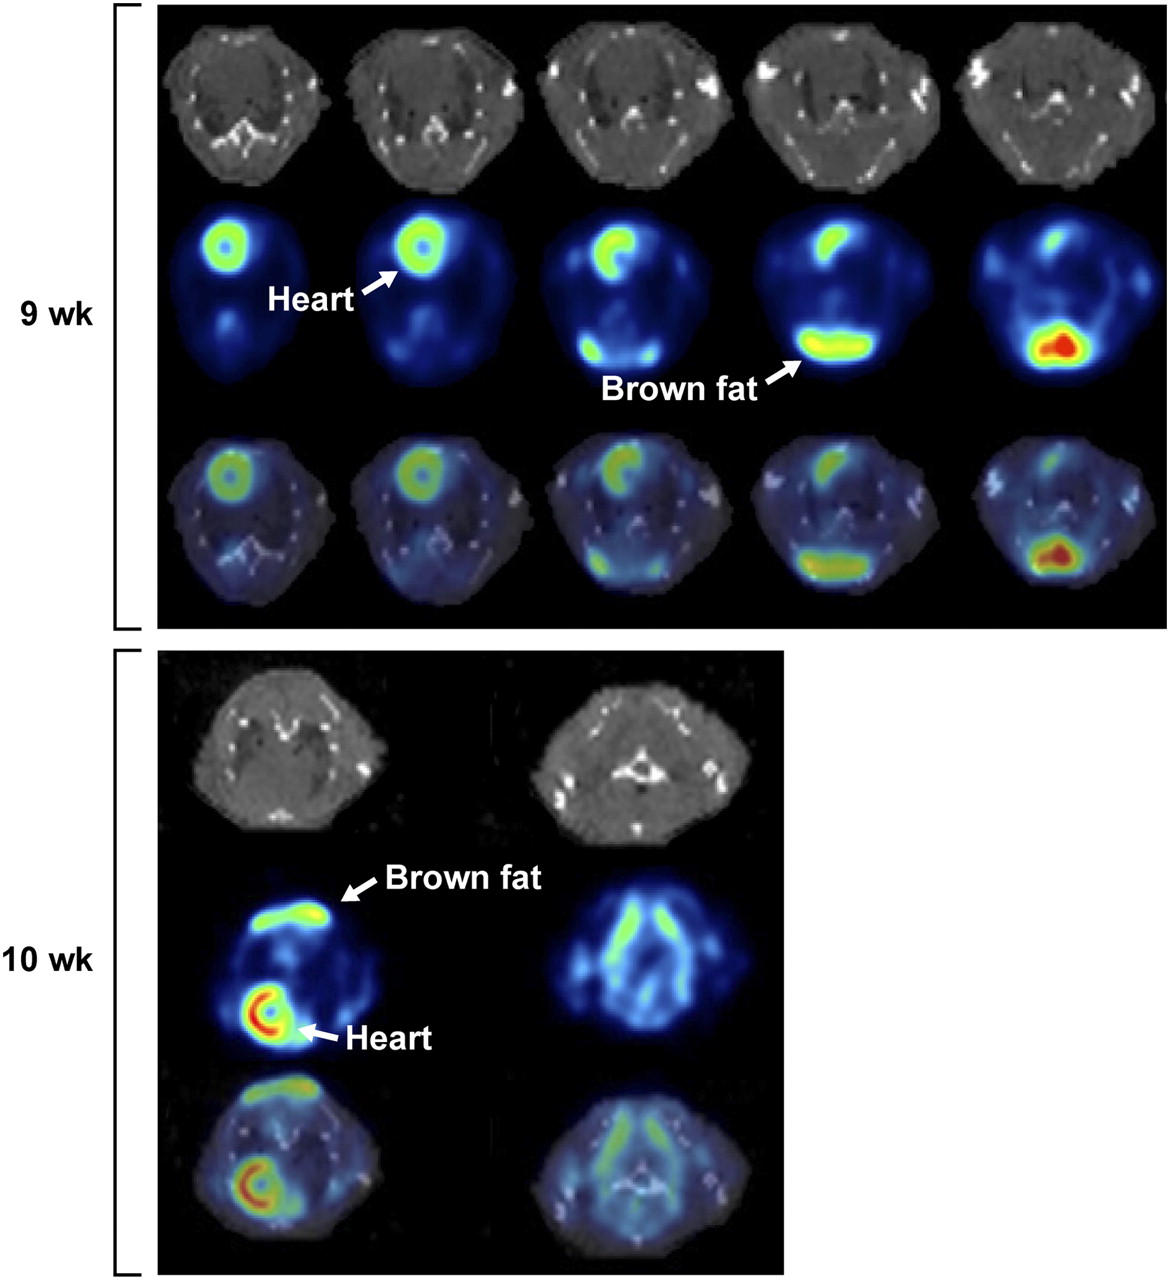
Interestingly, 18F-FDG distribution did not correlate as well with anatomic abnormalities on MR images. The 18F-FDG images showed prominent regions of uptake of radioactivity in the heart, lungs, and interscapular brown fat, which might have masked the detection of individual pulmonary metastases (Fig. 4; Supplemental Fig. 1). Thus, 18F-ZHER2-Affibody was able to discern individual pulmonary lesions more readily than 18F-FDG.

Contiguous transaxial PET/CT section of HER2-positive lung metastasis of mouse 2 at 1 h after 18F-FDG injection. Images were collected 9 and 10 wk after cells injection. Increased background activity made evaluation of small pulmonary nodules difficult. Heart and interscapular brown fat had prominent uptake that probably interfered with detection and delineation of most lesions.
To correlate 18F-ZHER2:342-Affibody uptake with precise anatomic localization of pulmonary lesions, we compared CT and MRI in this setting; both images were obtained from 4 animals (Supplemental Table 1). Although T1-weighted images depicted normal anatomic structures, the T2-weighted images were necessary for detecting metastatic tumors and pleural effusions. To characterize tumor progression more quantitatively, the metastatic pulmonary foci were evaluated by a semiautomated, globally optimal segmentation. T2-weighted images in axial slices were used for this analysis. The corresponding metastatic implant volumes were calculated from the total number of voxels multiplied by the spatial resolution. The growth of metastatic disease was detected in the 1-wk interval. Representative images of mouse 2 are shown in Figure 5. Initial in vivo MR images of this animal demonstrated the pulmonary metastatic tumor size and area, ranging from 1.01 to 5.17 mm and from 1.26 to 15.37 mm2, respectively. One week after the initial imaging study, the tumor size and area increased from 1.45 to 5.93 mm and from 2.46 to 22.63 mm2, respectively (Table 2). For a better association of the anatomic structures and the areas of increased uptake in the PET scans, PET and MR images were coregistered, and the fusion of MR and PET images allowed the high-uptake areas of 18F-ZHER2:342-Affibody to be matched with the corresponding tumor implants within the lungs (Fig. 2). Image fusion between PET and CT did not allow for precise anatomic localization of the lesions (Supplemental Fig. 3), because atelectasis, respiratory artifacts, and beam-hardening artifacts from the ribs significantly degraded the quality of CT and interfered with detection of pulmonary foci.

Automated segmentation of tumor lesions from MRI slices acquired 10 wk after tumor cells inoculation. Six slices are arranged such that first column shows original images, second column shows delineated tumor regions, and last column shows fused delineated regions onto MR images. Corresponding intensity and geometry-based features are listed in Table 2.
Quantitative Measurements of Segmented Lesions Acquired by MRI
Histopathology Evaluation
A subset of lung tissues was submitted for detailed histologic analysis. The H&E staining indicated multiple well-demarcated tumor metastases, on visceral pleura and in the mediastinum. Figure 6 shows a representative H&E, anti-HER2 stain of lung parenchyma. The tumor nodules were widespread throughout the lung. Immunohistochemistry staining using the HercepTest demonstrated heterogeneous patterns of HER2 expression in individual animals (Table 1), resulting in lower 18F-ZHER2:342-Affibody uptake in several lesions detected by PET. In particular, 15.6% of cells were evaluated as 3+, 15.9% as 2+, and 32.8% as 1+, and as many as 36.4% of the cells were scored as HER2-negative within analyzed lesions.

H&E (top) and anti-HER2 (bottom) staining of lung tissue slices.
DISCUSSION
Molecular imaging has the potential to provide noninvasive information about the receptor expression profile of tumors, which can aid in initial tumor characterization and in treatment selection and monitoring. The results of our study demonstrate that targeted 18F-ZHER2:342-Affibody can be useful in detecting HER2-expressing pulmonary metastases. In contrast, individual lesions were difficult to discern on 18F-FDG scans because of surrounding inflammation and atelectasis, and in any case such scans would not be specific for HER2 evaluation.
In our previous work (17), we demonstrated that 18F-ZHER2:342-Affibody can monitor HER2 expression level and assess receptors’ downregulation after anti-HER2 therapy in subcutaneous BC xenograft models. Here, we use the same agent in a metastatic model of BC. This experimental model does not fully mimic spontaneous metastases but does create a combination of HER2-positive metastases and inflammatory reaction in the lungs that is similar to the clinical scenario. In this respect, colonization of BC cells in the lungs via intravenous injection, although flawed as a biologic model of metastases, is adequate for comparing imaging modalities for the detection of pulmonary nodules.
Currently, many publications describe the reporter-based visualization of cancer cell migration during the metastatic process, but few relate to the imaging of distant metastasis using exogenous-labeled agents. Recently, Cao et al. studied the pharmacokinetic and tumor targeting efficacy of 64Cu-DOTA-IL-18 binding protein-fragment crystallizable region in the lung metastasis model by BLI, PET, and CT. Their results revealed the utility of multimodality imaging for monitoring the tumor response to therapy (18). However, in the tracer quantification, the entire lung uptake, rather than the single nodule, was considered. In this work, BLI provided a rapid, semiquantitative, and sensitive means of monitoring metastasis growth. When a threshold level of BLI signal was achieved, we initiated scanning with PET, MRI, and CT. We successfully visualized small, HER2-positive pulmonary nodules using 18F-ZHER2-Affibody as early as 9 wk after tumor cell inoculation. Favorable pharmacokinetic properties of the tracer (small size, rapid clearance, high affinity of binding to HER2) provided high imaging contrast between tumor and non–target tissue and allowed for accurate measurements of tracer uptake as early as 1 h after injection. The results from the autoradiography of lung tissue sections confirmed that the tracer successfully targets submillimeter foci of HER2-positive tumors.
It has been reported that 18F-FDG is useful in characterizing pulmonary nodules, thus improving BC staging and monitoring therapy response (19). However, 18F-FDG, although in common use, is not a tumor-specific imaging agent because it can be taken up by inflammation and other benign processes, whereas 18F-ZHER2-Affibody selectively targets HER2 receptors and is, therefore, more specific for malignancy. Our data demonstrate that HER2-positive pulmonary metastases can be masked by surrounding inflammation on 18F-FDG imaging, making it less effective in detecting those lesions. Similar results for imaging lung metastases using 18F-FDG PET were reported by Sampath et al. (20). Furthermore, the observed variability in 18F-FDG uptake can be due to changes in blood glucose metabolism that occur in small animals, related to the mode of anesthesia and length of the fasting period. The high 18F-FDG uptake in the myocardium, which may have interfered with the visualization of lung metastases, might have been improved using sevoflurane instead of isoflurane anesthesia (21). Therefore, we believe that the high selectivity and specificity of 18F-ZHER2:342-Affibody is of potential interest in clinical situations in which the HER2 status of metastases needs to be reassessed during treatment.
For accurate identification and localization of HER2-positive lesions, we coregistered 18F-ZHER2:342-Affibody distribution with MRI and CT. CT is the method of choice for imaging lung metastases in the clinical setting. However, because of the geometry of the mouse, the requirement for deep sedation and, therefore, poor lung motility leading to atelectasis, this modality is not easily translated to murine models. Additionally, CT has the disadvantages of requiring long acquisitions and of exposing the animal to high doses of radiation, which could affect some research studies (22). MRI, on the other hand, is more sensitive for pulmonary metastases and can be used for longitudinal studies of tumor development and therapeutic response, without the confounding variable of ionizing radiation. Additionally, it was previously shown by Garbow et al. that respiratory-gated MRI can reliably detect submillimeter lung lesions in mice (23). Therefore, we suggest that MRI, rather than CT, be considered the modality of choice for small-animal imaging of lung metastases in future studies.
CONCLUSION
18F-ZHER2:342-Affibody enables detection of HER2-overexpressing tumors metastatic to the lung with high sensitivity. This ability likely relates to the favorable pharmacokinetics of the Affibody molecules, along with the high affinities of the agent for HER2. High sensitivity was achieved despite considerable heterogeneity in HER2 expression within the tumors. In contrast, the lesions had relatively lower 18F-FDG uptake, which in any case was nonspecific for HER2 expression. Therefore, we believe that 18F-ZHER2:342-Affibody imaging may ultimately be useful for the identification and staging of BC metastases, possibly leading to more accurate patient stratification in treatment trials.
DISCLOSURE STATEMENT
The costs of publication of this article were defrayed in part by the payment of page charges. Therefore, and solely to indicate this fact, this article is hereby marked “advertisement” in accordance with 18 USC section 1734.
Acknowledgments
We appreciate the support of Affibody AB. We owe special thanks to Elaine Jagoda and Steven Adler for continuous constructive discussions. The content of this publication does not necessarily reflect the views or policies of the Department of Health and Human Services, nor does mention of trade names, commercial products, or organizations imply endorsement by the U.S. government. This research was supported in part by the Center for Cancer Research, an Intramural Research Program of the National Cancer Institute, Imaging Probe Development Center; National Heart, Lung, and Blood Institute; National Institute of Biomedical Imaging and Bioengineering; and the Breast Cancer Research Stamp Fund awarded through competitive peer review. In addition, the study was funded in part with federal funds from the National Cancer Institute, National Institutes of Health, under contracts N01-CO-12400 and N01-CO-12401, and HHSN261200800001E. No other potential conflict of interest relevant to this article was reported.
Footnotes
Published online May 11, 2012.
- © 2012 by the Society of Nuclear Medicine, Inc.
REFERENCES
- Received for publication November 7, 2011.
- Accepted for publication February 28, 2012.


Jump to section
Related Articles
Cited By...
- Phase II Trial Assessing the Repeatability and Tumor Uptake of [68Ga]Ga-HER2 Single-Domain Antibody PET/CT in Patients with Breast Carcinoma
- HER3-Mediated Resistance to Hsp90 Inhibition Detected in Breast Cancer Xenografts by Affibody-Based PET Imaging
- Preclinical and clinical applications of specific molecular imaging for HER2-positive breast cancer
- Targeting the Human Epidermal Growth Factor Receptors with Immuno-PET: Imaging Biomarkers from Bench to Bedside
- Positron Emission Tomography Imaging with 18F-Labeled ZHER2:2891 Affibody for Detection of HER2 Expression and Pharmacodynamic Response to HER2-Modulating Therapies
- Three Methods for 18F Labeling of the HER2-Binding Affibody Molecule ZHER2:2891 Including Preclinical Assessment