


Abstract
PET and MRI are powerful imaging techniques that are largely complementary in the information they provide. We have designed and built a MR-compatible PET scanner based on avalanche photodiode technology that allows simultaneous acquisition of PET and MR images in small animals. Methods: The PET scanner insert uses magnetic field–insensitive, position-sensitive avalanche photodiode (PSAPD) detectors coupled, via short lengths of optical fibers, to arrays of lutetium oxyorthosilicate (LSO) scintillator crystals. The optical fibers are used to minimize electromagnetic interference between the radiofrequency and gradient coils and the PET detector system. The PET detector module components and the complete PET insert assembly are described. PET data were acquired with and without MR sequences running, and detector flood histograms were compared with the ones generated from the data acquired outside the magnet. A uniform MR phantom was also imaged to assess the effect of the PET detector on the MR data acquisition. Simultaneous PET and MRI studies of a mouse were performed ex vivo. Results: PSAPDs can be successfully used to read out large numbers of scintillator crystals coupled through optical fibers with acceptable performance in terms of energy and timing resolution and crystal identification. The PSAPD-LSO detector performs well in the 7-T magnet, and no visible artifacts are detected in the MR images using standard pulse sequences. Conclusion: The first images from the complete system have been successfully acquired and reconstructed, demonstrating that simultaneous PET and MRI studies are feasible and opening up interesting possibilities for dual-modality molecular imaging studies.
- instrumentation
- PET
- MRI
- multimodality imaging
- position-sensitive avalanche photodiode
- molecular imaging
- animal imaging
PET is a powerful molecular imaging modality that uses positron-emitting radionuclides attached to biologically relevant molecules to provide exceptionally sensitive assays of a wide range of biologic processes. Its principal drawback is relatively poor spatial resolution and, for many radiotracers, limited anatomic information, often making unambiguous localization of signal difficult. MRI, on the other hand, provides exquisite high-resolution anatomic information in the submillimeter range (1), access to a range of physiologic parameters (e.g., water diffusion, permeability, vascular volume), the ability to track relatively small populations of cells in vivo (2), and, using spectroscopic imaging, techniques that provide spatially localized metabolic and biochemical information (3). For these reasons, PET and MR techniques are largely complementary (4) and merging of these 2 modalities in the study of experimental animal models may allow us to exploit, in a synergistic fashion, the strengths of both techniques.
Although PET/CT scanners have quickly become established (5), development of PET/MRI has been slower, due to the additional challenges of developing dual-modality systems that avoid deleterious interactions caused by the high magnetic field environment of the MR scanner and radiofrequency (RF) interference between the PET and MRI systems and also the likely cost of a PET/MRI system. However, PET/MRI differs from PET/CT in several important respects, and its applications therefore will also likely be quite different. The wealth of information beyond morphology that MRI can provide enables PET/MRI to go far beyond simple anatomic molecular imaging. This is likely why most approaches to combined PET/MRI systems integrate the PET scanner within the magnet such that studies can be acquired simultaneously rather than opting for the tandem back-to-back design of PET/CT scanners. Two other obvious differences between PET/CT and PET/MRI are that in PET/MRI the anatomic information is provided without any additional radiation dose to the subject; on the other hand, MRI does not directly provide the information needed for attenuation correction of the PET data, although the latter is likely a solvable problem. Another minor consideration in PET/MRI is that in high magnetic fields, the positrons emitted in β+ decay spiral around the field lines, reducing the effective positron range in 2 of the 3 dimensions. This may improve spatial resolution in PET when using high-energy positron emitters inside high-field magnets (6), although, for many applications, improvements are not likely to be significant.
Two major approaches are currently being investigated for combined PET/MRI systems. The first uses 3- to 5-m-long optical fibers to couple scintillator elements placed inside the magnet to photomultiplier tubes (PMTs) and electronics placed outside the fringe magnetic field (Fig. 1A) (7,8). The long fibers are required because of the sensitivity of PMTs to even small magnetic fields. By placing only the scintillator material inside the MR scanner, and keeping all of the PET readout electronics outside of the magnet, electromagnetic interference (EMI) between the 2 imaging systems is minimized. Using this approach, a prototype scanner was built in our laboratory and demonstrated that simultaneous acquisition of PET and MRI and PET and nuclear magnetic resonance spectroscopy (MRS) data was possible (8,9). A multilayered single-ring PET insert based on this approach, which significantly improves the sensitivity compared with the original prototype, is currently under development (10). However, there are several drawbacks to this approach. First, with 3- to 5-m-long optical fiber coupling, a significant fraction (somewhere between 50% and 75%) of the scintillation light is lost, degrading crystal identification, energy resolution, and timing resolution relative to photon detectors that are directly coupled to the scintillator. A second problem is that to achieve both high spatial resolution and sensitivity in the PET insert requires a large number of crystals and, because of the limited space inside conventional MR magnets, it is not practical to fiber-optically couple large numbers of fibers to external electronics. A similar PMT-based approach to PET/MRI is being pursued by Carpenter and colleagues (11), using a novel split-magnet low-field MRI system, which allows a relatively large number of PET detectors to be placed inside the gap within the MRI system and also reduces the fiber lengths compared with previous systems. The performance of the PET system is projected to be significantly better than previous attempts with this design, although it does have the drawback of requiring a specialized and lower field magnet.
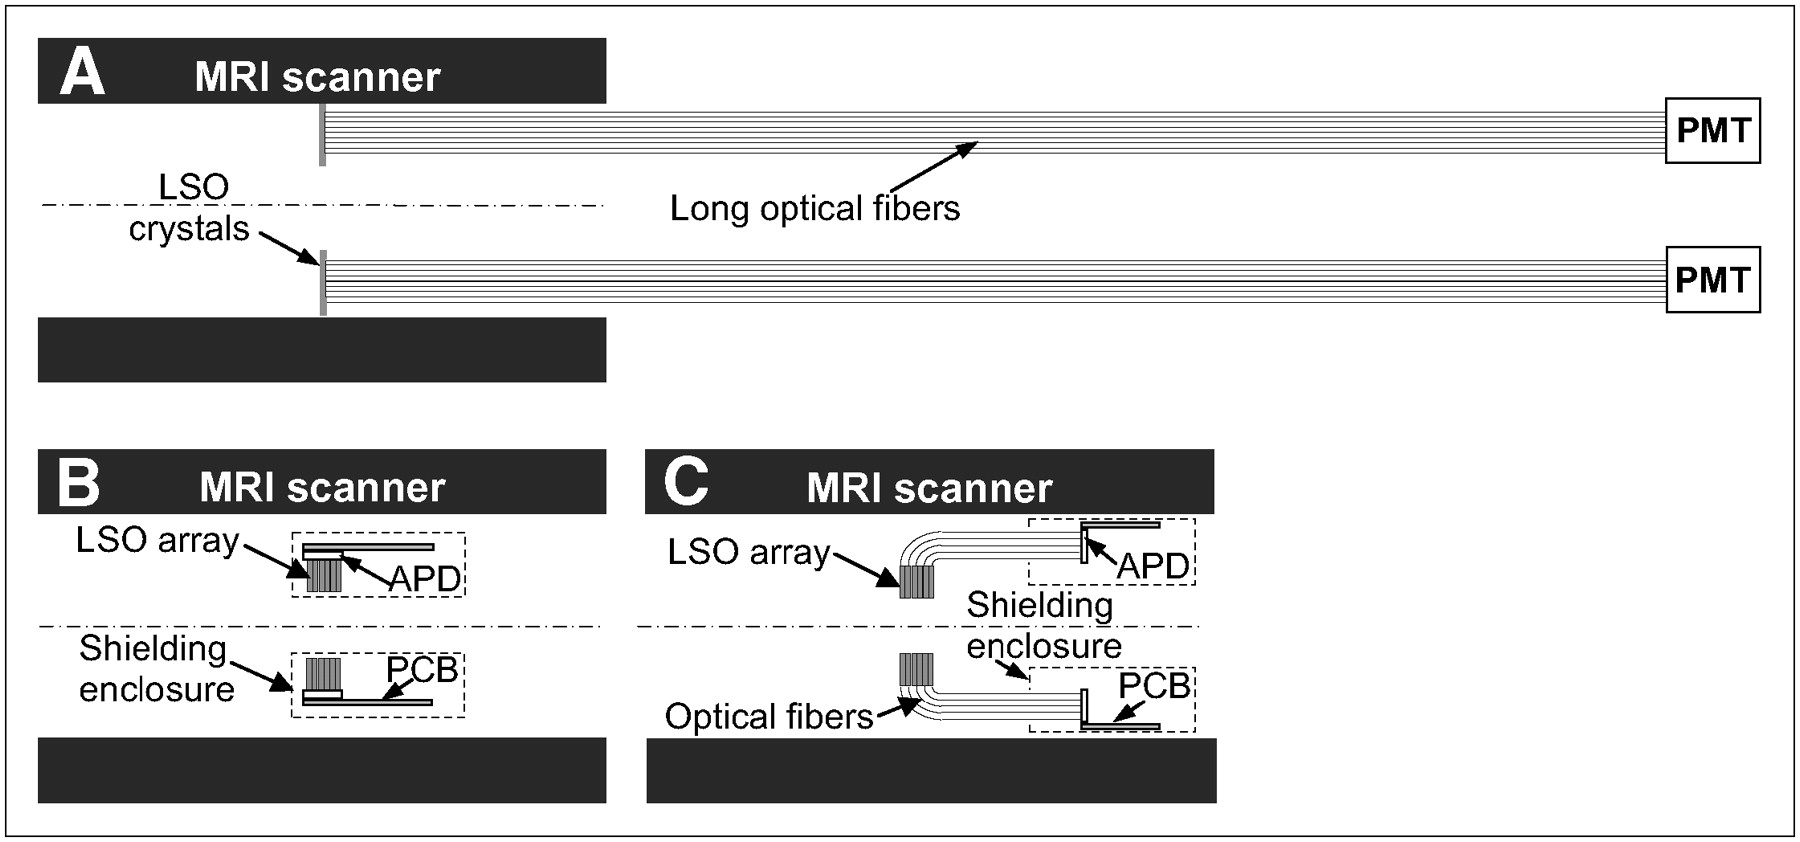
Different approaches to combined PET/MRI. (A) Long optical fibers used to couple scintillators to PMTs residing outside the magnet. (B) Avalanche photodiodes (APDs) coupled directly to scintillator elements. (C) Scintillators coupled through short optical fibers to APDs. In all cases, lutetium oxyorthosilicate (LSO) detectors are centered axially in the MRI field of view.
The second approach is to use magnetic field–insensitive, solid-state photon detectors—avalanche photodiodes (APDs)—as replacements for PMTs and couple these directly to the back of the scintillator elements (Fig.1B) (12). APDs are relatively immune to magnetic fields and have been demonstrated to work inside MRI scanners at fields as high as 9.4 T (13). They require a charge-sensitive preamplifier (CSP) to be placed as close as possible to the detector to minimize the capacitance, ensuring lower noise and better signal quality (14). To shield the PET electronics from external high frequencies, the preamplifier and buffers have to be enclosed in metal housing. This approach solves the many limitations of fiber-optically coupled systems but has the largest potential for interference between the RF and gradient coils and the PET electronics. It is not yet clear whether artifact-free PET/MRI data can be acquired simultaneously with such an approach, although encouraging early data are available from a pair of complete detector modules (15), and a similar approach is being pursued to develop a human brain PET insert for the Siemens Trio 3-T clinical magnet (16).
Here we describe a hybrid approach in which we attempted to minimize EMI between the 2 systems, while still taking advantage of the field insensitivity of APDs to produce a compact, high-performance PET insert that would have the best chance of providing artifact-free data from simultaneous PET and MRI. We coupled lutetium oxyorthosilicate (LSO) arrays via very short optical fiber bundles to APDs and preamplifiers, such that the PET electronics reside outside the RF coil and the linear region of the gradient coils, but still within the bore of the magnet (Fig. 1C). To read out the large number of crystals we use position-sensitive avalanche photodiodes (PSAPDs) (17). The total volume of fibers is in this way greatly reduced, and the PSAPDs together with their dedicated printed circuit boards (PCBs) and electronics are placed such that they are less likely to interfere with the MRI system.
The experiments in this article sought to address several critical questions. (a) Is the light collection and overall performance of fiber-optically coupled scintillation detectors at 511 keV, read out not by PMTs but by compact APDs, adequate for small-animal PET applications? To our knowledge, fiber-optic coupling to APDs for PET applications has not been explored, and it is not known whether sufficient scintillation light can be collected to overcome the lower gain and higher noise of APDs in comparison with PMTs. (b) Can an APD-based detector with its associated electronics be used in the high magnetic field environment of an animal MRI system without significant interference between the 2 systems? (c) Can the feasibility of simultaneous PET/MRI with such a system be demonstrated? To address these questions, we present results from individual detector modules, and from the completed PET scanner, operating inside a 7-T animal MRI system.
MATERIALS AND METHODS
PET Detector Module
Scintillator Array.
Maximizing light collection from the end face of the scintillator elements after a 511-keV photon interaction is important for crystal identification within a PET detector and also for timing and energy resolution. We chose an LSO scintillator for the PET/MRI project because it combines good stopping power (attenuation length, 1.1 cm at 511 keV) with excellent light yield (∼25,000 photons per MeV) (18). Furthermore, LSO has been shown to be an MR-compatible scintillator material, having a magnetic susceptibility similar to that of human tissue (19). The LSO arrays consisted of 64 crystals (8 × 8), each measuring 1.43 × 1.43 × 6 mm3, arranged with a pitch of 1.51 mm to allow space for the 66-μm-thick dielectric reflector film (Agile Engineering). The crystals were polished on all faces except the entrance face, which was as cut.
Optical Fibers.
To place the PSAPDs outside the MRI field of view (FOV) and to be able to decode a multiring PET system, it is necessary that the optical fibers be bent sharply through 90° as they exit the rear of the crystal (Fig. 1C). The custom-made optical fiber bundle (Saint Gobain) consisted of an array of 6 × 6 optical fibers, each measuring 1.95 × 1.95 mm2. The radii of curvature for the fibers ranges from 6 to 16 mm, and the length of the straight portion of the fiber is 10 cm. The fibers are double-clad plastic optical fibers (the refractive indices are 1.68, 1.49, and 1.42 for the core material and first and second cladding material, respectively) with a numeric aperture of 0.74. A 25-μm layer of white extramural absorber is coated on the outside of each individual fiber to act as a reflector and reduce crosstalk between adjacent fibers. A 6 × 6 array of fibers results in some light sharing between the LSO crystal array and the fiber array, which makes the exact coupling alignment of the 2 components far less critical. The larger-diameter fibers also result in better light transmission between the LSO array and the PSAPD.
Photodetectors.
The 14 × 14 mm2 PSAPDs (Radiation Monitoring Devices Inc.) used in this project have been described previously (17). They have 5 contacts: 4 bottom anode contacts are used to get positioning information and the top cathode contact is used for energy and timing information. The energy information can also be obtained using the sum of the 4 bottom signals.
Preamplifiers.
A custom PCB, populated with nonmagnetic components, was made to connect the PSAPDs to Cremat CR-110 CSPs (Cremat Inc.). Although the CR-110 is, to our knowledge, the best commercially available CSP for these PSAPDs, optimal timing performance may ultimately require a custom-designed preamplifier.
Assembly.
Optical grease was used to couple the crystal arrays to the fiber bundles and a custom-designed compression fitting was fabricated to couple the PSAPDs robustly to the fiber bundle at the other end. A picture of a complete PET detector module consisting of the LSO array, the optical fiber bundle, the PSAPD, and the 5 CSPs mounted on the custom PCB, is shown in Figure 2A.

Pictures of MR-compatible PET detector module (A) and of complete MR-compatible PET scanner (B) consisting of 16 detector modules, shielding material (removed on left side), and carbon fiber tube for support.
MR-Compatible PET Scanner Design and Construction
The complete PET scanner insert consists of 16 of the modules described earlier, with 8 PSAPDs displaced axially to the front and rear of the LSO detector ring in an alternating pattern as shown in Figure 2B. The PET electronics were shielded at both ends with 2 concentric cylinders (outer diameter/inner diameter [OD/ID], 118/65) made of a high-frequency laminate (RT/Duroid 5870; Rogers Corp.) to minimize the RF interference between the 2 systems. 3M copper conductive tape was also applied to the end caps and to the ring through which the fiber-optic bundles passed to further reduce interference. All of the detector modules and the shielding are mounted on a carbon fiber tube (55-cm length; OD/ID, 62.8/60) for support.
Subminiature nonmagnetic 50-Ω coaxial cables were used to connect the outputs of the preamplifiers to standard nuclear instrumentation module (NIM) electronics located at a safe distance, outside the 5-G line of the MR scanner. Four 16-channel spectroscopy amplifiers (model N568B; Caen Technologies, Inc.) shape (200-ns shaping time) and amplify the 64 preamplifier output signals that were used to obtain the position information. A multiplexer board designed and built for this project was used to reduce the number of channels from 64 to 8. The other 16 channels used to get the timing information are shaped (10-ns integration time, 20-ns differentiation time) and amplified using 4 quad-timing filter amplifiers (model 863; Ortec) and then fed into constant fraction discriminators and standard NIM logic units (model 756; Phillips Scientific). Once a coincidence event is detected, a trigger is sent to the multiplexer board that switches to the corresponding channels and passes the signals' outputs to the data acquisition boards along with a trigger ID.
Two PowerDAQ-II PD2-MFS-C-UT data acquisition boards (United Electric Industries) were used to digitize the signals. These 8-channel boards have been validated previously for their application to digitizing fast PET detector signals with an external trigger (20). Two boards were operated together to allow simultaneous sampling of the 8 output channels plus the trigger ID channel. The software for controlling the data acquisition of the PET insert with these boards was developed in LabWindows (National Instruments).
High-voltage and standard direct-current (DC) power supplies were used to bias the PSAPDs and to supply the ±12-V DC power to the preamplifiers. The performance of PSAPDs is greatly improved by moderate cooling (by increasing the devices' responsivity and reducing the dark current shot noise) (21). Measurements described in this article were conducted with the PSAPDs at approximately −5°C unless otherwise stated. Cooling was achieved by distributing cold nitrogen gas through a network of tubing and uniformly onto the PSAPDs within the PET insert. Table 1 summarizes the parameters of the completed MR-compatible PET scanner.
Major Characteristics of MR-Compatible PET Insert
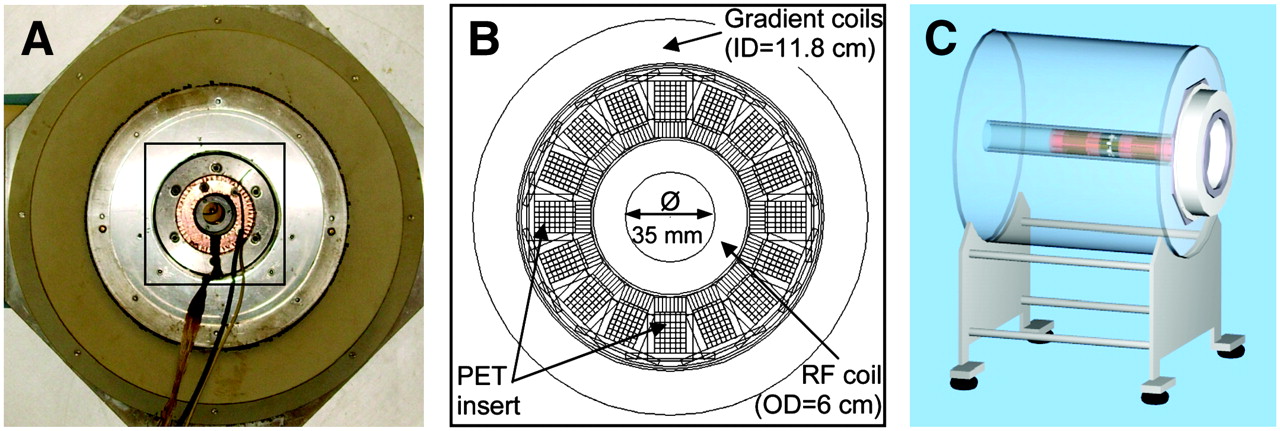
All combined PET/MRI experiments were performed inside a Bruker 7-T Biospec animal MRI system. The PET insert fits in the 29-mm space between the standard Magnex MKIII gradient set coils (OD/ID, 180/118) and the small-animal Bruker RF coil (OD/ID, 60/35). Figure 3 shows the location and geometry of the PET insert within the MRI system. For MR data acquisition, image reconstruction, display, and analysis, we used the ParaVision software package (Bruker) running on a Linux workstation. Unless otherwise stated, standard spin-echo (SE) (repetition time/echo time [TR/TE], 1,000/11.6) and gradient-echo (GE) sequences (TR/TE, 500/4.1; flip angle, 30°) were run, with a matrix size of 128 × 128 and 1-mm slice thickness. The RF coil was tuned and second-order gradient shimming was performed manually.

Placement of PET insert inside 7-T MRI scanner: Photograph (A) and drawing (B) show magnified view of insert and RF coil in place inside MR scanner, and drawing (C) shows axial placement.
Testing of PET Detector Module
Crystal Identification and Energy Resolution.
A 7.4-MBq 68Ge point source placed 3 cm away from the detectors was used to uniformly irradiate the arrays, and all 16 modules were tested. The resulting flood histograms were analyzed in terms of crystal identification, energy resolution, and uniformity. The energy resolution was computed as the full width at half maximum (FWHM) of the 511-keV photopeak. The relative position of the photopeak for each crystal was used as a measure of the light output for that crystal.
Timing Resolution.
The timing resolution was determined using a single LSO crystal optical fiber detector coupled using optical grease to a PSAPD. By coupling this single detector in different places across the area of the PSAPD (e.g., center, corner, side), the timing resolution at various locations across the device was characterized. A plastic scintillator (BC 400; Bicron) attached to a single channel PMT (Hamamatsu Photonics) was used in coincidence with the LSO-fiber-PSAPD detector as the reference channel. A 1.5-MBq 68Ge source was placed between the 2 detectors. Timing signals were generated with constant fraction discriminators (model 453; Tennelec) and timing spectra acquired using a time-to-amplitude converter (model 863; Tennelec) and standard techniques. Timing measurements (characterized by the FWHM of the timing spectra) were made for a range of integration and differentiation times on the fast-filter amplifier reading out the PSAPDs. The bias voltage on the PSAPDs was −1,657 V, approximately 10 V below breakdown. The lower energy threshold was set to ∼250 keV.
Initial Studies of Interference Between PET Insert and MRI
The design of the PET scanner was intended to minimize interference with the MRI system. Wherever possible, nonmagnetic components were used to construct the PET insert and preamplifier electronics, and the shielding materials on the 2 halves of the insert were positioned such that there is a 16-cm central region at the center of the magnet and MR imaging volume that is clear of any conductive materials. The following experiments were designed to examine the effects of the PET scanner on the MRI system and vice versa.
Effect of MRI on PET Flood Histogram.
Flood histograms were obtained with the PET insert in the magnet by irradiating the detectors with a 68Ge point source. Flood histograms also were obtained while running standard MR sequences and were compared with the flood histograms obtained when the PET insert was outside of the magnet. When inside the magnet, the PET insert was positioned axially such that it was centered at the isocenter of the MRI magnet. Typical SE and GE sequences were used to evaluate their effect on the flood histograms.
Effect of MRI on PET Energy Resolution.
After generating the flood histograms, the photopeak amplitude and energy resolution were measured for one of the central detector elements in the module and compared inside and outside the magnet, and with and without MR pulse sequences running. The pulse sequences were the same as those used in the preceding experiment.
Effect of PET Insert on MRI Phantom Images.
A uniform cylindric MR phantom (Ø, 30 mm; length, 8 cm) containing gadopentetate dimeglumine (Magnevist; Berlex, Inc.) in water (T1 = 250 ms) was imaged to assess the effect of the PET insert on the MR data acquisition. The small-animal RF coil, tuned and matched to its optimum before each experiment, was placed inside the PET insert. MRI pulse sequences with the parameters specified previously were run. The resulting images were visually inspected for the presence of artifacts. The uniformity of the images was measured by drawing one large (Ø, 23 mm) region of interest (ROI) on a single MR slice and copying it across all slices containing the phantom. The ROI placement avoided the very edges of the image where partial-volume effects dominate. The uniformity (%) was defined as: where ROImax is the highest pixel value in the ROI and ROImin is the lowest (22). The signal amplitude and the noise were estimated by the mean pixel value and the SD of the pixel values, respectively, in an ROI placed centrally on the phantom. The ROI in this case was chosen to be small enough (Ø, 6.6 mm) to avoid major contributions from nonuniformity. Uniformity, signal amplitude, and noise were compared across imaging conditions, with and without the PET insert present.
Simultaneous Small-Animal PET and MRI
As a proof of principle that demonstrates the feasibility of simultaneous PET and MRI with this system, simultaneous PET and MRI studies were performed on a 25-g mouse. Approximately 18.5 MBq of 18F− were injected via the tail vein, and the mouse was sacrificed 3 h after injection, before imaging. The animal was sacrificed for this feasibility study because, at the present time, the central bore of the insert cannot easily be maintained at 37°C for in vivo imaging. The future incorporation of a heated animal stage and appropriate thermal insulation of the PET insert will remove this limitation. Approximately 5.55 MBq of activity were present in the mouse at the time of imaging.
PET data were acquired in 5-min scans for 3 bed positions, covering a total axial FOV of 28 mm. The lower-energy threshold was set just above the noise level for each detector module. A timing window of 40 ns was used. No correction was made for random coincidences.
Software written in Matlab was used to generate the 16 flood histograms, and the crystal look-up-tables were created in a semiautomated manner using a watershed algorithm. The detector efficiencies were assumed to be proportional to the total number of events recorded by each detector. Although the assumption is not exact for the mouse data, it is a reasonable approximation given that we did not have any normalization scan. The PET images were reconstructed using a maximum-likelihood expectation maximization algorithm with explicit modeling of the scanner geometry and detector efficiencies (23) and then overlaid onto the MR images.
MR data were acquired simultaneously with the PET data using a SE sequence (TR/TE, 1,000/11.25; matrix size, 256 × 256; slice thickness, 1 mm) with fat suppression. The RF coil was tuned and matched to its optimum for each bed position, and second-order shimming was manually performed in each case.
This animal study was performed under a protocol approved by the University of California Davis Animal Care and Use Committee.
RESULTS
Testing of PET Detector Module
Crystal Identification and Energy Resolution.
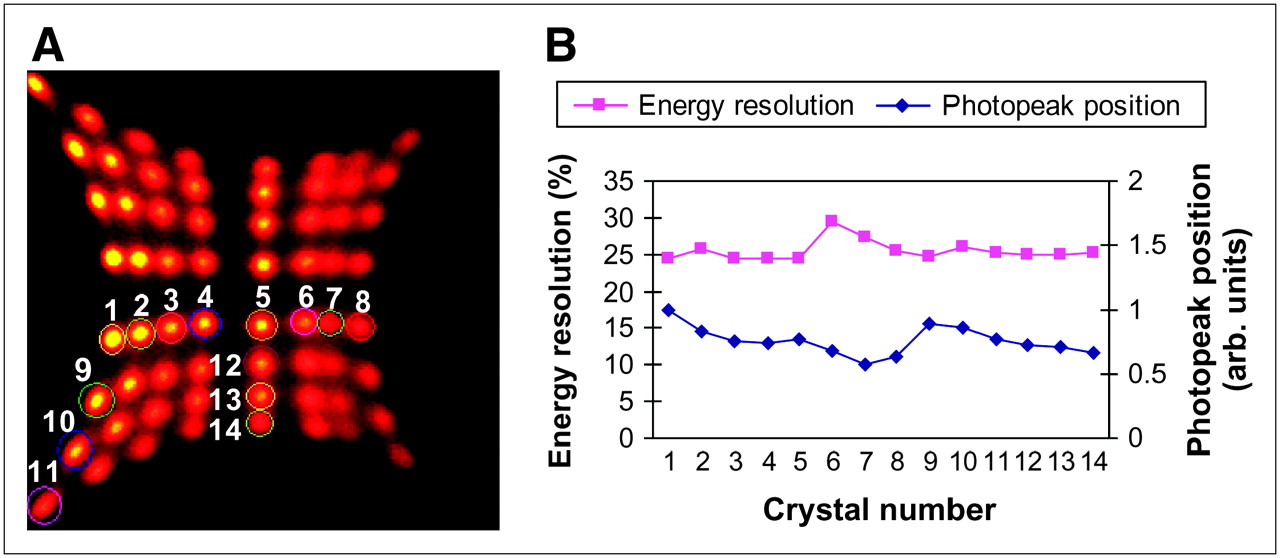
A representative flood histogram for 1 of the 16 detector modules is shown in Figure 4A. The pincushion distortion is specific to PSAPDs with a 4–corner anode design and is a consequence of the planar resistive readout. All 64 crystals were clearly identifiable in the resulting flood histograms and the average energy resolution was 25.5% (range, 24.3%–29.3%) (Fig. 4B). The light output, estimated by the position of the 511-keV photopeak, varied across the array with a coefficient of variation of 14.7% for the 14 detector elements highlighted in Figure 4A. One clear trend was roughly a 40%–50% change in photopeak amplitude from left to right that is largely due to the light loss caused by the bending of the fibers, which becomes worse for smaller radii of curvature. Variations between individual crystals or fibers could also contribute to the variability seen across the array. Nonetheless, the variability is less than seen in some block detectors that have been widely used in clinical PET scanners (24).

(A) Flood histogram of data acquired from PET detector module. (B) Plot of energy resolution and relative photopeak position for selected crystals. arb. units = arbitrary units.
Timing Resolution.
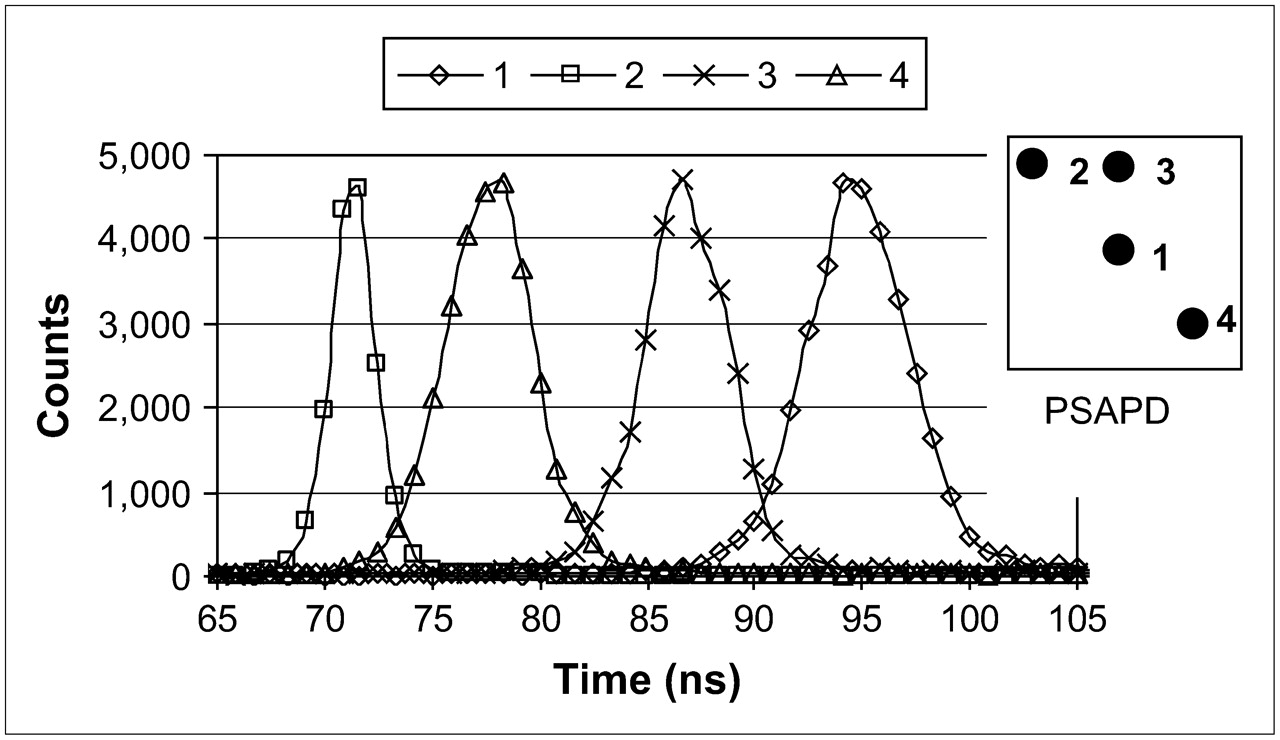
The timing resolution for the LSO fiber detector coupled to the 14 × 14 mm2 PSAPDs was in the range 2.5 to 3.8 ns for a LSO crystal placed close to the corner of the PSAPD, with the best values obtained for shorter integration times. Similarly, a timing resolution in the range 5.2 to 7.5 ns was measured for a LSO crystal placed near the center of the device. Because a straight fiber was used for these measurements, the timing resolution may be slightly worse in the actual system, where the fibers are bent.
A more interesting aspect revealed by this measurement is the apparent time shift that can be observed between the signals originating from the center of the photodetector and those originating from the corner or the sides (Fig. 5). This time difference can be as large as 25 ns and is a result of the resistive readout that is used by the PSAPDs to provide the positional information. The effect is present even when the timing signal is derived from the top cathode. The cause is the position-dependent delay of the PSAPD signal that produces a variability in the timing trigger with respect to the time of the interaction. This effect also likely explains the deterioration of timing resolution for detectors at the center of the PSAPD, as the scintillation light is spread over a larger area than that for detectors at the edges, thus broadening the response.

Timing resolution spectra for LSO optical fiber detector placed in different locations on PSAPD. Integration and differentiation times were both 10 ns and PSAPD was biased at 10 V below breakdown. Note position-dependent delay, with largest delay occurring for events located at the very center of the PSAPD.
For this reason, a wide coincidence window of 40 ns is used presently with the system. Though not ideal, it is not a major problem for the present system, as the rate of random coincidences is generally low (based on experience with commercial animal PET scanners) for a few megabecquerels of activity distributed in a mouse-sized object. A possible solution to this problem is presented in the Discussion.
Initial Studies of Interference Between PET Insert and MRI
Effect of MRI on PET Flood Histograms.
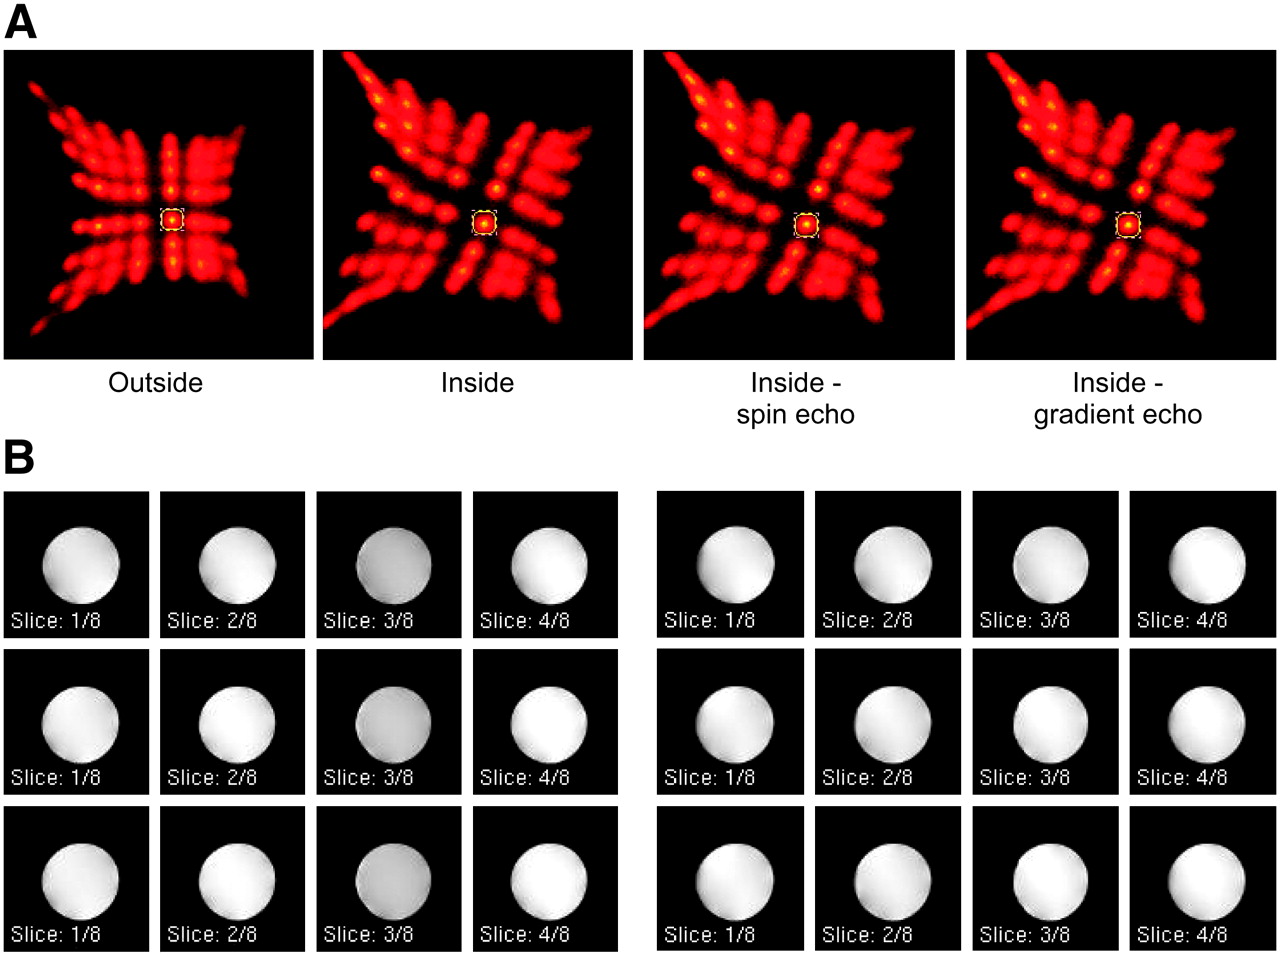
The PET data acquired while running standard SE and GE sequences showed no significant degradation in crystal separation (Fig. 6A), as measured by peak-to-valley ratios. For the fifth column of crystals we measured an average peak-to-valley ratio of 2.2 in the flood histogram when the insert was outside the MR scanner, compared with values of 2.8 with the insert inside the magnet (no MR sequence running) and values of 2.9 and 2.7 while running a SE and a GE sequence, respectively. The slight rotation observed in the flood histograms when the insert is inside the magnet is believed to be due to the Hall effect acting on the electrons as they migrate through the high-resistivity anode toward the 4 corner electrodes. No relationship was observed between this distortion and the running of pulse sequences, which further supports that it is related to the static magnetic field. As long as individual crystals can be separated to create crystal look-up tables, these distortions are not a problem with regard to the performance of the PET detector module. The magnetic field force effects on the resistive readout also cause a slight increase in the spreading of the crystal pattern in the flood histogram, which could be an explanation for the small apparent improvement in crystal identification inside the magnet, as measured by peak-to-valley ratios.

(A) Flood histograms from PET detector module show data acquired outside and inside magnet and with and without application of standard MR pulse sequences. (B) MR phantom images: GE (left) and SE (right) sequences of a gadopentetate dimeglumine/H2O phantom (T1 = 250 ms) without PET insert (first row) and with PET insert unpowered (second row) and powered (third row).
Effect of MRI on PET Energy Resolution.
The energy resolution measured for the crystal highlighted in Figure 6A with the PET insert outside the magnet, inside the magnet, and with the insert inside the magnet while running the SE and GE sequences is shown in Table 2. The photopeak amplitude positions also are shown. We conclude that the static magnetic field and the operation of the MRI system have no significant effect on the signal amplitude and the energy resolution of the PET detector.
Effect of MRI on PET Energy Resolution and Photopeak Position
Effect of PET Insert on MRI Phantom Images.
SE and GE sequences were run in the presence of the PET scanner insert, both with it powered on (to study RF interference) and with it powered off (where effects are limited primarily to susceptibility artifacts and eddy currents). No obvious artifacts can be observed in the resulting phantom images when compared with the ones acquired without the PET insert (Fig. 6B). The signal amplitude, noise, and uniformity of the MR images under the different imaging conditions are shown in Table 3. The data confirm the visual evidence that there is no obvious degradation in the MR performance in the presence of the PET insert when using standard MR pulse sequences.
Effect of PET Insert on MR Phantom Images
Simultaneous Small-Animal PET and MRI
Figure 7 shows the first simultaneous PET and MR images of an animal using the system. Several transverse slices through the mouse head are shown. The MR images are of excellent quality, with major brain structures clearly discernible. No visible artifacts could be seen. Despite lack of accurate detector normalization, the 18F− PET images are good and show uptake in the skull and jaw bones, which register nicely with the signal voids on the MR image that indicate the location of bone. Uptake in the bones in the 2 front paws also aligns well with the MR images. Whereas the PET images can likely be improved with future detector normalization, proper system modeling, and improved stability of the entire imaging system, these first imaging results serve to demonstrate the feasibility of simultaneous PET/MRI using the PET scanner insert developed here.

Simultaneously acquired PET and MR images of mouse: First row, MR images; second row, PET images; third row, fused images.
DISCUSSION
We have built and obtained initial results from a multiring small-animal PET scanner insert operating within a preclinical 7-T MRI system using optical fiber bundles to couple the scintillator arrays to PSAPDs. The design is modular, such that it could be applied to existing animal MRI systems, and even to clinical MRI systems. The results obtained to date suggest that, with this approach, simultaneous PET and MRI are feasible and that there is no major deleterious interference between the 2 modalities, although, of course, more subtle artifacts and quantitative errors cannot be ruled out and must be carefully studied with appropriate experiments over the coming months.
The most critical issue discovered in the course of this work is that the timing resolution of the PSAPDs showed a significant variation across the face of the detector, with the worst results coming from measurements made at the very center of the device. This is likely caused by the resistive readout and its position-dependent effect on the signals reaching the timing circuitry. The exact consequences of these effects at a system level are difficult to estimate. With our current electronics, this effect requires that a wide timing window of approximately 40 ns be used to ensure that all valid coincidences fall within the timing window. Fortunately, the rate of random coincidences in small-animal studies tends to be low; nonetheless, a tighter timing window would be preferred. One possible solution is to acquire data with a relatively coarse coincidence window but also record, with 1- to 2-ns accuracy, the detection time of each single event in the list-mode data. This would permit postprocessing of the data by applying crystal-dependent time offsets (the effect is quite reproducible from PSAPD to PSAPD) that would correct this effect and would result in data that represented an effective timing window of around 10 ns.
Although the work in this article represents >2 y of design, construction, and testing, clearly there is still much to do before this PET insert can be used routinely for in vivo studies. In addition to a thorough investigation of interactions between the 2 systems using detailed phantom studies, further work needs to be done to ensure that the system is stable, particularly with regard to temperature (the gain and noise in APDs are very sensitive to even small fluctuations in temperature). We also need to implement an imaging stage that will hold the animal and RF coil, will provide anesthetic gas and heating to the animal while in the system, as well as provide a method for reproducibly positioning the PET insert within the magnet so that the transformation between the PET and MRI coordinate space is fixed. Finally, we will need to explore more-advanced MR pulse sequences and techniques (e.g., MR spectroscopic imaging) in conjunction with the PET insert.
CONCLUSION
A multislice PET scanner based on PSAPD technology and designed to fit in a preclinical MRI system has been built, and initial testing has been completed. To date, no deleterious interaction has been detected between the PET system and the MRI system. With the completed multislice PET scanner inside the magnet, first simultaneous PET/MR images of a mouse were obtained and did not display any visible artifacts. This work demonstrates the feasibility of simultaneously acquiring PET and MR images using a compact PSAPD-based PET scanner.
Acknowledgments
The authors thank Kanai Shah, Richard Farrell, and Purushottam Dokhale of Radiation Monitoring Devices, Inc., for providing the PSAPDs used in this work, and for many useful discussions regarding PSAPD technology, and Siemens Preclinical Solutions (formerly CTI Concorde Microsystems) for supplying the LSO arrays. The authors also thank Dr. Jennifer Stickel, Chris Griesemer, and Dr. Jeff Walton for their assistance with the experiments and Dr. Russell Jacobs (Beckman Institute, California Institute of Technology) for providing MRI expertise. Funding for this work was provided by National Institutes of Health grants R01 EB000993 and R01 EB000194.
References
- Received for publication July 17, 2006.
- Accepted for publication September 11, 2006.


Jump to section
Related Articles
Cited By...
- Predicting Gemcitabine Delivery by 18F-FAC PET in Murine Models of Pancreatic Cancer
- Performance of a PET Insert for High-Resolution Small-Animal PET/MRI at 7 Tesla
- A Prototype High-Resolution Small-Animal PET Scanner Dedicated to Mouse Brain Imaging
- MRI-Based Attenuation Correction for PET/MRI Using Multiphase Level-Set Method
- Clinical and research applications of simultaneous positron emission tomography and MRI
- Quantum Dots for Cancer Research: Current Status, Remaining Issues, and Future Perspectives
- Quantitative, Simultaneous PET/MRI for Intratumoral Imaging with an MRI-Compatible PET Scanner
- Performance Measurements of the Siemens mMR Integrated Whole-Body PET/MR Scanner
- PET/MRI: The Blended-Modality Choice of the Future?
- Tissue Classification as a Potential Approach for Attenuation Correction in Whole-Body PET/MRI: Evaluation with PET/CT Data
- The Effectiveness of 18F-FDG PET/CT Combined with STIR MRI for Diagnosing Nodal Involvement in the Thorax
- MRI-Based Attenuation Correction for PET/MRI: A Novel Approach Combining Pattern Recognition and Atlas Registration
- Small-Animal SPECT and SPECT/CT: Important Tools for Preclinical Investigation
- The technology of MRI -- the next 10 years?
- A Prototype PET Scanner with DOI-Encoding Detectors
- Tumor Cell Metabolism Imaging
- Latest Advances in Molecular Imaging Instrumentation
- Multimodality Molecular Imaging of Tumor Angiogenesis
- Simultaneous in vivo positron emission tomography and magnetic resonance imaging
- VP-PET: A New Imaging Modality?
- SPECT Low-Field MRI System for Small-Animal Imaging
- In vivo19F Magnetic Resonance Spectroscopy and Chemical Shift Imaging of Tri-Fluoro-Nitroimidazole as a Potential Hypoxia Reporter in Solid Tumors