


Abstract
The study was performed to compare the 18F-labeled nitroimidazole compound fluoroazomycin arabinoside (18F-FAZA) with the standard hypoxia tracer fluoromisonidazole (18F-FMISO) in detection of tumor tissue hypoxia and to verify the oxygenation dependency of 18F-FAZA uptake. Methods: Biodistribution of 18F-FAZA was studied at various time points in EMT6 tumor-bearing BALB/c mice and in AR42J and A431 tumor-bearing nude mice and compared with that of 18F-FMISO. The presence of tumor tissue hypoxia was verified in 5 EMT6 and 5 AR42J tumors using an oxygen-sensing needle electrode system. To evaluate the oxygenation dependency of 18F-FAZA uptake, using the Munich prototype animal PET scanner, 2 serial PET scans were performed in 13 A431 tumor-bearing nude mice breathing pure oxygen or room air on 1 d and then selecting the other oxygen breathing condition on the following day. In addition, digital autoradiography was performed with EMT6 tumor-bearing 18F-FAZA-dosed, nude mice breathing either room air (n = 8) or carbogen (n = 9). Results: Tissue partial pressure of oxygen (Po2) electrode measurements revealed that tumor hypoxia was present under room air breathing in EMT6 (tissue Po2 = 2.9 ± 2.6) and AR42J tumors (tissue Po2 = 0.4 ± 0.2), which was significantly lower compared with that of reference tissue (tissue Po2 = 25.8 ± 6.7 and tissue Po2 = 29.0 ± 3.0 [mean ± SD], respectively; P < 0.01). In all tumor models, 18F-FAZA displayed significantly higher tumor-to-muscle and tumor-to-blood ratios compared with 18F-FMISO, indicating a faster clearance of 18F-FAZA from normal tissues. In AR42J tumors, 18F-FAZA tumor-to-normal ratios were found to increase over time. Serial animal 18F-FAZA PET studies showed that the tumor-to-background ratio was significantly higher in animals breathing room air compared with that of animals breathing pure oxygen (7.3 ± 2.3 vs. 4.2 ± 1.2, respectively; P < 0.001). Similarly, autoradiography showed significantly higher tumor-to-muscle ratios in mice breathing room air compared with those of animals breathing carbogen (5.3 ± 0.8 vs. 2.2 ± 0.8; respectively; P < 0.02). Conclusion: 18F-FAZA shows superior biokinetics and is, thus, a promising PET tracer for the visualization of tumor hypoxia. This study also verified a hypoxia-specific uptake mechanism for 18F-FAZA in murine tumor models.
A large body of evidence indicates that tumor hypoxia has a major negative predictive value for local tumor progression, likeliness of metastasis, and overall tumor prognosis in several types of human cancers (1–5). In addition, tumor cell hypoxia has a negative effect on anticancer treatment (6,7), given that hypoxic cells are known to be 2–3 times more resistant to a single fraction of ionizing radiation than those with normal oxygenation levels (8). Identification of the presence of tumor tissue hypoxia may be relevant not only in predicting prognosis and response to current radiation treatment but also in identifying subgroups of patients likely to benefit from new treatment strategies (9).
Over the past 4 decades, a variety of methods to measure the hypoxic fraction in tissues have been proposed. However, none of the experimental in vivo methodologies (e.g., oxygen electrode systems) are currently used routinely in human malignancies (10), mainly because they are invasive, limited to readily accessible tumor sites such as cervix and head and neck cancer, and technically demanding. In addition, the exact localization of the probe’s tip within the tumor volume is difficult to determine. Therefore, oxygen-electrode systems are unsuitable to determine the tumor’s oxygenation distribution on a truly regional basis, which is a necessary precondition for individually adapted therapeutic approaches. Noninvasive identification and quantification of regional tumor tissue hypoxia would, therefore, be most desirable for effective treatment selection, individual treatment planning, and treatment monitoring in radiooncology.
The use of radiolabeled 2-nitroimidazoles for hypoxia imaging was proposed in 1979 by Chapman (11). Under hypoxic conditions, nitroimidazole compounds are thought to undergo reductive metabolism, forming highly reactive intermediates that consequently bind to macromolecular cellular components. Thus, these compounds tend to accumulate in sites of hypoxia and can be used for imaging purposes with both SPECT (12) and PET (13,14).
In general, a large variety of studies have been performed for evaluating different substrates with nitro- (NO2) groups. Extensive reviews of this topic are available (14,15). The nitroimidazole compound 18F-fluoromisonidazole (18F-FMISO) was the first nitroimidazole compound developed for PET and is currently being used in several cancer centers worldwide (14–19). The hypoxia-specific uptake of this radiopharmaceutical has been proven in a porcine liver occlusion model (20,21). However, its relatively slow clearance from blood and nontarget tissues results in low target-to-background ratios (T/Bk ratios) of 18F-FMISO. Other PET labeled nitroimidazole compounds with presumed hypoxia-specific retention have been reported in recent years, with some—such as 18F-fluoroerythronitroimidazole (22), 124I-iodoazomycin galactoside (23), and 18F-fluoroetanidazole (24)—showing potential in detecting tumor tissue hypoxia.
Previously, radioiodinated 1-(5-iodo-5-deoxy-α-d-arabinofuranosyl)-2-nitroimidazole (iodoazomycin arabinoside [IAZA]) was synthesized and successfully used for tumor tissue visualization (25). Compared with misonidazole, 125I-IAZA displayed rapid clearance from the blood, yielding to more favorable T/Bk ratios (26). Moreover, the arabinosyl-N1-α-glycosidic bond displayed enhanced in vivo stability against enzymatic cleavage. To allow tumor imaging with better spatial resolution, 18F-fluoroazomycin arabinoside (18F-FAZA) (Fig. 1) was recently synthesized and studied in various tumor-bearing mice using PET and autoradiography. In the present study, 18F-FMISO and 18F-FAZA were investigated for their suitability in detecting tumor tissue hypoxia and, in particular, to confirm the hypoxia-specific uptake mechanism for 18F-FAZA.
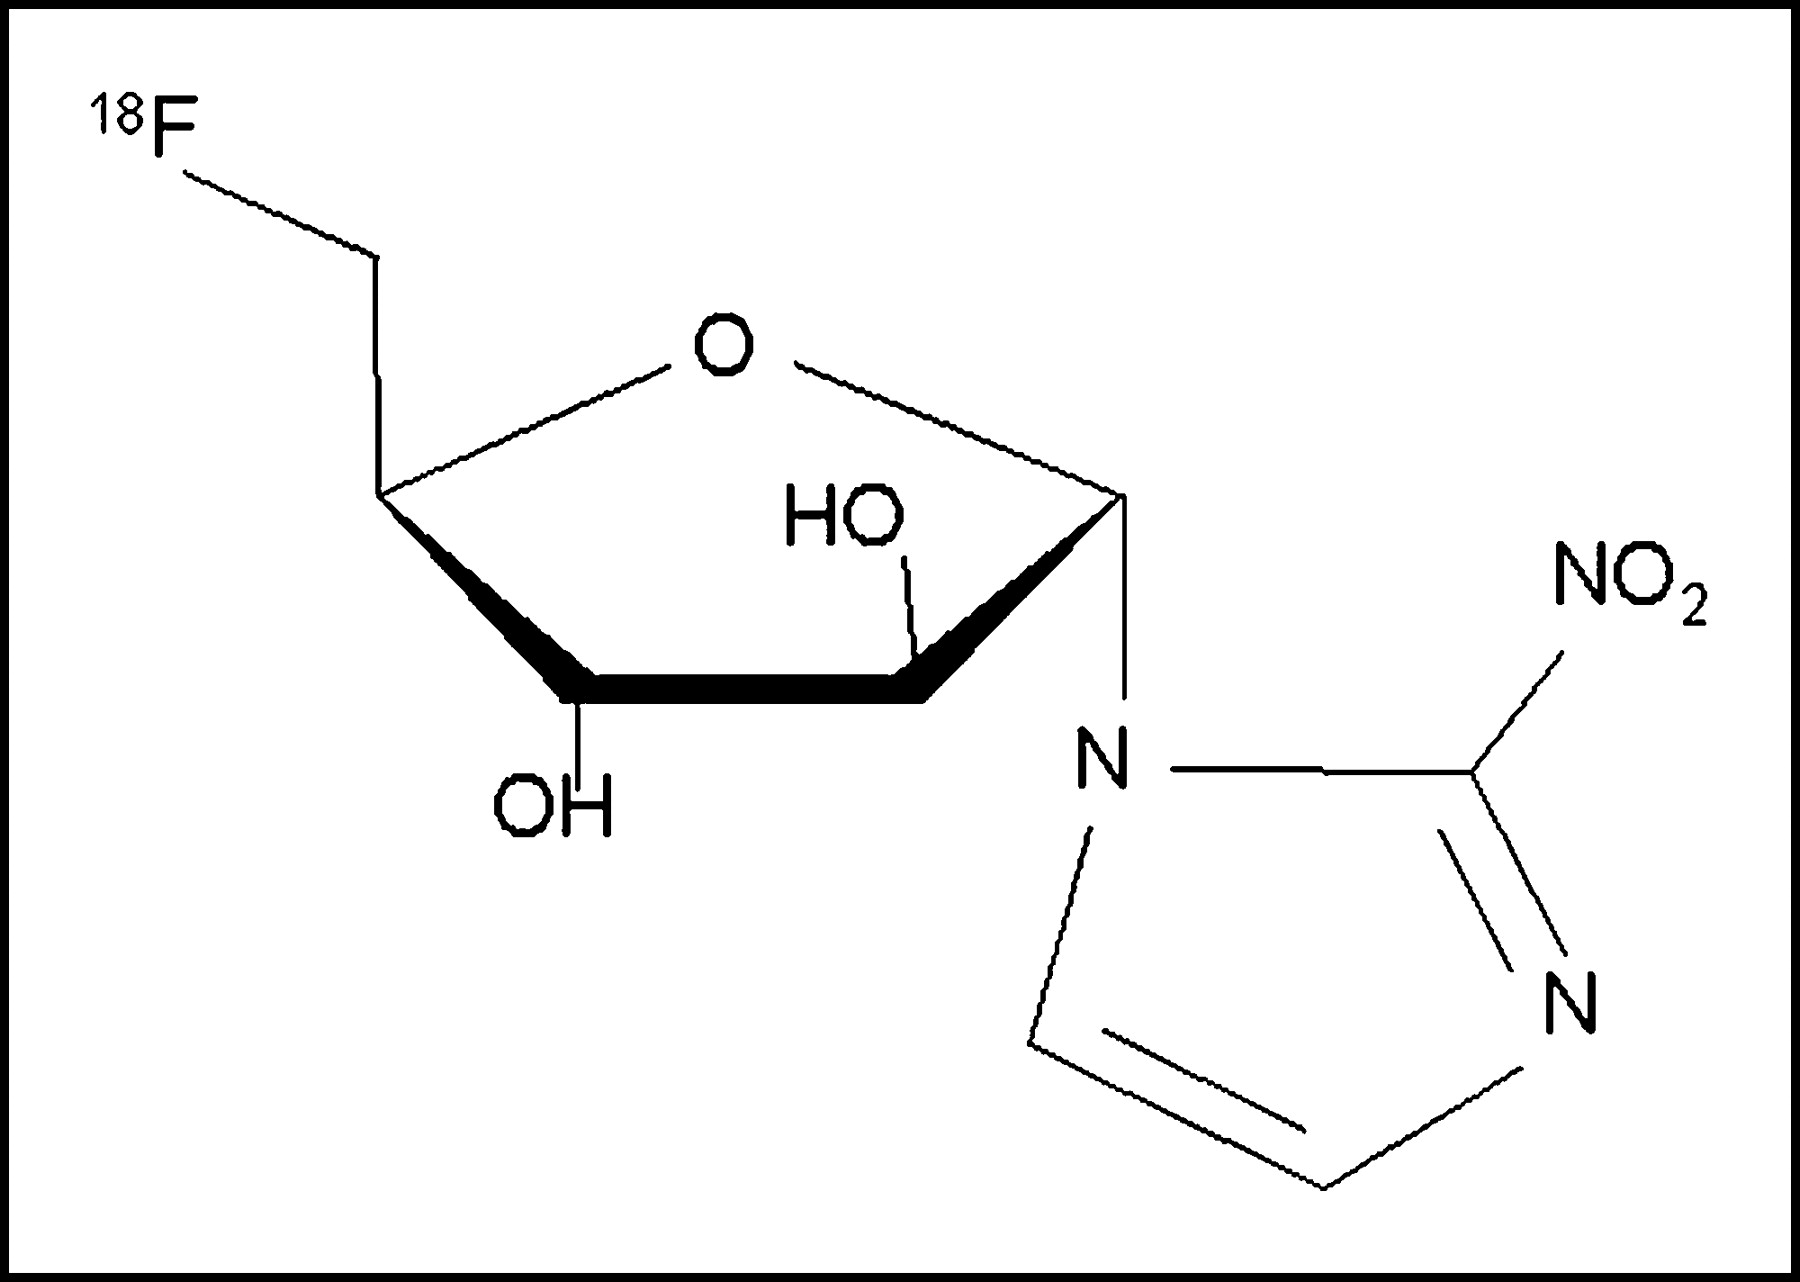
Chemical structure of 18F-fluoroazomycin arabinoside (18F-FAZA). Nucleoside analog contains nitroimidazole ring in α-position of arabinose ring.
MATERIALS AND METHODS
Tracer Synthesis
18F-FMISO was synthesized as described previously (27). The synthesis of 18F-FAZA was performed as follows (28): 5 mg of the precursor 1-(2,3-diacetyl-5-tosyl-α-d-arabinofuranosyl)-2-nitroimidazole in 1 mL of dimethyl sulfoxide were reacted with a mixture of azeotropically dried 18F-fluoride, 15 mg of Kryptofix 2.2.2. (Merck), and 3.5 mg of K2CO3 at 100°C for 5 min. After hydrolysis with 1 mL of 0.1N NaOH (2 min, 30°C), 0.5 mL of 0.4N NaH2PO4 was added for neutralization. The product was purified first using an alumina cartridge (Alu N light; Waters) and then high-performance liquid chromatography (HPLC) (Phenomenex Nucleosil C18; ethanol/NaH2PO4 buffer [5:95]; flow, 4 mL/min; detection ultraviolet [320 nm], NaI(Tl)). The product was obtained in radiochemical yields of 20.7% ± 3.5% (n = 12) at end of the beam. After irradiations of 1 h at 35 μA, 9.1 ± 1.4 GBq (n = 8) 18F-FAZA were isolated.
In Vivo Experiments
All animal experiments were conducted in compliance with the guidelines for the care and use of research animals established by the Animal Research Committee at the Technische Universität München. For biodistribution studies, 13 female BALB/c mice (20–25 g) were inoculated subcutaneously at the back of the thorax with a suspension of EMT6 cells (2.5 × 10⁵ cells in 0.1 mL), a murine mammary carcinoma cell line (29), which reached the desired size of approximately 5- to 10-mm diameter in 5–8 d. Similarly, Swiss nude mice (20–23 g) were inoculated subcutaneously with a suspension of AR42J cells (30), a pancreatic acinar cell tumor, or A431 cells, a human vulva carcinoma cell line, which reached the desired tumor size of approximately 5- to 10-mm diameter after 14–21 d.
For PET studies, 13 female Swiss nude mice (20–23 g) were injected intravenously with 18F-FAZA tracer while sedated with ether. Two hours after tracer injection, PET studies were performed on anesthetized animals.
For autoradiography studies, 8 female Swiss nude mice (20–23 g) received subcutaneous xenograft implants using a tumor derived from a suspension of EMT6 cells (2.5 × 10⁵ cells in 0.1 mL), obtaining 17 tumors of approximately 5- to 10-mm diameter at the thorax. Also, in 2 animals bearing AR42J tumors, whole-body 18F-FAZA autoradiography was performed.
Tumor Tissue Oxygenation Electrode Measurements
The presence of tumor tissue hypoxia was verified by direct tissue partial pressure of oxygen (tissue Po2) electrode measurements in 5 AR42J and 5 EMT6 tumors with their respective reference tissues (lower leg muscles) using a commercially available polarographic oxygen sensor system (PO2-Histograph model 6650; Eppendorf). These animals were not subjected to imaging studies. Measurements were obtained in anesthetized animals bearing tumors of the same size range as used for imaging studies (EMT6 tumors, 0.9 ± 0.2 g; AR42J tumors, 0.8 ± 0.2 g). After inserting the tip of the oxygen sensor below the surface of the tumor and allowed it to equilibrate, 6 tracks were measured (tracks averaged 6 mm in length), resulting in 120 single Po2 measurements per tumor. Measurements were taken after moving the needle forward automatically in 0.5-mm steps (a rapid forward movement of 0.7 mm was followed by a backward movement of 0.2 mm to minimize compression effects caused by forward motion of the needle). The results are expressed as the geometric mean and the 95% confidence limits of each tissue histogram. Individual Po2 results were then pooled into frequency histograms summarizing the measurements for each tumor model as percentages of relative frequency of the tissue Po2 in mm Hg.
Biodistribution Studies
Biodistribution studies were performed in EMT6 tumor-bearing BALB/c mice and AR42J and AR431 Swiss nude mice. After intravenous injection of either 18F-FMISO or 18F-FAZA, mice were awake until sacrifice. Animals were euthanized in CO2 gas and rapidly dissected 10, 60, and 180 min after dosing with either 18F-FMISO or 18F-FAZA by intravenous injection. Biodistribution measurements were evaluated in all tumors and in various organs, including blood, heart, lung, liver, spleen, kidney, brain, muscle, bone, skin, stomach, small intestine, and large intestine. The selected tissues and organs were harvested and weighed. HPLC (RP-18, gradient H2O/ethanol) and thin-layer chromatography (TLC) (silica gel, ethyl acetate) were performed to analyze radioactivity in urine. The tumor-to-blood ratio (T/Bl ratio) and tumor-to-muscle ratio (T/M ratio) were considered for statistical analysis. The radioactivity in the tissue was measured using a γ-counter (1480 Wizard automatic γ-counter; Wallac OY). Results are expressed as the percentage of injected dose per gram of tissue (%ID/g).
Animal PET
To determine the hypoxia specificity of the 18F-FAZA uptake, serial small animal PET was performed using the Munich prototype animal PET scanner (MADPET) (31). The experiments were performed in 13 A431 tumor-bearing Swiss nude mice, randomly selecting whether they breathed pure oxygen (100% O2) or room air (21% O2) during the first day and selecting the other atmosphere on the following day. Animals breathing oxygen were kept in a custom-built acrylic container, flushed with pure oxygen (5 L/min), beginning 1 h before tracer injection and continuing to the end of the PET study. Except for a period of approximately 1–3 min for tracer injection (ether sedation), the oxygen atmosphere was never compromised.
Two hours after intravenous injection of ∼20 MBq 18F-FAZA, animals were anesthetized and positioned prone inside the animal PET tomograph. PET studies were performed on anesthetized animals (intraperitoneal injection of ketamine, 70 mg/kg [Pharmacia], and xylazine, 7 mg/kg [Bayer]).
The animal PET scanner has a reconstructed image resolution of 2.5 mm (full width at half maximum) in a transaxial field of view of 75 mm and a slice thickness of 2 mm (32). Depending on the tumor size, 2–6 transaxial slices through the tumor region (∼10 min per slice) were measured.
PET Data Analysis
After correction for dead time and random coincidences, PET data were reconstructed using a statistical reconstruction method (ordered-subset expectation maximization) including a scanner-specific system response matrix based on Monte Carlo simulation of the complete system (33). Standardized regions of interest (ROIs) were placed over the maximum activity in the tumor in 18F-FAZA-PET images. The slice with the highest radioactivity concentration within the tumor was visually identified and a circular ROI with a diameter of 5 mm was automatically placed in the area with the maximum activity concentration, corresponding to the tumor. An additional circular ROI with a diameter of 15 mm was placed in the adjacent background of the animal thorax as the reference.
Assessment of tracer distribution in tumor tissue was expressed as the T/Bk ratio, dividing the mean activity within the ROI of the tumor by the mean activity within the background ROI.
Autoradiography
18F-FAZA autoradiography studies were performed in 17 EMT6 tumors and corresponding muscle tissue as the reference. The animals were either breathing room air (8 tumors) or carbogen (95% O2 and 5% CO2) (9 tumors) until sacrifice 3 h after 18F-FAZA injection. The tissues were quickly frozen (−70°C) and cut into 20-μm sections (Cryo Polycut; Leica). Radioactivity was determined 4–5 h after injection using a Phosphor Imager 445 SI (Molecular Dynamics, Amersham). Distribution of radioactivity in tumor and in muscle was calculated using eliptic ROIs. T/M ratios from mice breathing room air or carbogen were compared quantitatively.
In addition, to visualize the whole-body distribution of 18F-FAZA activity in 2 mice bearing AR42J tumors, whole-body autoradiography was performed. After sacrifice, animals were quickly frozen (−70°C) and cut into 20-μm sections (Crystat Microtome CM 3500; Leica). Radioactivity was determined 4–5 h after injection using the same Phosphor Imager as used for selective autoradiography.
Statistics
Results are expressed as mean values of parameters ± SD. Parameters were compared by means of 1-way ANOVA, including tests for homogeneity of group variances using the Bartlett test, selecting a conservative significance level of P ≥ 0.1. In case of inhomogeneous group variances, data were compared using a t test. If variances were not equally distributed, group differences were assessed using the Wilcoxon rank sign test. Parameters were correlated using a nonparametric test (Spearman rank correlation). P < 0.05 was considered statistically significant. Statistical tests were performed with the JMP version 3.2 statistical software package (SAS).
RESULTS
Biodistribution Studies
The time course of 18F-FAZA tissue uptake was investigated in AR42J tumor-bearing Swiss nude mice at 10, 60, and 180 min after tracer injection and compared with the 18F-FMISO uptake at 180 min after injection (Table 1). Radioactivity from 18F-FAZA decreased over time in every tissue investigated. The highest decrease in radioactivity was found in blood (−93 %ID/g, from 10 to 180 min), whereas the reduction in radioactivity was lowest in tumor tissue (−42 %ID/g) and brain (−30 %ID/g). Therefore, the T/Bl ratio increased 12.4-fold and the T/M ratio increased 7.6-fold between 10 and 180 min after injection, indicating that the optimal time for imaging studies should be as late as possible after tracer injection. Radioactivity in the liver and kidney decreased over time as well, suggesting a rapid elimination of 18F-FAZA and metabolites via renal excretion and hepatic metabolism. Urine could be collected up to 60 min after injection in 3 nude mice. Radioactivity was found to be higher than 100 %ID/g urine. HPLC and TLC analyses revealed that at 10 min after injection ∼90% (n = 2) of activity and at 60 min after injection ∼73% (n = 1) of activity were due to unchanged 18F-FAZA.
Biodistribution (%ID/g) at 180 Minutes of 18F-FMISO and at 10, 60, and 180 Minutes of 18F-FAZA in Swiss Nude Mice Bearing AR42J Tumor
Besides urine, the highest radioactivity was found in the content of large intestine (21.6% ± 13.7 %ID/g). Accordingly, radioactivity in the small and large bowel was higher compared with other abdominal organs (spleen, stomach) and extraabdominal organs (i.e., heart, lung). Because the T/Bl ratio increased with time, biodistribution studies comparing 18F-FMISO and 18F-FAZA uptake were performed 3 h after tracer injection. In the 3 different tumor models investigated (EMT6 BALB/c mice, AR42J and A431 Swiss nude mice), 18F-FAZA exhibited a significantly lower uptake in most organs, including liver and kidney, and a much faster clearance from the blood compared with 18F-FMISO. In contrast, tumor uptake was not significantly different between both tracers in 2 of the 3 tumor models investigated. That resulted in favorable T/Bl ratio and tumor-to-organ ratios for imaging purposes (Tables 1–3).
Biodistribution (%ID/g) at 180 Minutes of 18F-FMISO and 18F-FAZA in BALB/c Mice Bearing EMT6 Tumor
Biodistribution (%ID/g) at 180 Minutes of 18F-FMISO and 18F-FAZA in Swiss Nude Mice Bearing A431 Tumor
Tumor Tissue Oxygenation Electrode Measurements
Tissue Po2 measurements revealed that tumor hypoxia was present in EMT6 (tissue Po2, 2.9 ± 2.6; n = 5) and AR42J tumors (tissue Po2, 0.4 ± 0.2; n = 5). The tumor tissue oxygenation was significantly lower compared with that of lower leg muscle tissue (tissue Po2: BALB/c mice, 25.8 ± 6.7; and nude mice, 29.0 ± 3.0, respectively; P < 0.01).
Animal PET
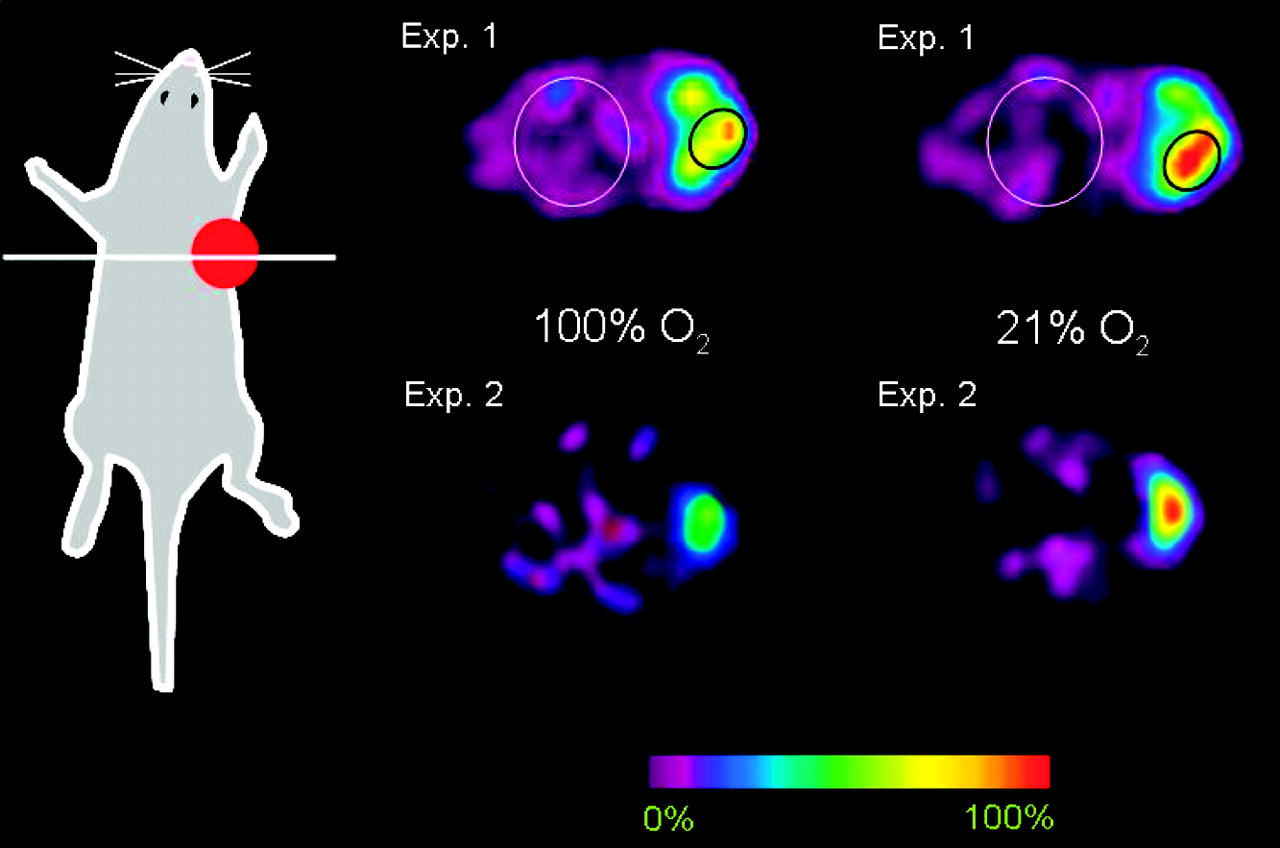
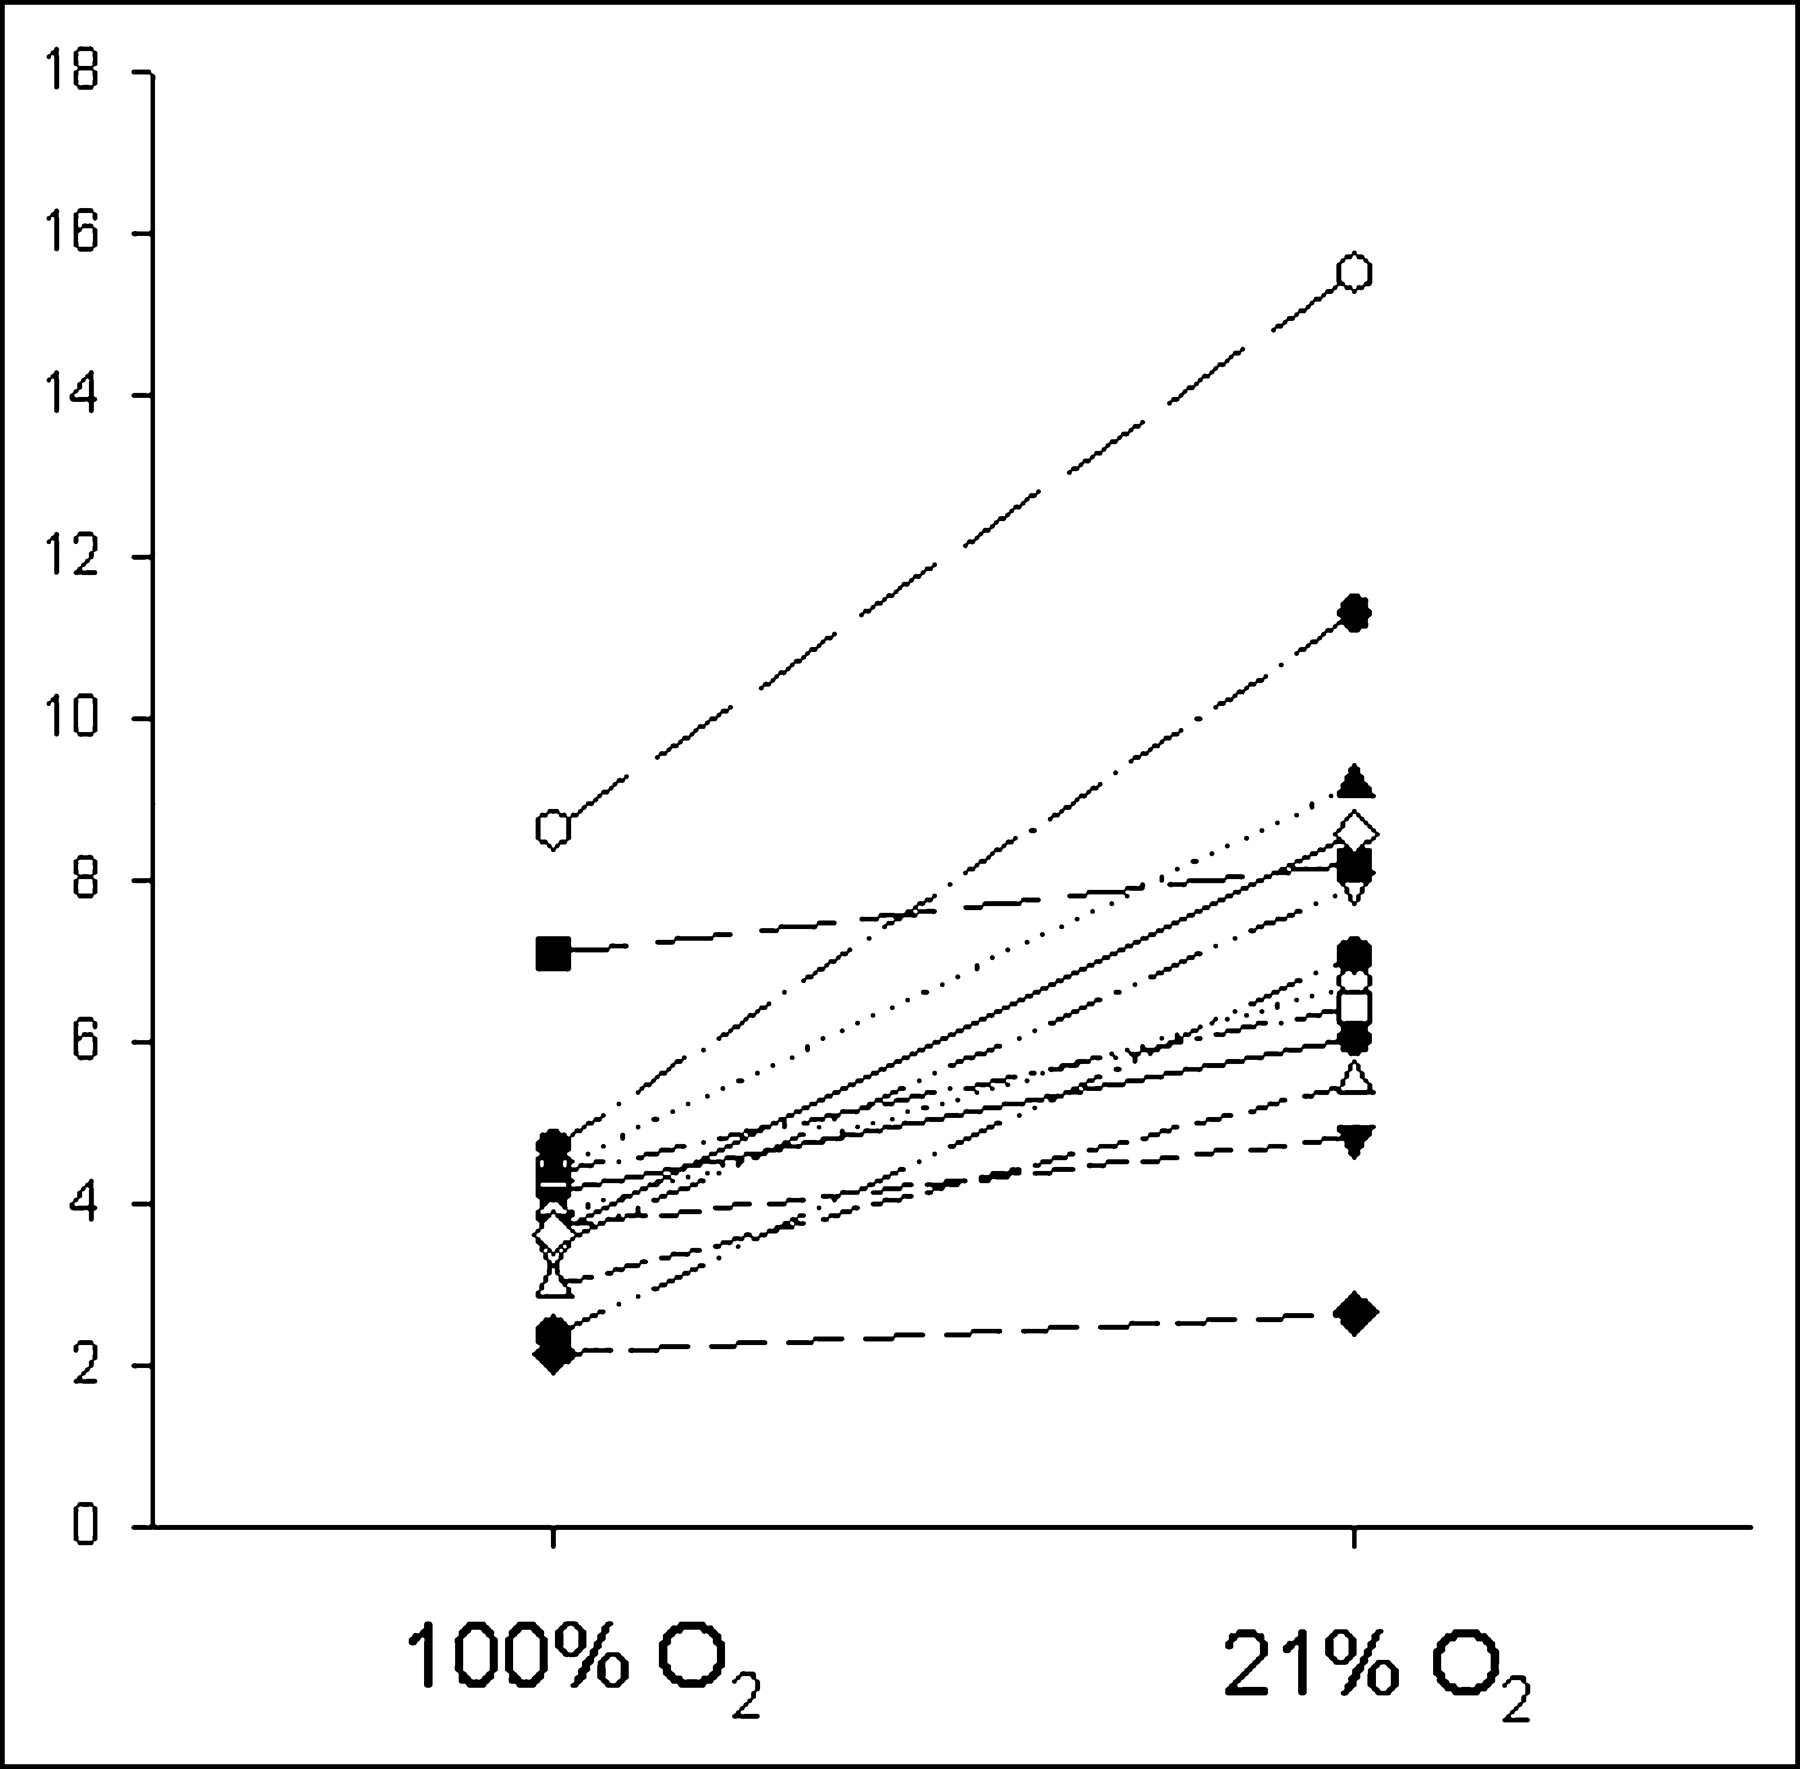
In all 18F-FAZA-PET images obtained from A431 tumor-bearing Swiss nude mice, tracer uptake was clearly visible in the tumor. Serial 18F-FAZA-PET scans were performed in 13 A431 tumor-bearing Swiss nude mice that breathed 2 different atmospheres (21% O2 and 100% O2). Figure 2 shows 2 representative animals with their consecutive PET scans. In all PET studies, the T/Bk ratio was significantly elevated in mice breathing room air compared with that of those breathing pure oxygen (T/Bk ratio: 7.3 ± 2.3 and 4.2 ± 1.2, respectively; P < 0.001) (Fig. 3).

Typical serial transaxial small animal 18F-FAZA PET scans of 2 Swiss nude mice bearing subcutaneous A431 tumors at right side of thorax. Note decreased tracer uptake after breathing 100% O2 for 8 h. ROI analyses, as shown in experiment 1 (Exp. 1), revealed that the mean T/Bk ratio decreased from 4.7:1 (breathing room air) to 3.7:1 (breathing 100% O2) in experiment 1 and from 11.3:1 to 5.4:1 in experiment 2 (Exp. 2), respectively.

T/Bk ratio of 18F-FAZA (y-axis) in 13 Swiss nude mice bearing A431 tumor using serial MADPET studies with and without oxygen breathing. Animals breathing oxygen on the first day are displayed with open symbols, whereas animals breathing room air on the first day are shown with filled symbols.
Immediately after the second PET scan, the animals were sacrificed and the radioactivity in tissues was determined. Like the T/Bk ratio, the mean T/M ratio was higher in mice breathing 21% O2 than that in mice breathing 100% O2 (7.81 ± 0.94 and 4.40 ± 0.86, respectively; P < 0.001).
PET measurements were confirmed comparing the T/Bk ratio derived from PET with the T/M ratio derived from direct tissue assays. Figure 4 shows the relationship between the T/M and T/Bk ratios. Regression analysis revealed a significant linear correlation between both measurements (regression line y = 0.89 + 0.75x; adjusted r2 = 0.57; P < 0.01; dotted lines, 95% confidence intervals).
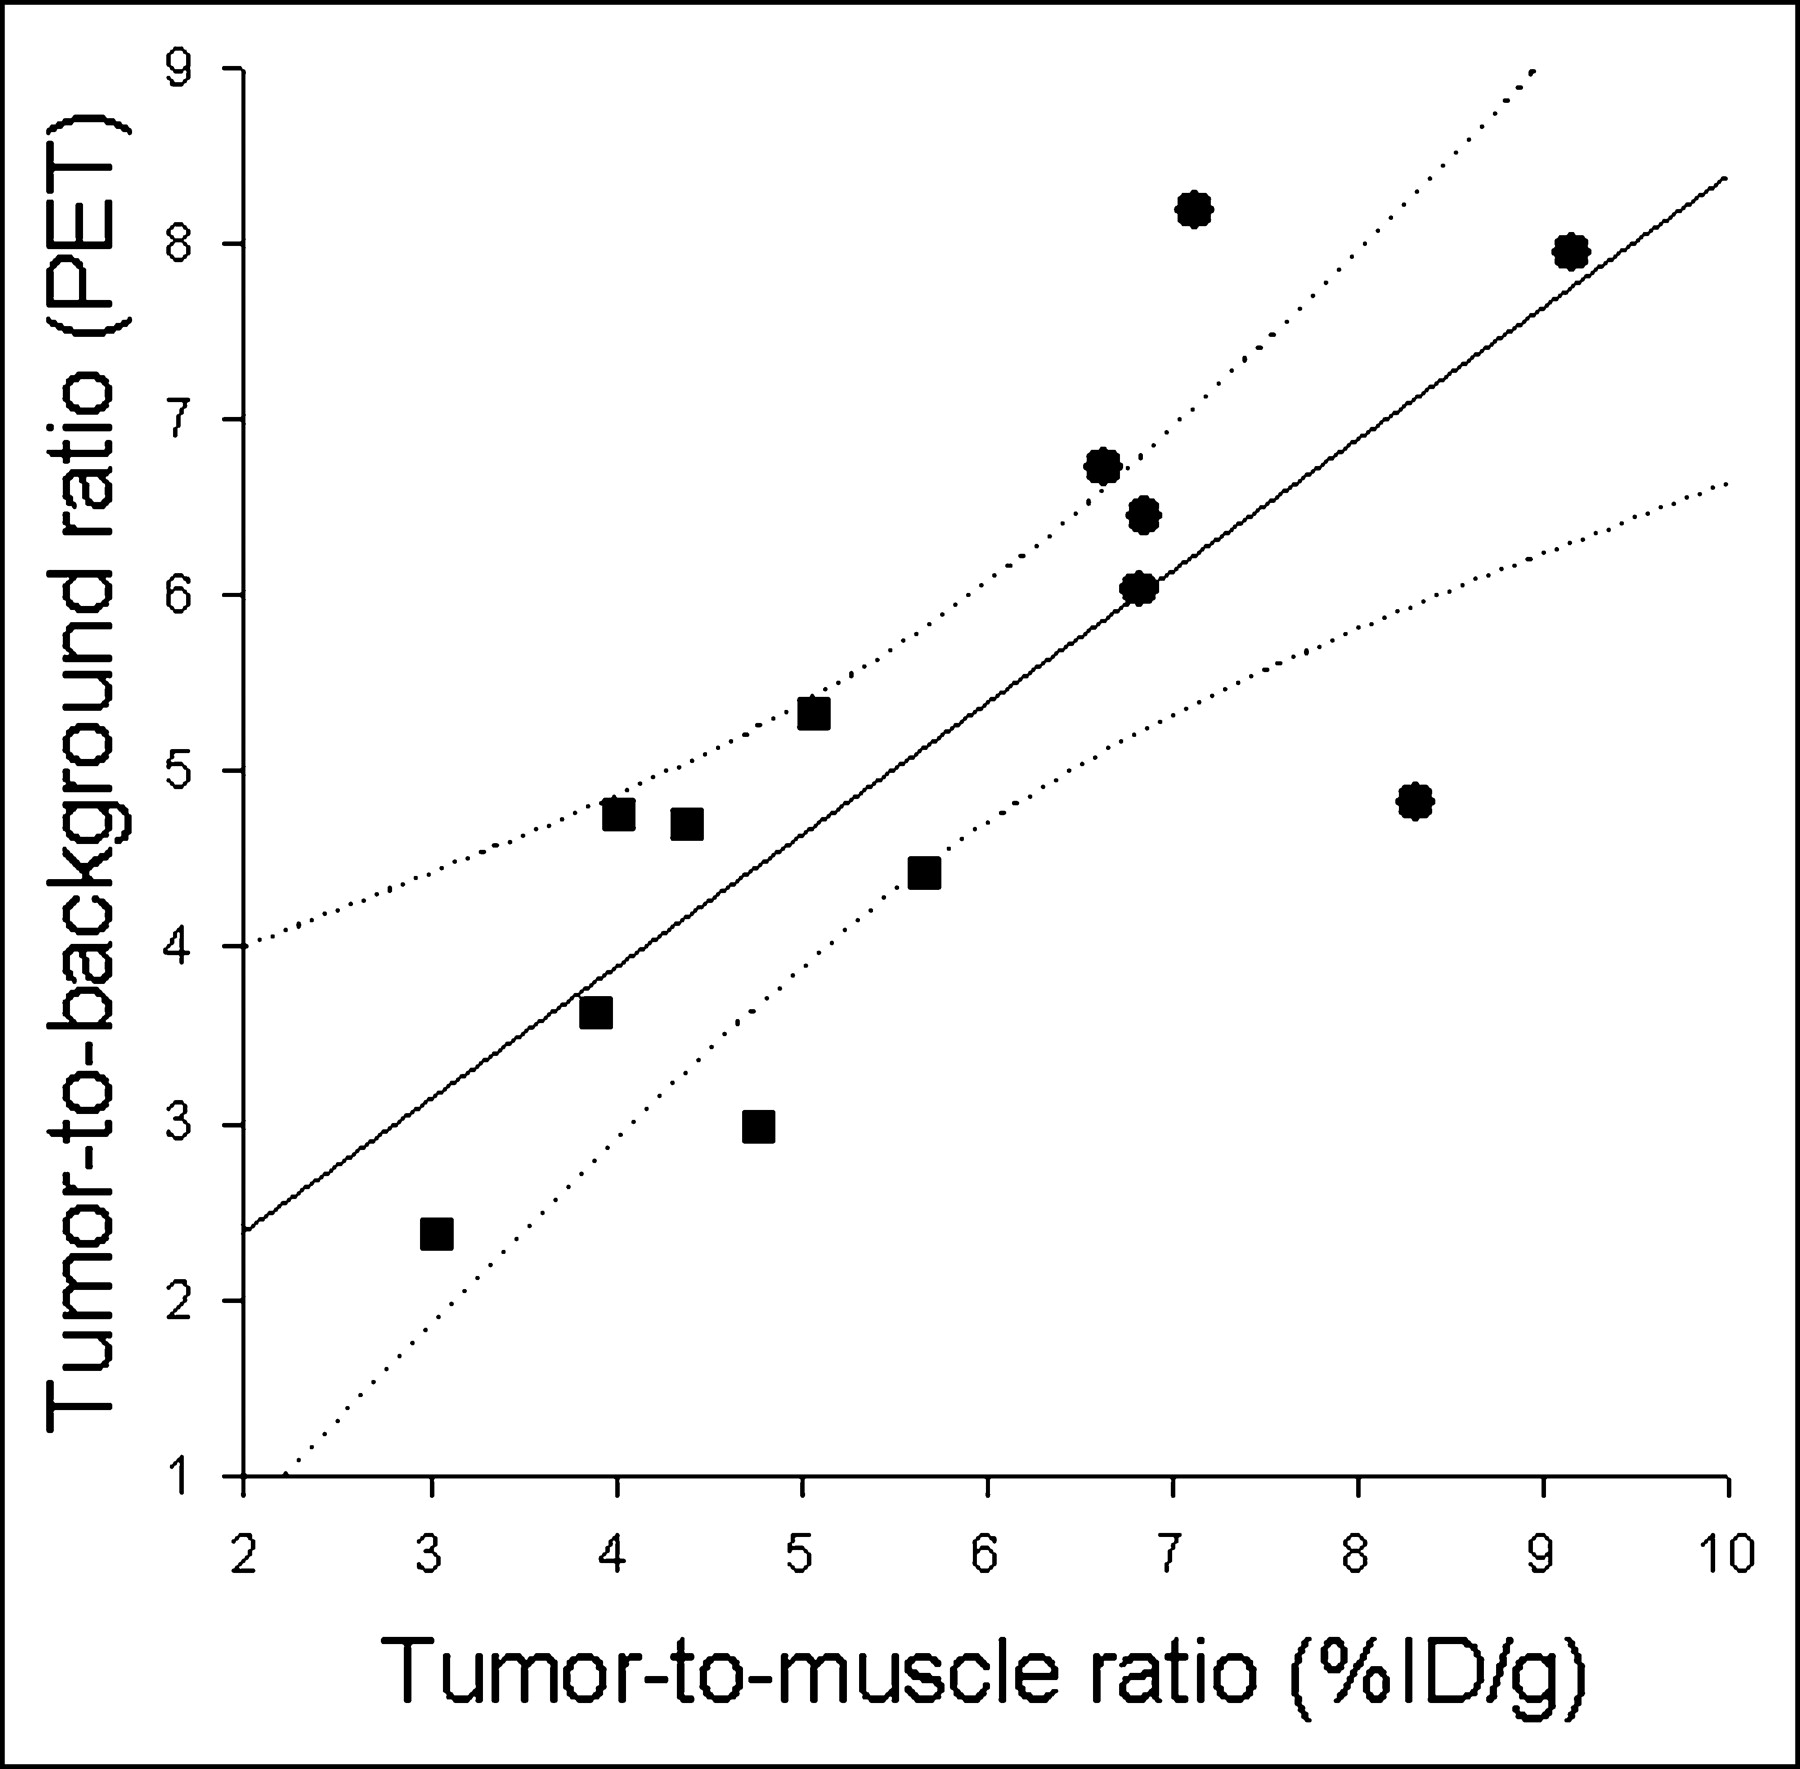
Relationship of T/M ratio derived from biodistribution studies and T/Bk ratio of small animal PET studies. PET measurements were performed 150–180 min after injection of ∼10 MBq 18F-FAZA into Swiss nude mice bearing A431 tumor. During scanning, animals breathed either room air (circles) or 100% oxygen (squares). Regression analysis revealed a significant linear correlation between both measurements (regression line y = 0.89 + 0.75x; adjusted r2 = 0.57; P < 0.01; dotted lines, 95% confidence intervals).
Autoradiography
Whole-body distribution of 18F-FAZA was evaluated by whole-body autoradiography from AR42J tumor-bearing nude Swiss mice (Fig. 5). The distribution of radioactivity derived from 18F-FAZA administration is low and homogeneous in all organs except for tumor, where the activity is high and nonhomogenously distributed, and in abdomen, where areas of focal increased uptake of tracer are evident as content of large intestine.

Digital autoradiographic image of radioactivity 3 h after 18F-FAZA administration (20-μm slice thickness).
The T/M ratio after 18F-FAZA administration was determined using phosphor imaging with 9 EMT6 tumors taken from animals breathing 21% O2 and 9 tumors from animals breathing carbogen. The distribution of radioactivity within tumors was fairly inhomogeneous. Additional hematoxylin-eosin staining revealed that the inhomogeneity of radioactivity within the tumor was not related to extensive tissue necrosis. Similarly, autoradiography showed significantly higher T/M ratios in mice breathing room air compared with those of mice breathing carbogen (5.3 ± 0.8 and 2.2 ± 0.8; P < 0.02, respectively).
DISCUSSION
Nitroimidazoles are reduced within oxygen-deficient viable cells and retained at rates inversely proportional to the intracellular oxygen concentration (14). The use of radioiodinated (12) and radiofluorinated (13) nitroimidazoles to visualize various malignant tumors in animal and humans has been reviewed. 18F-FMISO is a lipophilic compound with an octanol:water partition coefficient of log P = 2.6, with favorable chemical and physicochemical properties and an appropriate reduction potential of E = −389 mV. Therefore, 18F-FMISO diffuses into cells and can be reductively retained in hypoxic cells (34). Nevertheless, 18F-FMISO has a relatively long plasma clearance half-life, so that the signal-to-noise ratio obtained in PET images is relatively small. Therefore, considerable effort has been made to develop nitroimidazoles with either increased specific tumor uptake or faster clearance. 18F-FAZA, developed to undergo more rapid clearance than 18F-FMISO, was introduced to image tumor tissue hypoxia with PET (36).
Compared with 18F-FMISO, 18F-FAZA displays a lower octanol:water partition coefficient (log P = 1.1), indicating the potential for both rapid diffusion through tissue and faster renal excretion (35). In addition, the significantly lower T/Bl ratio resulting from 18F-FAZA administration, which is related to either renal or hepatobiliary excretion, leads to a lower radiation burden and to a favorable imaging result compared with 18F-FMISO. In contrast, Sorger et al. found that 18F-FMISO displayed a slightly higher T/Bk ratio compared with 18F-FAZA in a Walker 256 rat sarcoma model (36). These conflicting results might be explained by species-related differences as well as the fact that this study was conducted with large, partially necrotic tumors, making direct comparison with the current study difficult.
We verified tumor tissue hypoxia using oxygen electrode measurements in 2 of the 3 investigated animal models (EMT6/BALB/c and AR42J/nude mice). Although this device has been established as the gold standard for tissue Po2 measurements in humans and large animals (5,20), it is of limited value in small animal models. The needle electrode is moved forward stepwise by a motor, advancing the tip of the probe through the tumor tissue, thus avoiding compression artifacts and performing measurements throughout a sector of tumor tissue. During measurement, the exact location of the probe’s tip cannot be monitored. Therefore, measurements from the rim of tumors are difficult to perform and the results may include Po2 values obtained from necrotic areas within the tumor tissue. In addition, tumors are traumatized by this invasive procedure, prohibiting repeated measurements. Also, at the time of Po2 measurement, certain anesthetics and sedation procedures may have profound effects on invasive probe measurements (37), whereas radionuclide investigations allow animals to metabolize after tracer delivery until imaging or sacrifice. These limitations may explain the generally poor correlation between hypoxia tracer uptake and tissue Po2 measurements in unperturbed animals (38). Considering these limitations for this study, Po2 measurements were not performed in animals undergoing further imaging.
In the present study, the oxygen dependency of 18F-FAZA uptake has been demonstrated not only by serial small animal PET but also by biodistribution and autoradiographic studies under different oxygen conditions and in different tumor models. In the autoradiographic study, a carbogen atmosphere, rather than pure oxygen, was used to counteract possible constricting effects of pure oxygen on the microvasculature. In serial PET studies, potential influences of tumor growth on tumor tissue oxygenation were avoided by randomly alternating the atmosphere breathed by test animals (e.g., first oxygen, then air the following day, or vice versa). One could argue that vasoconstriction due to breathing pure oxygen may have caused the observed effects on 18F-FAZA uptake in A431 tumors. Nevertheless, we can assume that tumor and normal tissues were subjected to possible vasoconstrictive effects to a similar degree. Therefore, vasoconstrictive effects of the oxygen atmosphere should not have greatly influenced our measurements, because only the ratio of tumor-to-reference tissue was used to describe 18F-FAZA retention. Also, a comparable reduction of the 18F-FAZA uptake was observed in autoradiographic studies using carbogen instead of pure oxygen.
Several important preconditions have to be met by bioreductive tracers to be useful for hypoxia imaging. Especially important are (a) the amount of tracer delivered, (b) the time course of tracer transport throughout the tumor and across the tumor cell membrane, (c) the specific tissue retention mechanism, (d) the amount of unspecific metabolites in the circulation, and (e) the rate of excretion. These parameters mainly influence the target-to-background ratio that ultimately determines the ability to detect tissue hypoxia (sensitivity) and the range of oxygen concentration that defines the radiobiologic oxygen effect—in other words, the prediction of tumor response to therapy (specificity). The fact that tissue hypoxia is generally related to a significant decrease in tissue perfusion is unfortunate for imaging purposes. Therefore, tracer delivery can be critically impaired due to decreased blood flow. It has been shown that the reduction of blood flow below 10% of normal values critically reduces tracer delivery (11). However, it has been reported that 125I-IAZA, which is more lipophilic than 18F-FAZA, undergoes perfusion into areas not delineated by the perfusion marker 99mTc-hexamethylpropyleneamine oxime in an animal stroke model, indicating good penetration into poorly perfused tissue (39). In this model, 125I-IAZA uptake became visible at a threshold blood flow of 34%. Magnetic resonance-derived apparent diffusion coefficient maps identified 4 distinct regions, of which the region with the lowest apparent diffusion coefficient correlated with the highest 125I-IAZA uptake. Clearly, hypoxia tracers can be used successfully only as long as tracer delivery to tissue is maintained; thus, it is important to have a highly diffusible tracer with little tendency to partition into lipophilic membranes or adipose tissue. The tracer should easily cross the blood capillary membrane, preferably without using membrane transporter systems, which otherwise might complicate the interpretation of tracer studies. Most importantly, an oxygen-specific retention mechanism should determine the amount of tracer that is temporarily or permanently trapped in hypoxic tissues. This implies that only viable cells that are hypoxic will retain hypoxia tracers. Ideally, labeled metabolites of hypoxia tracers should not be found in the circulation at the time of imaging. None of the present hypoxia tracers available completely meets all these preconditions.
CONCLUSION
Tumor uptake of 18F-FAZA correlated inversely with oxygen concentration as determined by electrode measurements of tumor hypoxia in murine EMT6 and AR42J tumors in vivo. This inverse correlation was verified in an experimental model in which animals breathed either normal air or high oxygen atmospheres. 18F-FAZA delineated tumor hypoxia in imaging using the Munich prototype PET scanner and autoradiographic studies and provided images with strong contrast. In addition, 18F-FAZA produced higher T/Bk ratios compared with those of 18F-FMISO in biodistribution studies. Improved imaging properties of 18F-FAZA are ascribed to its more rapid clearance from blood and nontarget tissues. On this basis, 18F-FAZA is recommended for further preclinical and clinical study to enhance therapeutic strategies for improving tumor tissue oxygenation (i.e., carbogen treatment, hyperbaric oxygen), to specifically target the hypoxic subvolume of tumors (intensity-modulated radiotherapy), or to take advantage of the intratumoral lack of oxygen using hypoxia-directed chemotherapies (i.e., tirapazamine).
Acknowledgments
The authors thank all members of the PET facility for their excellent and extensive support. This study was supported by Deutsche Forschungsgemeinschaft grant Pi 242/3-1 and MA 1096/5-1.
Footnotes
Received Apr. 9, 2004; revision accepted Aug. 12, 2004.
For correspondence contact: Morand Piert, MD, Division of Nuclear Medicine, Department of Radiology, University of Michigan Health System, University Hospital B1G505C, 1500 E. Medical Center Dr., Ann Arbor, MI 48109-0028.
E-mail: mpiert{at}umich.edu
REFERENCES
In this issue


Jump to section
Related Articles
Cited By...
- Concomitant [18F]F-FAZA and [18F]F-FDG Imaging of Gynecological Cancer Xenografts: Insight into Tumor Hypoxia
- GdDO3NI allows imaging of hypoxia after brain injury
- First Evaluation of PET-Based Human Biodistribution and Dosimetry of 18F-FAZA, a Tracer for Imaging Tumor Hypoxia
- In Vivo Hypoxia PET Imaging Quantifies the Severity of Arthritic Joint Inflammation in Line with Overexpression of Hypoxia-Inducible Factor and Enhanced Reactive Oxygen Species Generation
- 18F-FAZA PET Imaging Response Tracks the Reoxygenation of Tumors in Mice upon Treatment with the Mitochondrial Complex I Inhibitor BAY 87-2243
- Comparison of 18F-Fluoroazomycin-Arabinofuranoside and 64Cu-Diacetyl-Bis(N4-Methylthiosemicarbazone) in Preclinical Models of Cancer
- Prognostic and Predictive Significance of Plasma HGF and IL-8 in a Phase III Trial of Chemoradiation with or without Tirapazamine in Locoregionally Advanced Head and Neck Cancer
- Preclinical evaluation and validation of [18F]HX4, a promising hypoxia marker for PET imaging
- Location, Location, Location-Makes All the Difference for Hypoxia in Lung Tumors
- Hypoxia in Models of Lung Cancer: Implications for Targeted Therapeutics
- Quantitative Assessment of Hypoxia Kinetic Models by a Cross-Study of Dynamic 18F-FAZA and 15O-H2O in Patients with Head and Neck Tumors
- Pharmacologically Increased Tumor Hypoxia Can Be Measured by 18F-Fluoroazomycin Arabinoside Positron Emission Tomography and Enhances Tumor Response to Hypoxic Cytotoxin PR-104
- Radiopharmaceuticals in Preclinical and Clinical Development for Monitoring of Therapy with PET
- Reply: Intratumoral Spatial Distribution of Hypoxia and Angiogenesis Assessed by 18F-FAZA and 125I-Gluco-RGD Autoradiography
- Molecular Imaging of Hypoxia
- Molecular Imaging of Metastatic Potential
- Applications of Nitroimidazole In Vivo Hypoxia Imaging in Ischemic Stroke
- Correlative Imaging of Hypoxia and Angiogenesis in Oncology
- Intratumoral Spatial Distribution of Hypoxia and Angiogenesis Assessed by 18F-FAZA and 125I-Gluco-RGD Autoradiography
- Nuclear Imaging Probes: from Bench to Bedside
- Pretreatment 18F-FAZA PET Predicts Success of Hypoxia-Directed Radiochemotherapy Using Tirapazamine
- Experience of PET for target localisation in radiation oncology
- Modulation of intratumoral hypoxia by the epidermal growth factor receptor inhibitor gefitinib detected using small animal PET imaging