


Abstract
Hypoxia is essential for the development of autoimmune diseases such as rheumatoid arthritis (RA) and is associated with the expression of reactive oxygen species (ROS), because of the enhanced infiltration of immune cells. The aim of this study was to demonstrate the feasibility of measuring hypoxia noninvasively in vivo in arthritic ankles with PET/MRI using the hypoxia tracers 18F-fluoromisonidazole (18F-FMISO) and 18F-fluoroazomycinarabinoside (18F-FAZA). Additionally, we quantified the temporal dynamics of hypoxia and ROS stress using L-012, an ROS-sensitive chemiluminescence optical imaging probe, and analyzed the expression of hypoxia-inducible factors (HIFs). Methods: Mice underwent noninvasive in vivo PET/MRI to measure hypoxia or optical imaging to analyze ROS expression. Additionally, we performed ex vivo pimonidazole-/HIF-1α immunohistochemistry and HIF-1α/2α Western blot/messenger RNA analysis of inflamed and healthy ankles to confirm our in vivo results. Results: Mice diseased from experimental RA exhibited a 3-fold enhancement in hypoxia tracer uptake, even in the early disease stages, and a 45-fold elevation in ROS expression in inflamed ankles compared with the ankles of healthy controls. We further found strong correlations of our noninvasive in vivo hypoxia PET data with pimonidazole and expression of HIF-1α in arthritic ankles. The strongest hypoxia tracer uptake was observed as soon as day 3, whereas the most pronounced ROS stress was evident on day 6 after the onset of experimental RA, indicating that tissue hypoxia can precede ROS stress in RA. Conclusion: Collectively, for the first time to our knowledge, we have demonstrated that the noninvasive measurement of hypoxia in inflammation using 18F-FAZA and 18F-FMISO PET imaging represents a promising new tool for uncovering and monitoring rheumatic inflammation in vivo. Further, because hypoxic inflamed tissues are associated with the overexpression of HIFs, specific inhibition of HIFs might represent a new powerful treatment strategy.
Rheumatoid arthritis (RA) is one of the most common autoimmune diseases, with a prevalence of 0.5%–1% in the Western world population (1). RA is a common cause of permanent disability and is characterized by chronic inflammation of the synovial tissues associated with a dense leukocytic infiltrate, angiogenesis, pannus formation, and ultimately cartilage and bone destruction (2).
We recently demonstrated that 18F-galacto-RGD PET imaging was applicable to the early detection of angiogenesis in experimental glucose-6-phosphate-isomerase (GPI)–induced arthritis (3). Interestingly, enhanced αvβ3 integrin activity in the synovial vasculature of arthritic joints is associated with the onset of hypoxia (4).
In addition, hypoxia induces the formation of the transcription factors HIFs (hypoxia-inducible factors), which trigger an upregulation of proangiogenic factors and mediators involved in glycolysis (4). The HIF pathway allows cells to survive during hypoxic conditions and plays a major role in RA disease progression, whereas especially HIF-1α acts as a key regulator of inflammation (5). Cramer et al. reinforced the essential role of hypoxia and HIF-1α expression in GPI-induced arthritis in HIF-1α−/− mice that exhibited reduced joint inflammation, whereas wild-type mice developed severe joint inflammation (6).
Therapeutic approaches targeting HIF-associated pathways are developed mainly in cancer research, including HIF inhibitors, hypoxic prodrugs, or specific antibodies (7). Different treatment strategies targeting HIF or downstream mechanisms, such as vascular endothelial growth factor, demonstrated promising results in small animals but need to be further evaluated in clinical trials (5). Additionally, hypoxia is frequently associated with the expression of reactive oxygen species (ROS), which are additional key players in angiogenesis (4). In contrast to hypoxia, the roles of ROS and ROS scavengers in arthritic joint inflammation remain ambiguous because different studies have reported either pro- or antiinflammatory effects of different ROS components and ROS scavengers (8).
To date, the clinically applied state-of-the-art imaging modalities for the diagnosis of RA in patients are MRI and power Doppler ultrasonography. Noninvasive imaging of inflammation-induced hypoxia in arthritic joint inflammation with a PET/MRI system and a hypoxia-specific radiotracer might be an additional promising clinical tool for uncovering clinically silent joints at an early stage. This early discovery is of particular importance because the early treatment of RA patients in the so-called window of opportunity is essential to achieving complete remission. Additionally, longitudinal monitoring and the demonstration of complete RA remission via PET/MRI might allow one to minimize the duration of immunosuppressive treatment, especially in children. Currently, 18F-fluoromisonidazole (18F-FMISO) is among the commonly clinically applied nitroimidazole-based hypoxia tracers that facilitates the identification of tumor hypoxia in patients with malignancies (9), followed by 18F-fluoroazomycinarabinoside (18F-FAZA) (10). Both nitroimidazole-based radiolabeled tracers are trapped exclusively in hypoxic cells (11). ROS stress can be monitored noninvasively in vivo with L-012, which is a chemiluminescence reporter optical imaging (OI) probe that predominantly reacts with hydroxyl radicals and hypochlorous acid (12) and is able to indicate ROS/reactive nitrogen species (RNS) release during inflammation (13).
The aim of this study was to investigate the potential of noninvasive in vivo 18F-FMISO/18F-FAZA PET and MRI for the quantification of hypoxia in the inflamed joints of mice with experimental GPI-induced arthritis. We correlated our in vivo 18F-FMISO/18F-FAZA PET/MRI data with HIF-1α and HIF-2α protein expressions and immunohistologic pimonidazole staining. Additionally, we aimed to uncover a potential cross-correlation between hypoxia and ROS stress in RA.
MATERIALS AND METHODS
GPI-Induced Arthritis
GPI arthritis was induced as described previously (14). For real-time polymerase chain reaction (RT-PCR), mice were injected with GPI or control serum on day 0 and a second time on day 2. The animal studies were approved by the Regierungspraesidium Tuebingen and conducted according to approved animal use and care protocols of the German Animal Protection Law.
In Vivo PET Imaging
In vivo high-resolution PET images were acquired with a small-animal Inveon microPET scanner (Siemens Medical Solutions USA, Inc.) as described in Fuchs et al. (14). The kinetic data acquired for 90 min after tracer injection and static scans were obtained after an uptake time of 60 min and a conscious tracer uptake, respectively. 18F-FAZA and 18F-FMISO were injected intravenously, and PET images were acquired on days 1, 3, and 6 after 1 GPI/control serum transfer.
Determination of ROS Stress by OI
We measured ROS expression on days 3 and 6 after 1 GPI/control serum transfer using L-012 (5 mg/mL), a luminescent probe purchased from Wako Chemical. L-012 was dissolved in ultrapure H2O and administered intravenously, with an injection volume of 100 μL. For in vivo investigations, we used the IVIS Spectrum OI System (Perkin Elmer). OI measurements were performed immediately after the injection of L-012. The mice were anesthetized via the inhalation of isoflurane-O2 (Abbott GmbH) and warmed to maintain body temperature at 37°C. Regions of interest were drawn on the right and left ankles to enable a semiquantitative analysis of the average radiance (p/s/cm2/sr) of the chemiluminescence. The images were analyzed with Living Image Software (Perkin Elmer).
Invasive pO2 Probe Measurements
At day 6 after arthritic induction, we placed calibrated pO2 probes (BF/OFT/E; bore, ∼450 μm [Oxford Optronix Ltd.]) in the centers of the ankle joint spaces of the arthritic and healthy mice (1.5% isoflurane anesthesia) and the contralateral gastrocnemius muscle as a control. The pO2 data were recorded using PowerLab (PowerLab 16/35; AD Instruments GmbH) and analyzed with LabChart (7.2; AD Instruments GmbH).
Fluorescence-Activated Cell-Sorting (FACS) Analysis
Cells from lavages of the arthritic and healthy ankles were evaluated using a dihydrorhodamine 123 flow-cytometry assay as described elsewhere (15) to determine the reactive oxygen intermediates in the arthritic (n = 4) and healthy ankles (n = 4) at day 6 after GPI or control serum injection.
Radiopharmaceuticals
18F-FAZA and 18F-FMISO were synthesized as previously described (16,17). In both cases, the synthesizer TRACERlab FXF-N (GE Healthcare) was used. Radiochemical purity was always greater than 95% and molar activity greater than 50 GBq/μmol.
Autoradiography
For digital phosphor storage autoradiography analysis, 18F-FAZA–injected animals were sacrificed after the static PET scans, and the ankles were obtained and cut into 20 μm slices at −20°C. Autoradiography was performed with a Storage Phosphor Screen (Molecular Dynamics). The phosphor screen was scanned at a resolution of 50 μm/pixel with a STORM Phosphor-Imager (Molecular Dynamics) after an exposure time of 24 h.
Simultaneous PET/MRI
PET/MRI was performed simultaneously using a custom-built PET insert that was placed into a 7-T small-animal MRI scanner (ClinScan; Bruker Biospin MRI GmbH). The PET insert was developed and built in our laboratory. The measuring and reconstruction were performed as described elsewhere (18).
Histologic Analyses
We performed hematoxylin and eosin staining and HIF-1α immunohistochemistry to analyze the correlations with our in vivo data. Hematoxylin and eosin and immunohistochemical HIF-1α staining (GPI, n = 2; control, n = 2) were performed according to standard procedures (3). Standardized procedures for HIF-1α immunohistochemistry were performed using an automated immunostainer (Ventana Medical Systems, Inc.) following the manufacturer’s protocols for open procedures with slight modifications. Appropriate positive and negative controls were used to confirm the adequacy of the staining.
To evaluate hypoxia ex vivo, pimonidazole (60 mg/kg; Hypoxyprobe Inc.) was injected intraperitoneally into mice on day 6 after GPI (n = 3) or control serum (n = 2) induction, 50 min before the mice were sacrificed. The slides were analyzed using the Hypoxyprobe-1 Plus Kit (Hypoxyprobe) with a fluorescein isothiocyanate–conjugated mouse monoclonal primary antibody. We used an isotype antibody as a negative control. The images were scanned with a digital slide scanner (NanoZoomer 2.0-HT C9600; Hamamatsu Photonics).
Western Blot (WB) Analysis
The ankles of the arthritic and healthy mice were freshly isolated, the tissue probes were homogenized, and the proteins were collected using the Nuclear Extract Kit (Active Motif). Aliquots of tissue lysate were separated on 8% sodium dodecyl sulfate polyacrylamide gel electrophoresis gels and transferred to Amersham Hybond-P PVDF Transfer Membranes (GE Healthcare). The blots were probed with antibodies against HIF-1α or HIF-2α (GeneTex) overnight at 4°C. The membranes were incubated using LumiGlo Reagent and peroxide (Cell Signaling) and exposed to x-ray films (Amersham Hyperfilm ECL; GE Healthcare Limited). The membranes were reprobed for β-actin as a loading control.
RT-PCR
Ankle tissues were homogenized in lysis buffer (peqGOLD Total RNA Kit; Peqlab), 6 and 12 h after a single (day 0), and a second GPI or control serum injection (day 2). RNA (2 μg) was subsequently transcribed using Superscript II Reverse Transcriptase (Invitrogen). For the relative quantification by RT-PCR in a LightCycler Real Time PCR System (Roche Diagnostics), 20 ng of complementary DNA were used. The relative messenger RNA (mRNA) expression levels of HIF-1α, HIF-2α, IL-1β, and tumor necrosis factor (TNF) were normalized against the housekeeping gene aldolase. The used primers were aldolase (241 bp), 5′-TGGGCCTTGACTTTCTCCTAT and 3′-TGTTGATGGAGCAGCCT-TAGT; HIF-1α (255 bp): 5′-GATGCAGCAAGATCTCGGCGAAGC and 3′-GTCGCCGTCATCTGTTAGCACCATC; HIF-2α (230 bp), 5′-AGTAGCCTCTGTGGCTCCAA and 3′-TCCAGGGCATGGTAGAACTC; IL-1β (313 bp): 5′- TTTGACCTGGGCTGTCCTGATG and 3′-CATATGGGTCCGACAGCACGAG; TNF (212 bp): 5′-AGCCCCCAGTCTGTATCCTT and 3′-CTCCCTTTGCAGAACTCAGG.
Statistical Data Analysis
The results were calculated as the mean ± SD if not stated otherwise. We used the 2-sample Student t test to compare the uptake of 18F-FMISO and 18F-FAZA (percentage injected dose [%ID] per gram) in the joints (version 9, JMP statistical software program; SAS Institute Inc.). P values of less than 0.05 were regarded as statistically significant.
RESULTS
Invasive In Vivo pO2 Measurements in Arthritic Ankles
To analyze the low pO2 values in the arthritic ankles, we performed in vivo pO2 measurements using an invasive pO2 probe at 6 d after the onset of arthritis. As expected, we observed significantly reduced pO2 values in the arthritic ankles (median, 16.9 mm Hg [8.0–24.9 mm Hg]; interquartile range, 25%–75%) compared with the healthy control ankles (36.8 mm Hg [30.3–40.8 mm Hg], P = 0.02, Mann–Whitney U test; Fig. 1A, left plot). In contrast, the pO2 values in the muscle tissues displayed no differences between the GPI arthritic (71.0 mm Hg [51.6–72.4 mm Hg]) and healthy (63.1 mm Hg [56.2–71.6 mm Hg]) mice (Fig. 1A, right plot). We correlated ankle swelling (mm) with the pO2 values from the arthritic and healthy ankles and observed a superior Pearson product–moment correlation coefficient (r = −0.86, Fig. 1B). All animals used for this experiment demonstrated similar ankle swellings (Supplemental Fig. 1A; supplemental materials are available at http://jnm.snmjournals.org).
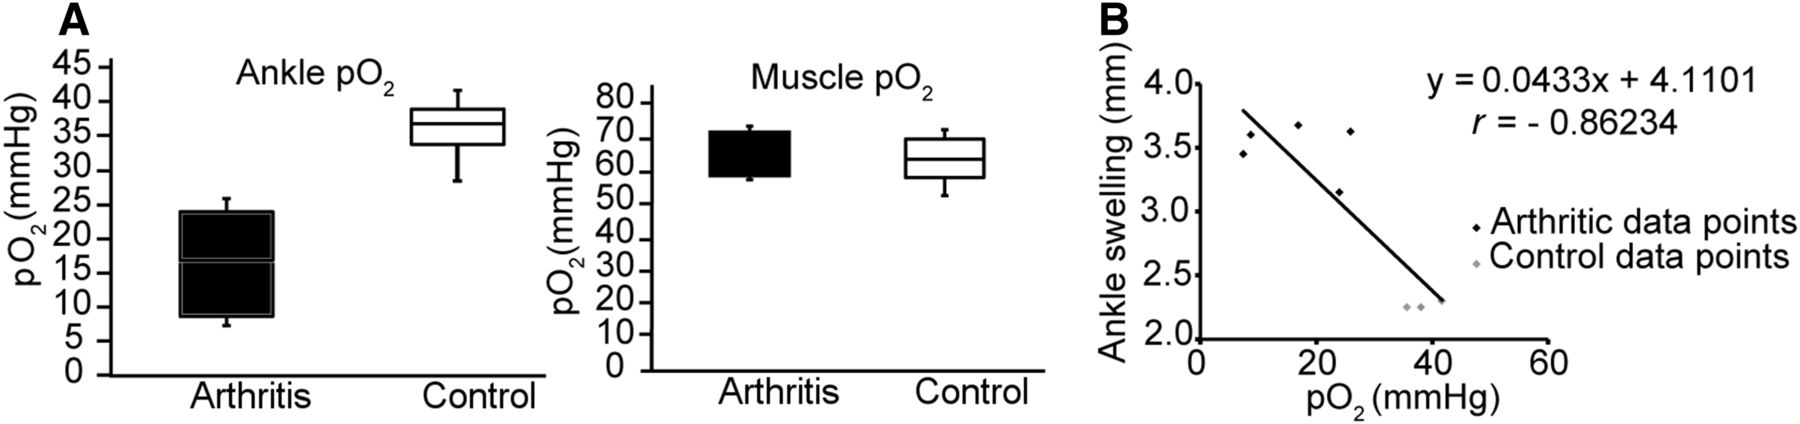
(A) pO2 values in arthritic and healthy ankles (left box plot) and the contralateral muscle issues (right box plot) on day 6 after GPI (n = 5) or control serum (n = 4) injection. (B) We correlated ankle swelling (mm) and pO2 values from arthritic and healthy ankles.
Quantitative Noninvasive In Vivo 18F-FMISO/18F-FAZA PET Imaging of Hypoxia in Inflamed Ankles
First, we injected 18F-FMISO into mice with severe ankle inflammation 6 d after GPI or control serum transfer and conducted in vivo PET investigations. Representative 18F-FMISO PET images of an arthritic and a control mouse are presented in Figure 2A (left) and demonstrate a strongly enhanced 18F-FMISO uptake in the arthritic, compared with the healthy, ankles. The time–activity curves, which were corrected for the 18F half-life and the injected dose, of the 90-min dynamic PET scans focusing on the ankles of the arthritic and healthy mice revealed an early injection peak in the arthritic ankles followed by a slight decrease and steady-state tracer accumulation at 30 min. These findings indicated intense hypoxic areas in the inflamed joints. The time–activity curves of the healthy ankles (control mice) exhibited a slight injection peak followed by steady-state tracer accumulation (Fig. 2A, middle). Quantitative analysis of the 10-min static 18F-FMISO (Fig. 2A, right; 30 min after 18F-FMISO injection) revealed a 2.7-fold enhancement of 18F-FMISO in the inflamed, compared with the healthy, ankles (arthritic: 3.0 ± 0.5 %ID/centimeter cubed [cm3]; healthy: 1.1 ± 0.2 %ID/cm3; P < 0.001).

Representative 18F-FMISO (A; first column) and 18F-FAZA PET (B; first column) images from arthritic (black column) and healthy control (white column) mice on day 6 after GPI or control serum injection (representative slices of 90-min datasets). Ninety-minute 18F-FMISO (GPI, n = 2; control, n = 1) (A; second column) and 18F-FAZA (GPI, n = 2; control, n = 1) (B; second column) time–activity curves on day 6 after GPI or control serum application. Quantification of pooled static 18F-FMISO (GPI, n = 8; control, n = 5) (A; third column) and 18F-FAZA PET (GPI, n = 8; control, n = 4) (B; third column) of arthritic and healthy ankles presented as mean of %ID/g ± SD. (C) Quantification of pooled static 18F-FMISO PET scans presented as mean of %ID/g in arthritic and healthy ankles on day 1 (GPI, n = 3; control, n = 2), day 3 (GPI, n = 2; control, n = 2), and day 6 (GPI, n = 8; control, n = 4) after serum transfer (left bars). We correlated ankle swelling (mm) with %ID/g values from arthritic ankles on days 1, 3, and 6 after serum transfer (right). Mean ± SD; **P < 0.001.
To strengthen our 18F-FMISO data, we injected the second hypoxia tracer, 18F-FAZA, into arthritic and healthy mice (Fig. 2B, left). Similar to the 18F-FMISO results, we observed an enhanced 18F-FAZA uptake in the inflamed, compared with the healthy, ankles. The 90-min 18F-FAZA time–activity curves were similar to the 18F-FMISO time–activity curves and revealed an early injection peak in the arthritic ankles followed by a quite strong decrease and steady-state tracer accumulation at 60 min. The time–activity curve of the ankles of the healthy mice lacked the injection peak and reached a plateau after 40 min (Fig. 2B, middle). Quantitative analysis of the 10-min static 18F-FAZA scans (Fig. 2B, right; 60 min after 18F-FAZA injection) revealed a 2.8-fold enhancement of 18F-FAZA uptake in the inflamed, compared with the healthy, ankles (arthritic: 1.4 ± 0.5 %ID/cm3; healthy: 0.5 ± 0.28 %ID/cm3; P < 0.001).
Next, we focused on the feasibility of the use of hypoxia tracers to detect the early stages of experimental arthritis. To this end, we injected 18F-FMISO into littermates on days 1, 3, and 6 after GPI or control serum injection and obtained static PET scans that focused on the ankles. Twenty-four hours after the onset of GPI arthritis, we observed no enhancement of hypoxia tracer uptake (arthritic: 1.4 ± 0.2 %ID/cm3; healthy: 1.3 ± 0.1 %ID/cm3), whereas on day 3, a significantly enhanced 18F-FMISO uptake was observed in the arthritic ankles (arthritic: 3.3 ± 0.4 %ID/cm3; healthy: 1.5 ± 0.1 %ID/cm3; P = 0.002). On day 6, quantitative analysis of the 10-min static 18F-FMISO PET scans (30 min after 18F-FMISO injection) indicated a 2.7-fold enhancement in 18F-FMISO uptake in the inflamed, compared with the healthy, ankles (arthritic: 3.0 ± 0.5 %ID/cm3; healthy: 1.1 ± 0.2 %ID/cm3; P < 0.001, Fig. 2C, left). Additionally, we correlated the 18F-FMISO uptake (%ID/cm3) with ankle swelling (mm) on all investigated days and observed good correlations between the 18F-FMISO uptake and ankle swelling (Pearson product–moment correlation coefficient, r = 0.88; Fig. 2C, right). All animals used for these experiments demonstrated similar ankle swellings (Supplemental Figs. 1B–1D and 2A and 2B).
Simultaneous Noninvasive In Vivo PET/MRI Measurements
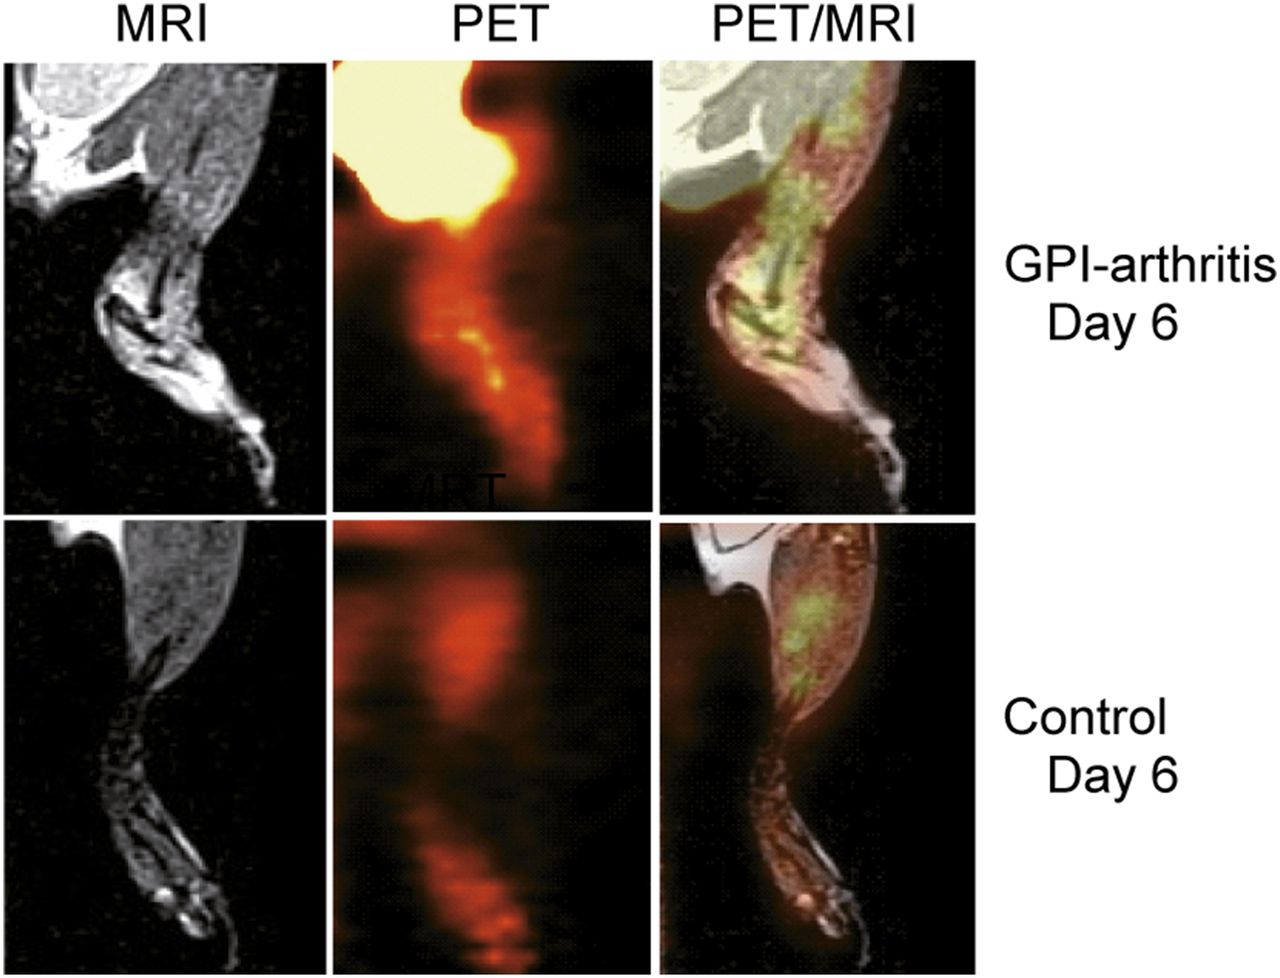
High-resolution simultaneous PET/MRI investigations provided temporal and spatial information about the hypoxia tracer uptake in the inflamed and healthy ankles. MRI yielded detailed anatomic information with high soft-tissue contrast. The simultaneous 18F-FMISO PET/MR images indicated that the severe ankle swelling and pronounced accumulation of synovial fluid within the joint spaces of the arthritic ankles correlated well with the sites of 18F-FMISO uptake (Fig. 3).

Localization of exact 18F-FMISO uptake sites in arthritic and control ankles, using PET/MRI. Representative healthy mouse after control serum injection exhibited no signs of hypoxia.
Ex Vivo Autoradiography Analysis and Pimonidazole Staining Confirming 18F-FMISO/18F-FAZA PET Data
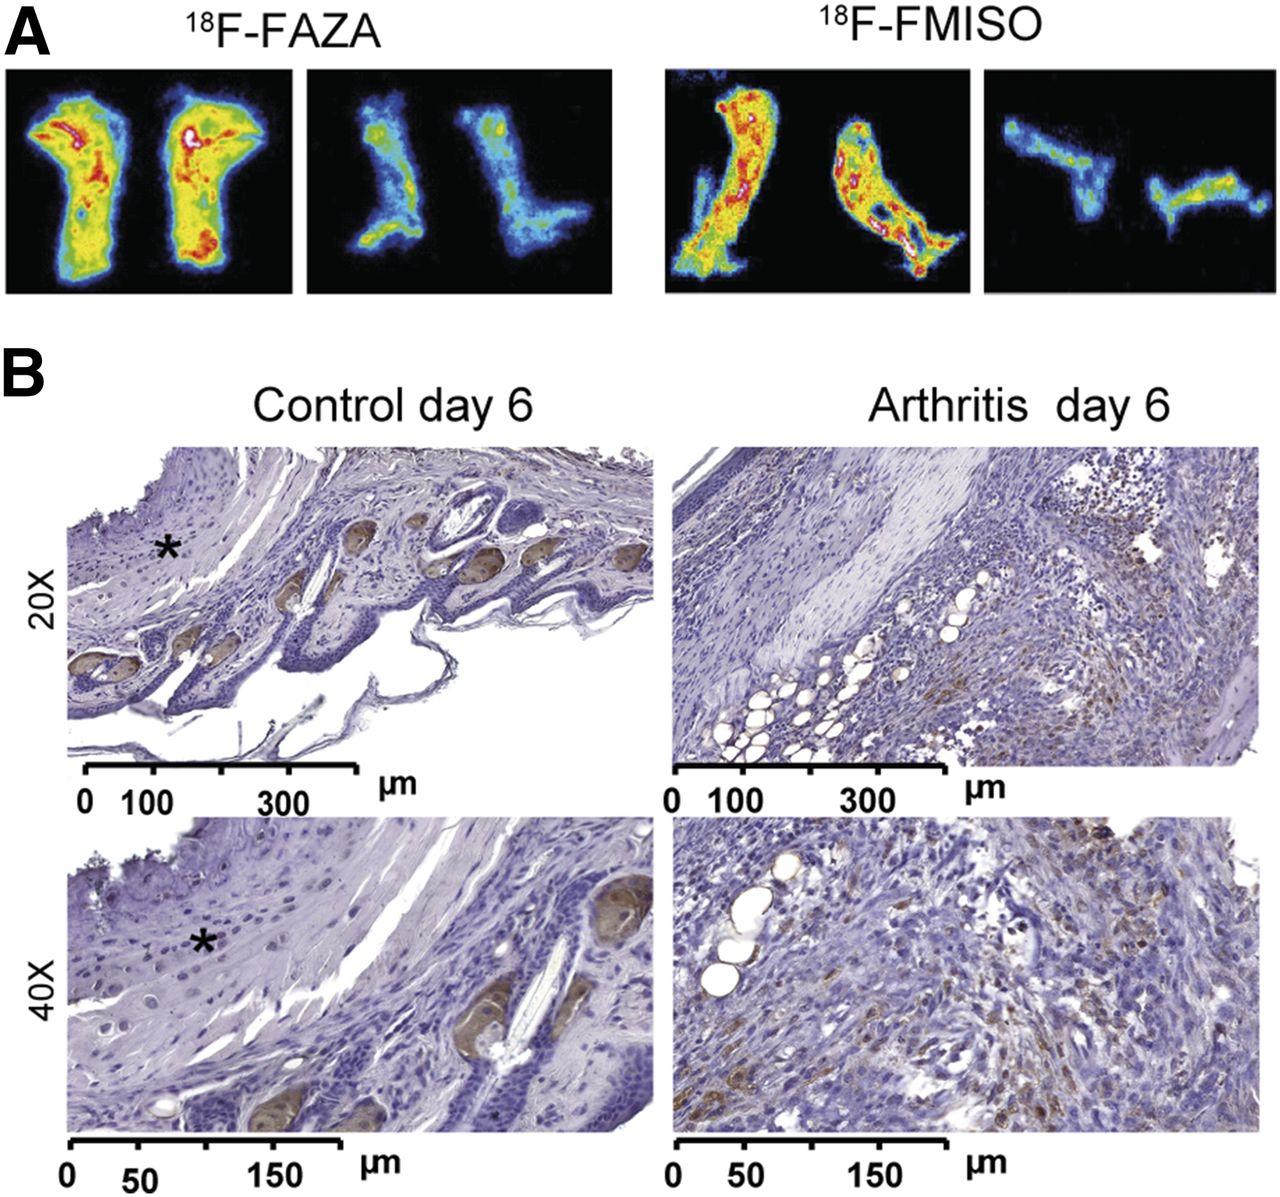
We sacrificed the mice immediately after the in vivo PET investigations, sliced the ankles (20 μm), and placed them on a phosphor screen for ex vivo autoradiography analysis. The inflamed ankles exhibited enhanced 18F-FMISO/18F-FAZA uptake with hot spots (Fig. 4A) similar to the findings of the PET examinations (Figs. 2 and 3), whereas only a low and almost uniform 18F-FMISO/18F-FAZA uptake was observed in the control ankles. Because pimonidazole accumulates within hypoxic regions via a basic mechanism that is identical to that of the hypoxia tracer 18F-FMISO/18F-FAZA, we conducted pimonidazole immunohistochemistry of the arthritic (Fig. 4B, right) and healthy ankles (Fig. 4B, left) 6 d after 1 GPI or control serum injection. Clearly distinct visible dense areas (i.e., hot spots similar to our PET and autoradiography data) of accumulated inflammatory cells in the synovia stained positive for pimonidazole. No inflammatory cells were found in the ankles of the healthy mice, and none of the resident cells (with the exception of presumably unspecific staining of sebaceous glands (19)) stained positive for pimonidazole.

(A) Representative 18F-FAZA autoradiography analysis of slices from arthritic ankles on day 6 after GPI serum transfer (left) and healthy ankles after control serum application (right) confirming in vivo 18F-FAZA PET results. (B) Pimonidazole immunohistochemistry from arthritic ankles 6 d after GPI serum transfer (right), indicating areas of enhanced hypoxia compared with healthy ankles (left, *).
HIF-1α Immunohistochemistry and HIF-1/HIF-2α WB and RT-PCR Analyses Support Onset of Hypoxia
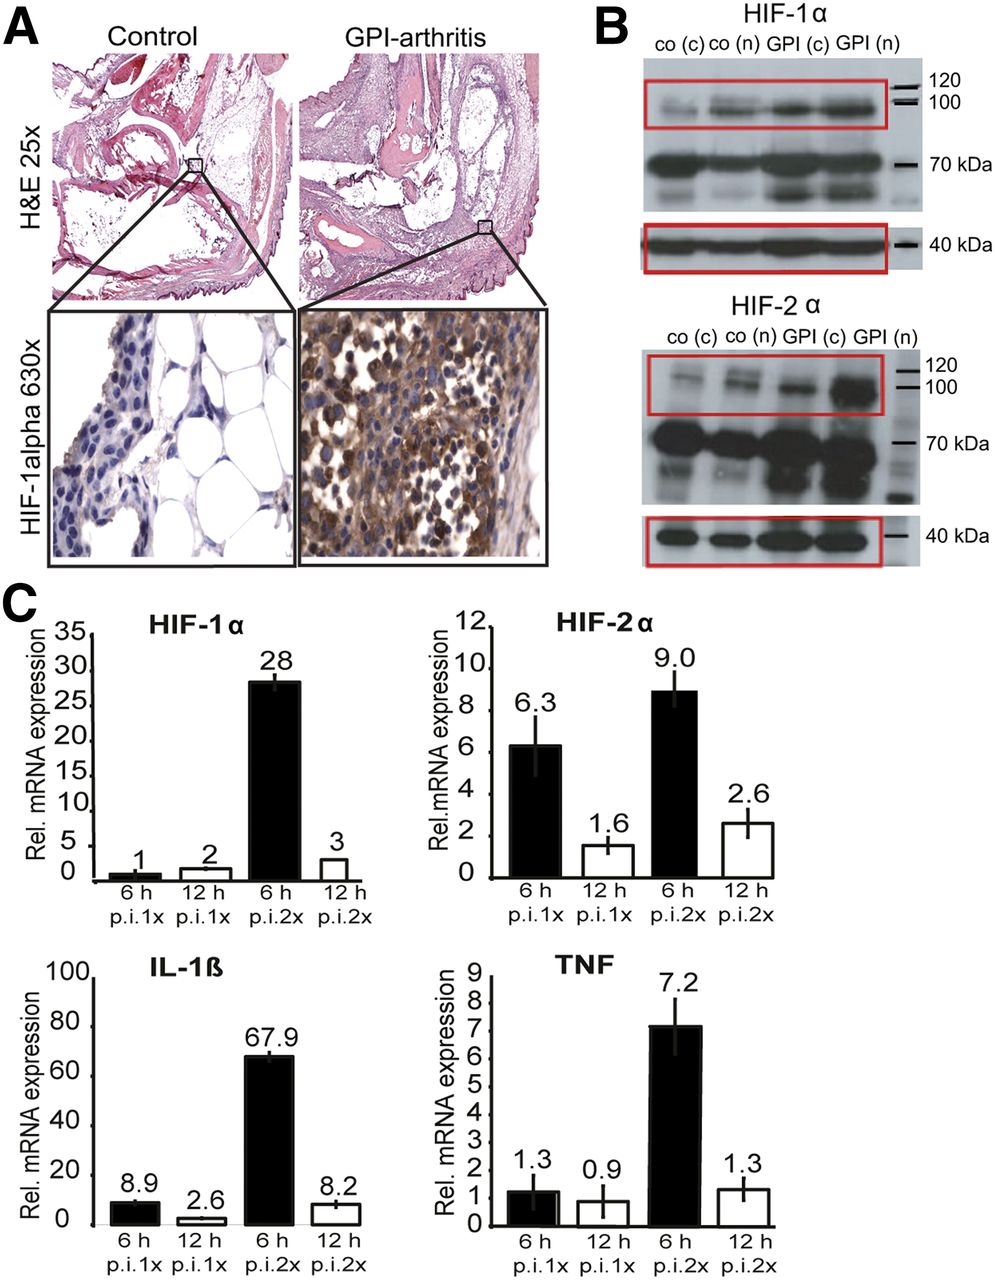
Next, we conducted hematoxylin and eosin staining and HIF-1α immunohistochemistry of the arthritic (Fig. 5A; upper right and lower right) and healthy ankles (Fig. 5A; upper left and lower left). At day 6 after GPI serum transfer, inflamed ankles revealed a high number of infiltrating inflammatory cells composed of neutrophils and mononuclear cells. In some cases, early phases of bone destruction were observed, and the synovial membrane covered the articular surface of the joint. Fibrosis and focally thinned and wasted articular cartilage were observed. The ankles of the healthy control mice exhibited normal joint structures with no signs of inflammation.

(A) Representative hematoxylin and eosin–stained slides from GPI arthritic ankles (n = 2) on day 6 after GPI serum transfer are shown (upper images). HIF-1α (630×) staining (n = 2) demonstrated increased number of hypoxic cells comprising predominantly neutrophils and synoviocytes (lower images). Control ankles (n = 2) exhibited no positive staining. (B) HIF-1α and HIF-2α WB analyses of arthritic (n = 2) and healthy ankles (n = 2) 6 d after GPI or control serum transfer revealed strongly enhanced HIF-1α and HIF-2α protein expressions. Control β-actin staining was performed as indicated at 40 kDa. (C) RT-PCR was performed with ankle tissue from mice 6 (black column) and 12 h (white column) after single GPI or control serum injection and with mouse ankle tissue from day 2 after first and 6 and 12 h after second GPI or control serum injection. We detected highest relative expressions of HIF-1α, HIF-2α, IL-1β, and TNF, 6 h after second GPI serum transfer. c = cytosolic fraction; h = hours; n = nuclear fraction; p.i. = after injection.
HIF-1α-immunohistologic staining of arthritic ankles revealed a high number of local and infiltrated cells with positive HIF-1α staining mainly composed of neutrophils and synoviocytes (Fig. 5A, lower right). HIF-1α staining of the healthy ankles revealed negative results (Fig. 5A, lower left).
For a quantitative analysis of the HIF-1α and HIF-2α expression in the inflamed and healthy ankles, we performed WB analysis. The inflamed arthritic ankles displayed strong HIF-1α and HIF-2α protein expressions (at day 6 after 1 GPI serum injection) in the nuclear fraction (n) and strong but lower expressions in the cytosolic fraction (c); only a slight HIF-1α/2α protein expression was determined in healthy ankles (Fig. 5B).
RT-PCR analyses of the expression levels of HIF-1α and HIF-2α mRNA in the inflamed ankles revealed no increase in HIF-1α mRNA expression after the first GPI serum injection but strong 28-fold upregulation 6 h after a second GPI serum injection (48 h after the first GPI serum injection). HIF-2α mRNA expression increased 6-fold, 6 h after the first, and 9-fold, 6-h after the second, GPI serum injection (Fig. 5C, upper). Focusing on the proinflammatory cytokines, we found a 9-fold enhancement of IL1β mRNA expression 6 h after the first GPI serum injection and a 68- and 7-fold increase in IL1β mRNA and TNF mRNA expression, respectively, 6 h after the second GPI serum injection (Fig. 5C, lower).
Hypoxia Is Associated with ROS Stress
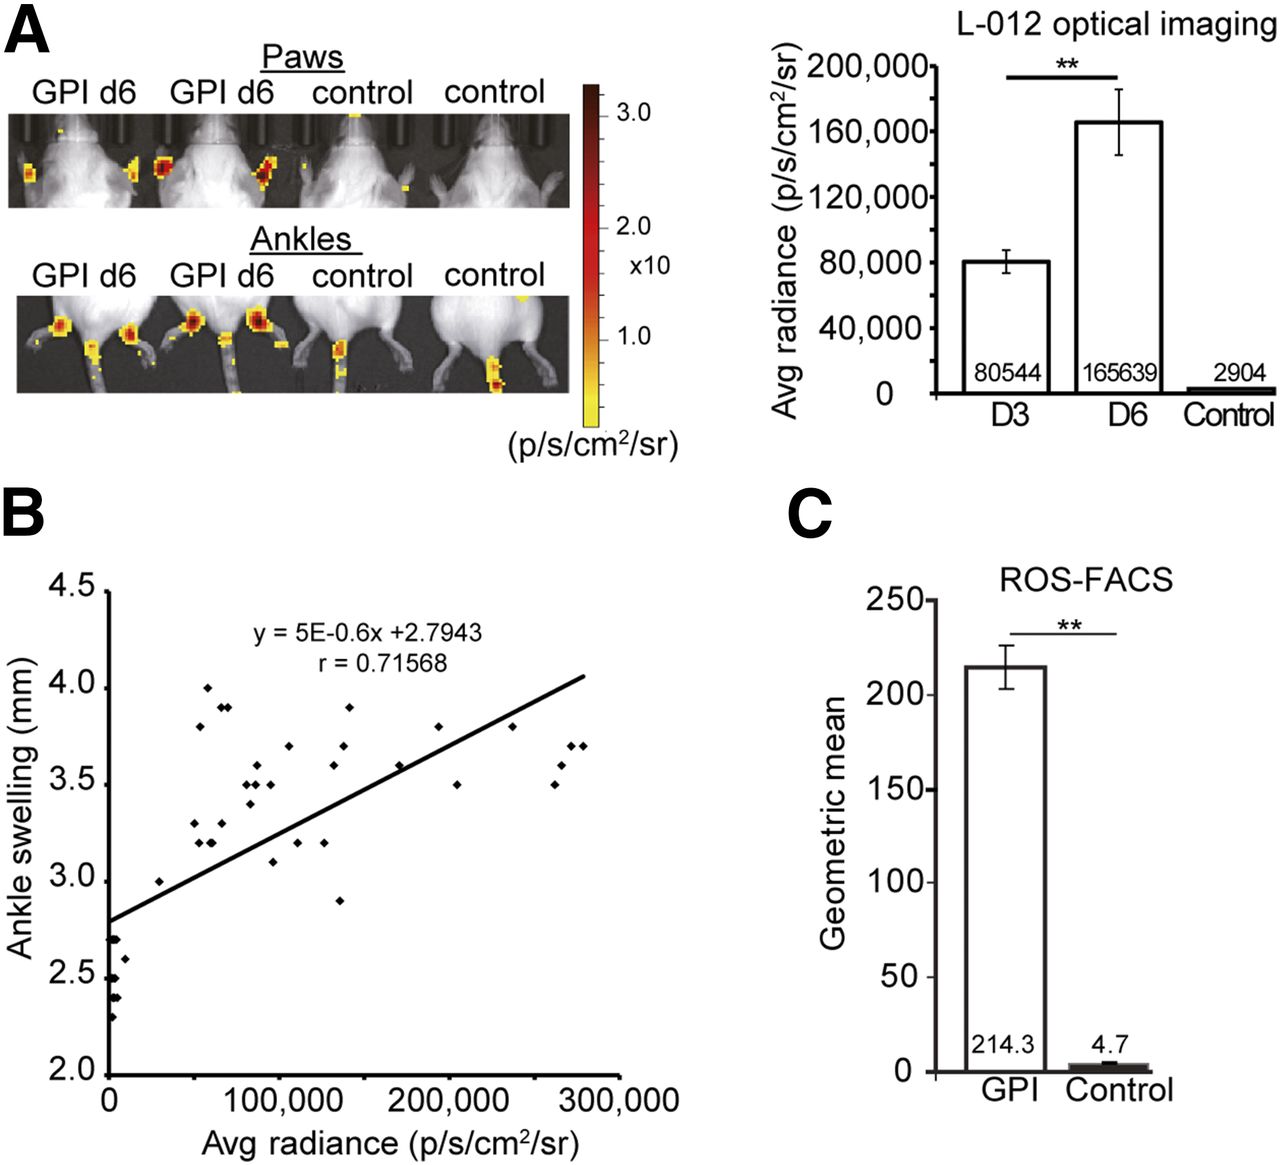
To corroborate our ROS stress hypothesis, we evaluated the onset of ROS stress noninvasively in vivo with OI using L-012, at days 3 and 6 after 1 GPI/control serum injection. Our investigations revealed impressive L-012–derived signal intensity (SI) in the ankles and paws of the arthritic mice, but no signal was noted in the joints of the healthy mice (Fig. 6A). Quantitative analysis of the L-012 SI yielded a 57-fold, statistically significant (P < 0.0001) enhancement of the average radiance SI (p/s/cm2/sr) in the arthritic ankles on day 6 (165,639 [p/s/cm2/sr]) compared with the healthy ankles (2,904 [p/s/cm2/sr]). On day 3 (80,544 [p/s/cm2/sr]), we observed a 28-fold, significant (P < 0.0001) enhancement of the SI of L-012 compared with the control ankles (Fig. 6A). All animals used for this experiment demonstrated similar ankle swellings (Supplemental Fig. 2C). Furthermore, we correlated the L-012 SI (p/s/cm2/sr) with ankle swelling (mm) on all investigated days (control and arthritis on days 3 and 6) and found a good Pearson product–moment correlation coefficient of r = 0.72 (Fig. 6B).

(A) L-012 chemiluminescence imaging in mice after GPI or control serum injection using OI. Arthritic ankles exhibited high levels of L-012 expression compared with control ankles (left). Quantitative analysis confirmed a significantly greater L-012 signal on days 3 (80,544 p/s/cm2/sr, n = 8) and 6 (165,639 p/s/cm2/sr, n = 8) after GPI serum injection in arthritic compared with healthy ankles (2,904 p/s/cm2/sr) (n = 9) (right). (B) We correlated ankle swelling (mm) with average (avg) radiance (p/s/cm2/sr) of L-012 in arthritic and healthy ankles at days 3 and 6 after GPI or control serum injection. (C) DHR-FACS analyses of cells gained from lavage of arthritic and healthy ankles revealed significantly greater ROS levels in arthritic ankles than control ankles. Mean value ± SD; **P < 0.0001.
Additionally, we isolated the cellular infiltrates from ankle joint lavages of the arthritic and healthy mice (at day 6) and performed FACS analysis using dihydrorhodamine (DHR) staining, which is used to identify ROS intermediate-expressing leukocytes. The DHR-FACS analysis revealed a 45-fold enhancement of the expression of reactive oxygen intermediates (geometric mean of DHR-positive cells) in the joint lavages of the arthritic ankles (214.3) compared with the lavages of the healthy ankles (4.7) (Fig. 6C). Thus, our noninvasive in vivo L-012 OI measurements and ex vivo DHR-FACS analysis clearly demonstrated a strong correlation between hypoxia and ROS stress in the inflamed ankles.
DISCUSSION
In this study, we experimentally verified that 18F-FMISO/18F-FAZA PET imaging is feasible for uncovering inflammation-induced hypoxia noninvasively in vivo in arthritic joints. We confirmed the presence of tissue hypoxia in the inflamed ankles in vivo with an invasive pO2 probe and found significantly reduced interstitial pO2 values in the articular ankle joint spaces of the arthritic mice compared with the healthy mice (Fig. 1). In 2004, Baudelet and Gallez used an identical invasive system to investigate the influences of different anesthetics on interstitial pO2 values in tumors (20). The activation of infiltrating and resident cells is associated with strongly enhanced glucose metabolism and O2 consumption and is thus likely responsible for hypoxia and hypoxia-induced angiogenesis (21).
As early as 1979, Chapman et al. recommended radioactively labeled 2-nitroimidazoles, such as 18F-FMISO, for noninvasive in vivo PET imaging of hypoxia (22). Local oxygen tension is the major parameter that causes 18F-FMISO retention in cells by ligation to intracellular macromolecules. 18F-FMISO retention is dependent on the activity of nitroreductase, which leads to the reduction of an NO2 group and the formation of an imidazole ring (23). Currently, 18F-FMISO is the best-characterized and established hypoxia tracer and is commonly used in clinical and preclinical cancer studies to monitor anticancer therapies (24).
Our 18F-FMISO PET studies revealed significantly enhanced hypoxia tracer uptake in the arthritic ankles compared with the control ankles on day 6 (Fig. 2), which verifies 18F-FMISO as an applicable marker for the detection of early RA because 18F-FMISO PET uptake correlated well with the observed ankle swelling in these experiments. 18F-FAZA is a second hypoxia tracer with favorable pharmacokinetics and tracer clearance. We obtained similar results with this tracer, strengthening our data regarding hypoxia and PET imaging of inflammation-induced hypoxia in arthritic ankles (Fig. 2) (10,11,25).
Our hypoxia PET studies further uncovered an enhanced 18F-FMISO uptake in the inflamed and healthy ankles as well as a clearly visible enhanced whole-body tracer uptake ratio compared with 18F-FAZA. However, most importantly, the arthritic and healthy ankles produced similar results with both hypoxia tracers (ratio 18F-FMISO: 2.7; ratio 18F-FAZA: 2.8). This phenomenon can be explained by the faster 18F-FAZA tissue clearance, resulting in a reduced 18F-FAZA background. Another reason for the differences in the 18F-FMISO and 18F-FAZA tracer distributions could be the greater hydrophilicity of 18F-FAZA than 18F-FMISO (25).
We used simultaneous 18F-FMISO/18F-FAZA PET/MRI to identify the exact anatomic sites (bone and soft tissue) of hypoxia in the inflamed ankles/joints (Fig. 3). MRI additionally enables the identification of inflammation-induced changes in soft tissues, such as edema, thickening of the synovia, and pannus formation (14). 18F-FMISO PET/MRI focused on the inflamed ankles indicated severe ankle swelling and a pronounced accumulation of synovial fluid within the joint spaces of the arthritic ankles that correlated well with the sites of 18F-FMISO uptake (Fig. 3).
Several ex vivo methods are available to identify sites of hypoxia in tissues, for example, the detection of intravenously administered nitroimidazoles, such as pimonidazole, depicts hypoxic regions (26) as do analyses of regulatory proteins and genes (HIF-1α and HIF-2α protein/mRNA) after biopsy. Thus, using pimonidazole, which is a bioreactive chemical substance that accumulates in regions with low pO2 values and forms protein adducts in living hypoxic cells (27), we were able to confirm our in vivo 18F-FMISO/18F-FAZA PET results (Fig. 4B). Furthermore, to validate our hypoxia PET results on the molecular level, we performed WB analyses of lysates derived from the arthritic and healthy ankles. In this context, it is important to mention that approximately 1%–5% of all human genes are regulated in response to hypoxia, mainly through HIF (28). An oxygen content of less than 5%–10% causes the accumulation and activation of HIF-1α, which induces angiogenesis-promoting growth factors (29). The role of HIF-1 in cancer biology is well accepted, and thus far several studies have proven that HIFs coordinate different levels of immune responses (30). During inflammation, hypoxia is caused by a massive infiltration and activation of neutrophils and mononuclear leukocytes and by activated proliferating resident cells (macrophages, synovial/endothelial cells). This process results in enhanced expression of the transcription factors HIF-1α and HIF-2α (31). The transcription factor HIF-1α is constitutively expressed and stabilized during hypoxia, leading to increased expression levels of proangiogenic mediators.
Several previous studies have confirmed that mitochondria-generated ROS under low-oxygen conditions are responsible for the activation of HIF during hypoxia (32,33). Additionally, HIF-1α is primarily responsible for the acute hypoxic response and prolongs the survival of neutrophils via the inhibition of apoptosis (34). Cramer et al. uncovered the superior importance of HIF-1α in GPI arthritis. Thus, hypoxia-driven HIF-1α expression appears to be essential in experimental arthritis (6). In line with these data, Westra et al. demonstrated that sustained HIF-2α-expression is important for RA development (35). Similar results were observed by Ryu et al. in 2014, demonstrating that activation of HIF-2α is needed to induce RA, because HIF-2α–deficient mice revealed reduced arthritic joint inflammation (36).
Prolyl hydroxylase domain enzymes (PHDs) hydroxylate HIF-α subunits under normoxia, whereas under hypoxia PHDs lose their function, leading to a HIF-α accumulation and translocation into the nucleus. The wide variety of PHD functions can be dependent or independent of HIF. PHDs sense not only oxygen but also various metabolites to obtain bioenergetic balance and organismal homeostasis. ROS have shown to be involved in the inhibition of PHDs activity due to its oxidization of ferrous iron to ferric iron (37).
Inflammation is frequently associated with ROS/RNS stress that can catalyze or even protect against inflammatory disease progression. In addition to other cellular sources, ROS are generated in neutrophils that release myeloperoxidase and in macrophages that release the multienzyme complex nicotinamide adenine dinucleotide phosphate oxidase and myeloperoxidase (38-40). The cellular sources of ROS, that is, neutrophils and macrophages, are both critically involved in experimental GPI arthritis (41,42). ROS are classically defined as partially reduced metabolites of oxygen that possess strong oxidizing capabilities. At physiologic concentrations, ROS act as mediators of inflammation and as signaling molecules that regulate cell growth, cell adhesion and differentiation, senescence, and apoptosis (38-40). Myeloperoxidase catalyzes the formation of hypochlorous-acid, which is a powerful oxidant derived from chloride ions and hydrogen peroxide. ROS are rapidly diffusing short-lived messenger molecules that are generated as bystander products of cellular metabolism through the electron transport chain in the mitochondria as well as via cytochrome P450. ROS, such as superoxide anions, can rapidly combine with nitric oxide to form RNS, such as peroxynitrite, which adds to the proinflammatory burden of ROS (38,40). Various enzymes can generate cellular ROS, including xanthine oxidases, cyclooxygenases, nitric oxide synthases, mitochondrial oxidases, and the nicotinamide adenine dinucleotide phosphate oxidases. A major ROS source is the nicotinamide-adenine-dinucleotide-phosphate oxidases (mainly expressed by phagocytes and endothelial cells) (38,40,43).
Furthermore, oxidation by ROS can lead to the activation of inactive proteases (44). Antioxidants can prevent this process (45). We recently have shown that the ROS scavenger N-acetylcysteine suppresses the inflammatory immune response and the in vivo activation of matrix metalloprotease (MMP) in an experimental model of contact hypersensitivity reaction. In this study, we determined MMP activity with OI using a specifically activatable probe (46). Activatable probes are designed to be optically silent in their inactivated state because of the quenching of the signal by Förster resonance energy transfer. After cleaving of the specific peptide sequence by activated specific proteases, such as MMPs, a fluorescence signal can be detected in vivo by OI (47). MMP activation is critically involved in the establishment of RA (48).
Kielland et al. demonstrated that L-012 is a useful probe for in vivo determination of ROS/RNS stress in different inflammation models. Thus, L-012 is a functional OI probe that emits light from sites of ROS/RNS release in a spatial and temporal manner (13). Imada et al. demonstrated that the L-012 signal was strongly induced by stimulated neutrophils (49), verifying L-012 as a tool for measuring ROS/RNS during inflammatory processes. Hence, we used the L-012 probe to demonstrate ROS/RNS stress in arthritic joints. At the time point with the most severe ankle swelling, that is, day 6 after the onset of arthritis, we observed the most pronounced ROS stress (Fig. 6A), which clearly indicated that strong hypoxia in arthritic joint disease is evident even before the appearance of strong ROS stress.
Several research groups claim that ROS are mainly produced during acute hypoxia. Thus, the inhibition of ROS stress at the early onset of disease could protect against chronic hypoxia and the establishment of the chronic inflammation that is responsible for tissue damage (50). Because the development of inflammation due to hypoxia is clinically important (51), noninvasive in vivo PET imaging of inflammation-induced hypoxia during the initial phases of RA might enable the identification of early pathologic changes even before the onset of cartilage and joint destruction. Thus, we demonstrated for the first time, to our knowledge, that hypoxia PET imaging using 18F-FMISO or 18F-FAZA is applicable for the visualization and monitoring of RA ankles. Moreover, we uncovered a different temporal dynamic of hypoxia and ROS stress and found that hypoxia accrues with enhanced ROS stress.
CONCLUSION
Noninvasive in vivo hypoxia PET imaging represents an important new tool for identifying the early stages of inflammation and monitoring therapeutic interventions in the clinic for patients with RA. The in vivo specification of the different temporal dynamics of hypoxia (associated with expression of HIFs) and ROS/RNS expression could be of paramount importance in terms of an individualized therapeutic approach for RA patients, especially because specific inhibition of HIFs might represent a new promising treatment approach.
DISCLOSURE
This work was supported by Werner Siemens Imaging Center, Department of Preclinical Imaging and Radiopharmacy, Eberhard Karls University Tuebingen, the Werner Siemens-Foundation and by the DFG through the CRC 156 (project C03 and B06) and Ro 764/14-1. No other potential conflict of interest relevant to this article was reported.
Acknowledgments
We thank Daniel Bukala, Funda Cay, and Walter Ehrlichmann, Werner Siemens Imaging Center, Laboratory for Preclinical Imaging and Radiopharmacy, University of Tuebingen, for their excellent technical support of the study.
Footnotes
Published online Feb. 9, 2017.
- © 2017 by the Society of Nuclear Medicine and Molecular Imaging.
REFERENCES
- Received for publication October 24, 2016.
- Accepted for publication January 11, 2017.


Jump to section
Related Articles
Cited By...
- No citing articles found.