


Abstract
If molecular imaging is to prove clinically useful it will have to surpass current, primarily anatomic techniques in terms of sensitivity and the ability to detect minimal changes in tissue. One of the most important tests for molecular imaging is to determine whether it can image the metastatic potential of tumors. Like all predictive endeavors, the imaging of such “potential” is a daunting task, but one that only molecular imaging—rather than standard, anatomic techniques—is likely to solve. Although difficult, imaging of metastatic potential is also arguably the most important task for molecular imaging of cancer because it is generally the dissemination of malignant tissue, not its prolonged residence in an inopportune site, which kills the patient. Below are examples of uses of molecular imaging of metastases as well as of metastatic potential, the former being a far more developed area of clinical inquiry.
- magnetic resonance imaging
- radiopharmaceutical
- PET
- SPECT
- optical imaging
- bioluminescence
- fluorescence
- metastasis
Metastasis is the final step of neoplastic progression and remains the primary cause of death from solid tumors (1). Generally, the term metastasis refers to hematogenous dissemination (blood-borne spread of cancer cells) to distant organs following a pattern of organ tropism (preference of the tumor cells to spread to a specific secondary organ) (2). Although metastasis is normally thought of as blood-borne dissemination, there are other modes of spreading to secondary sites. For example, the lymphatic circulation is also a common conduit for initial spread. The process of metastasis includes tumor cells leaving their original niche, colonizing distant organ sites, and forming secondary lesions. Determining the metastatic proclivity of a tumor at the cellular level is a major challenge because of heterogeneity of the primary tumor. Some tumors are highly aggressive, forming secondary lesions with high frequency. Examples would include small cell lung cancer, pancreatic adenocarcinoma, and melanoma. On the other hand cancers such as glioblastoma multiforme or basal cell carcinoma remain locally invasive, rarely metastasizing to other organs. In breast cancer, metastasis can remain undetected for many years after the resection of the primary tumor and the long latency is suddenly uncovered as multiple secondary lesions triggered by unknown causes. The tendency of a primary tumor to form secondary metastatic lesions is the “metastatic potential” of that tumor.
Not all tumors are metastatic. In addition, metastatic cancers are composed of heterogeneous cell populations with diverse metastatic potentials and organ specificity, indicating that the metastatic process is due in part to specific molecular characteristics of the metastasizing cells (3–13). However, the ontogeny of competent metastatic cells remains controversial. Obtaining metastatic competence has been considered a stepwise selection process, with selection being largely modulated by the microenvironmental milieu (14–16). However, more recently, a cancer stemlike or cancer initiator cell population has been proposed as the generating source of competent metastatic cells (17–22). Whatever the underlying mechanisms, the final outcome provides cell populations with an inherent capacity to metastasize, and these populations need to be identified and targeted with specific therapeutics.
DECIPHERING THE BIOLOGY OF METASTATIC POTENTIAL
To establish metastases, tumor cells must undergo a series of events involving progressive growth under selection pressure. Those events include intravasation (escaping anoikis, that is, detachment-induced cell death, and entry to the circulation), embolization (clumping with platelets to ensure survival during circulation), extravasation (leaving the circulation at the target organ), and colonization (forming lesions within the host organ) (Fig. 1). The success of this process depends both on the properties of the tumor cells and the propensity of the host organ to accept these cells. This nonrandom process was first explained in the “seed and soil” hypothesis published by Paget as early as 1889 (23). This hypothesis was nevertheless later challenged by Ewing (24), who proposed that metastasis was a mechanical arrest of the circulating tumor cells in the capillary bed of the host organ. Hart and Fidler reestablished that although mechanical arrest could indeed occur in the capillary bed of the host organ, subsequent growth of secondary lesions depended on the ability of that specific organ to provide the proper milieu for tumor production (25). The healthy tissues in the host organ are generally hostile to the invading tumor cells because of tightly regulated homeostatic mechanisms. Tumor cells with metastatic competence must therefore evade or co-opt this highly evolved barrier to colonize a distant organ (16). Millions of tumor cells might be released every day into the circulation, but only a small fraction of them are capable of colonizing distant organs (26). Accordingly, the metastatic potential of a tumor correlates with the number of cells capable of seeding target organs as well as the hospitability of the host organ microenvironment.

Illustration of overall metastatic process. Tumor cells are believed to proceed through these sequential steps to form clinically detectable metastases. (Adapted with permission of (193).)
Cells with Metastatic Competence
A solid tumor mass consists of a small population of cells with metastatic competence (the seed), whereas most cells do not possess metastatic ability. Because the process of metastasis starts within the primary tumor microenvironment before the cells start to migrate from the primary site (27), a fraction of these competent cells must always reside in the primary tumor bed. In addition to synchronous seeding (simultaneous metastatic lesions in different organs originating from the same primary tumor) and metachronous seeding (sequential seeding of the tumor cells from another secondary metastatic lesion to a tertiary site), a theoretic possibility of self-seeding has been discussed (28). Self-seeding suggests that the circulating tumor cells can return to their original site, with their accumulation accounting for the majority of aggressive cells at the primary site. Self-seeding also suggests that there may be a way to identify this specific subset of metastatically competent cells at the primary site even before the secondary lesions are clinically detectable.
Genetic Basis of Metastatic Competence
The past few decades of work in uncovering the genetic basis of cancer have been reviewed thoroughly (29,30), but we are only just beginning to understand the genetic basis of metastasis. Genes (or sets of genes) responsible for the specific phenotypes essential for metastatic cancer cells to overcome each barrier within the multistep process of metastasis are defined as genetic determinants of metastasis. With the advance of high-throughput technologies in profiling the human transcriptome, several groups of genes have been identified that may be involved exclusively in the process of metastasis rather than in oncogenesis in general. Those groups of genes have recently been classified into 3 distinct groups. Metastasis initiation genes comprise the set of genes that confer metastatic potential at the primary site. The second group is metastasis progression genes, which mediate survival of the cancer cells by conferring on them resistance to anoikis in the primary tumor bed and also in the circulation. The third class includes the metastasis virulence genes, which provide a selective advantage of metastatic cells at the secondary site but not in the primary tumor (15).
Gene expression signatures of metastasis that may provide insight into metastatic potential are being developed. In breast and ovarian carcinomas, the gene expression signature of hypoxia has been established as a predictor of metastatic risk (31,32). In the tumor microenvironment, the cellular response to hypoxic stress involves stabilization of hypoxia-inducible factor (HIF)–1, a transcription factor that regulates the genes responsible for angiogenesis (33), anaerobic glycolysis (34,35), cell survival, and invasion (36,37). Additionally, a substantial amount of data derived from messenger RNA expression profile arrays have demonstrated a gene expression signature for breast and prostate cancer predictive of risk of metastasis and ultimate clinical prognosis (17,18,38–44). The subset of breast tumor cells with the surface markers CD44+CD24−/low shows a 186-gene invasiveness signature, which is tightly associated with poor prognosis in breast cancer, medulloblastoma, lung cancer, and prostate cancer (17).
Metastatic Predisposition, Tissue-of-Origin Theory
Adult cells that originate from the neural crest, such as melanocytes, retain migratory behavior throughout their life span, likely predisposing them to metastasis after neoplastic transformation (45). The tissue-of-origin model of metastases explains how some cells in the primary tumor microenvironment could have a different mutational spectrum due to their developmental origin that may confer on them an advantage over other cells in the acquisition of metastatic ability. Most aggressive tumors are dedifferentiated to an extent to which it is impossible to determine their tissue of origin on the basis of a standard histologic examination. In fact, 5% of all cancers are diagnosed with an unknown primary origin (46–48).
Cancer Stem Cells and Stem Cell Pathways in Metastasis
Presently, cancer research is heavily influenced by the concept of the cancer stem cell. Many believe that tumors originate from mutated cancer stem cells, whereas normal organs are generated and maintain tissue homeostasis by normal stem cells (49,50). The concept of migrating stem cells, which contribute to metastasis, has also been suggested (51). Such migrating stem cells are biologically different from the stationary cancer stem cells at the primary site. Although the cancer stem cell hypothesis in solid tumors is being tested rigorously, with increasing supporting evidence, further evidence is required before general acceptance by the cancer research community. Recent experimental evidence implicates the stem cell signaling pathways Wnt, hedgehog, and notch in promoting cancer. Those pathways are involved in the renewal of stem cells and their maintenance in adult malignancies. Accordingly, blocking these signaling pathways in preclinical studies has resulted in tumor regression, and each pathway is sought as a target in anticancer drug development. Interestingly, accumulation of nuclear β-catenin, indicative of Wnt pathway activity, was detected predominantly at the invasive front of colon cancer as opposed to within the rest of the tumor (52,53). Different levels of hedgehog signaling pathway activity clearly distinguish metastatic prostate cancer from the primary counterpart of the same tumor (54). In pancreas adenocarcinoma, metastasis could be abrogated by blocking the hedgehog signaling pathway without any significant change in the primary tumor (55).
What has been outlined above indicates the importance of identifying and tracking cells competent for metastasis because to do so is paramount to the goal of curing cancer. To do this requires developing imaging technologies that are specific to the metastatic cell while being sensitive enough to detect single cells or small groups of cells. This review will present some of the methods and imaging technologies that are being developed to meet these challenges.
IMAGING METASTATIC POTENTIAL WITH MRI
Various steps involved in the metastatic cascade have been revealed in exquisite detail with various imaging techniques (56–58). These imaging investigations of metastatic potential range in spatial scale from the subcellular and cellular levels (59) through to the organ system scale (60) and even to the level of the whole organism or patient (61). This section describes the use of MRI to understand the metastatic cascade and the effect of various tumor microenvironmental factors on the metastatic potential of a cell.
Studies using MRI to investigate metastatic potential can be broadly classified into 3 categories: chamber-type assays for studying cancer cell invasion, in vivo studies of animals bearing metastatic tumor xenografts, and studies tracking the fate of labeled metastatic cancer cells. This section briefly describes some of the MRI techniques used in these 3 categories and the insights we have gained using these approaches. The section ends with a discussion of recent studies that use some of these novel MRI approaches to identify and image metastases in the clinic.
Chamber-Type Assays for Studying Cancer Cell Invasion
Cancer cells invade by secreting proteolytic enzymes that break down basement membrane and the extracellular matrix (ECM). This invasive potential is often assayed by determining the penetration of cancer cells into reconstituted basement membrane gel (Matrigel [BD]/ECM gel). Cancer cell invasion can then be quantified by counting the number of cells that invade ECM gel-coated filters over a certain time. However, most traditional assays do not permit evaluation of the metabolic state of tumor cells, nor do they allow the dynamic characterization of invasion in the same sample under controlled microenvironmental conditions or after administration of various therapies.
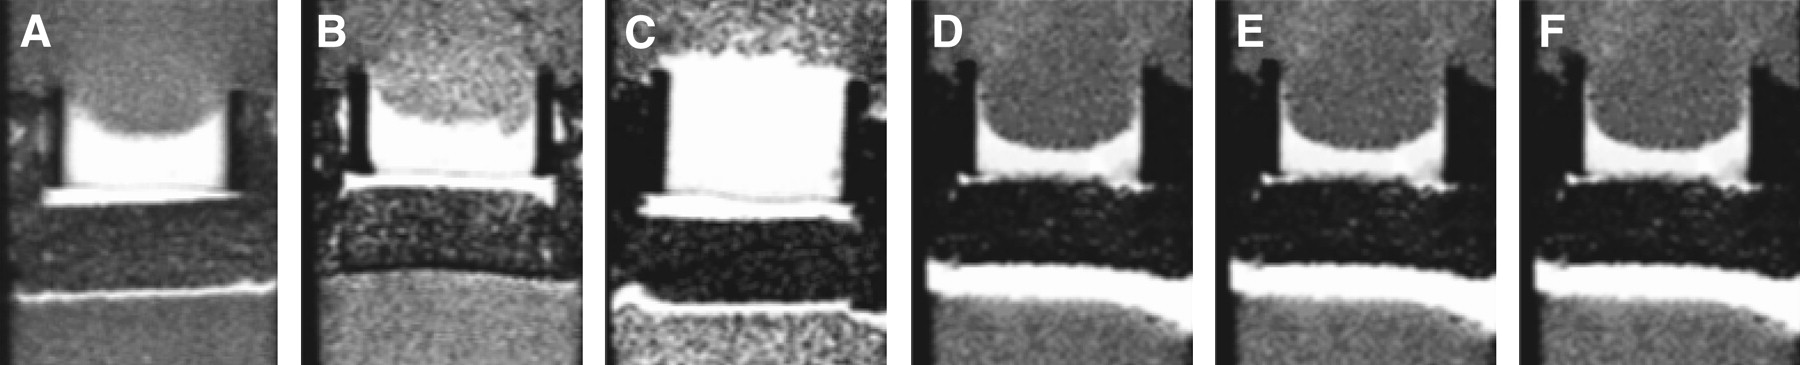
Therefore, we have developed an invasion assay dubbed the metabolic Boyden chamber assay (62), to track dynamically the invasion of cancer cells into ECM gel while concurrently characterizing oxygen tension and other physiologic and metabolic parameters. In this assay, 1H, 31P, and 19F MRI experiments of cancer cells continuously perfused with cell culture medium are performed. This system enables the control of oxygen tension under 1.5%, which is necessary to evaluate the impact of the hypoxic tumor microenvironment on cancer cell invasion. The incorporation of perfluorotripropylamine doped alginate beads into the ECM gel enables the direct measurement of oxygen tension in the sample using 19F MRI relaxometry (63). T1-weighted 1H MRI scans enable the dynamic tracking of changes in the integrity of the ECM gel due to invasion and degradation (Fig. 2). The 1-dimensional distribution of invading cells in the sample is obtained from the profile of intracellular water measured with 1-dimensional imaging along the length of the sample. A quantitative index of invasion can then be calculated from these cellular profiles. Finally, localized proton spectra of intracellular water and metabolites can be obtained from the sample, and the energy status of the cells, pH, and levels of choline phospholipid metabolites can be obtained from 31P MRI spectra (64). Recently, using this MRI-compatible invasion assay Ackerstaff et al. demonstrated that the antiinflammatory agent indomethacin reduced invasion and altered metabolism in a human breast cancer cell line, further demonstrating the versatility of this approach for testing the effect of therapies (65).

Metabolic Boyden chamber assay demonstrating differences in invasiveness among 6 different cancer cell lines that included 3 human breast cancer lines (MDA-MB-435 [A], MDA-MB-231 [B], and MCF-7 [C]), 1 rat prostate cancer cell line (MatLyLu [D]), and 2 human prostate cancer cell lines (PC-3 [E] and DU-145 [F]) at approximately 47 h. T1-weighted MR images show the bright Matrigel layer, which is significantly degraded by all cell lines except MCF-7. (Adapted with permission of (70).)
Finally, another variant of the MRI-compatible chamber assay was used to characterize human umbilical vein endothelial cell (HUVEC) motility, invasion, and network formation in response to the presence of cancer cells (66). In this assay, HUVECs were labeled with a superparamagnetic iron oxide contrast agent and cocultured with MDA-MB-231 breast cancer cells in the presence of ECM gel. MRI enabled the characterization of invasion into the ECM gel by HUVECs in response to paracrine factors secreted by MDA-MB-231 cancer cells, as well as tubule formation by HUVECs. In the absence of cancer cells, no invasion of the ECM gel by the HUVECs was observable. Such MRI-compatible assays are indispensable tools for noninvasively assessing cellular interactions between cancer and stromal cells, the role of microenvironmental factors such as hypoxia and pH, the role of angiogenic or antiangiogenic cytokines, and the effects of various therapeutic agents on metastatic potential and invasion.
In Vivo Studies of Animals Bearing Metastatic Tumor Xenografts
Several studies have established a correlation between areas of the most intense neovascularization, as assessed by determining the microvessel density on pathologic sections, and metastatic potential (67,68). However, the microvessel density technique relies on the availability of tissue specimens and cannot be used for repeated measurements of the dynamic process of angiogenesis in vivo, nor does it convey any information about the functional status of angiogenic vessels. Functional information about the vasculature, not readily available from histologic sections, can be obtained with contrast-enhanced MRI to exploit for therapy or prevention of metastasis (69). We demonstrated that human breast and prostate cancer xenografts preselected for differences in their invasive and metastatic characteristics established correspondingly different vasculatures (70). In this study, the vascular volume and permeability of human breast and prostate cancer xenografts were characterized using MRI of the intravascular contrast agent albumin-gadolinium diethylenetriaminepentaacetic acid. Concurrent studies with the metabolic Boyden chamber assay, described above, confirmed the differential invasiveness of these cell lines. The metastatic tumors were found to form vasculature with significantly higher permeability or vascular volume, and this elevated permeability profile matched their levels of vascular endothelial growth factor (VEGF) expression. Within tumors, regions of high vascular volume usually exhibited low permeability, whereas regions of low vascular volume were seen to exhibit high permeability (Fig. 3). These data seem to indicate that although invasion was necessary, without adequate vascularization it was not sufficient for metastasis to occur.

Coregistered MRI maps of vascular volume (red) and vascular permeability (green) for 6 different tumor xenograft models from cell lines shown in Figure 1. Paucity of yellow regions (representing areas concurrently exhibiting elevated vascular volume and permeability) indicates that regions with high vascular volume were significantly less permeable and regions of high permeability consistently exhibited lower vascular volumes. Data from this study collectively indicated that cancer cells expressing both highly invasive and elevated angiogenesis represented the most lethal phenotype. (Adapted with permission of (70).)
The presence of lymph node metastasis significantly influences the prospects of breast cancer patients, with distant metastasis more likely to develop in lymph node–positive patients (71). The ECM presents one of the first barriers against the metastasizing cancer cell, which invades surrounding tissue and metastasizes by secreting a variety of proteolytic enzymes such as matrix metalloproteinases (MMPs) or by inducing tumor stromal cells to secrete the same (72–74). Consequently, understanding the factors governing delivery and transport of macromolecules through the ECM of solid tumors and at the tumor–host tissue interface is crucial for elucidating the factors affecting metastatic potential. We recently developed a noninvasive method for characterizing the extravascular transport of macromolecules through the ECM of solid tumors in vivo using MRI, to understand better the role of the tumor-associated lymphatic system in the clearance of macromolecules and interstitial fluid (75). We then used this method to characterize differences in angiogenesis (vascular volume, permeability surface area product) and lymphatic-convective transport (macromolecular fluid transport rates or volumes, fraction of draining or pooling voxels) in vivo, in 2 human breast cancer xenografts preselected for differences in their invasiveness (76). MDA-MB-231 tumors not only exhibited higher vascular volume and permeability than the less invasive MCF-7 tumors but, consistent with their highly invasive phenotype, also exhibited elevated macromolecular drainage in the ECM (Figs. 4A and 4B), with lymphatic vessels that were frequently clogged with cancer cells (Figs. 4C and 4D). Thus, although the tumoral lymphatic vessel area was higher in MDA-MB-231 tumors than in MCF-7 tumors, this macromolecular drain was mostly via convection through the ECM. Therefore, macromolecular transport most likely followed paths of least resistance through the ECM. The increased drainage area in the more invasive tumors with a greater capacity for degrading ECM was consistent with that possibility. Collectively, the in vivo and ex vivo data suggest that the higher incidence of lymph node (Figs. 4E and 4F) and lung (Figs. 4G and 4H) metastases observed in MDA-MB-231 tumors than in MCF-7 tumors was most likely a consequence of their differential invasiveness, reduced ECM integrity resulting in increased drainage areas, and increased lymphatic vessel area. In vivo MRI techniques of the kind described here are rapidly expanding our understanding of the various factors affecting metastatic potential such as angiogenesis, integrity of the ECM, the ECM–lymphatic continuum, and lymphangiogenesis.

(A) Representative functional MRI maps of pooling and draining voxels for MDA-MB-231 and MCF-7–bearing animals. (B) Box-and-whisker plot comparing volume of extravasated fluid pooled or drained between MDA-MB-231 and MCF-7 xenografts (*P < 0.1 with 1-sided Mann–Whitney U test). (C) Phase contrast image obtained at ×40 from 5-μm-thick hematoxylin-stained MDA-MB-231 tumor section overlaid with same tumor section stained with LYVE-1 (lymphatic vessel marker), with transparency of latter adjusted to enable visualization of lymphatics packed with tumor cells. (D) Photomicrograph obtained at ×40 from 5-μm-thick hematoxylin- and eosin-stained axillary lymph node from MDA-MB-231–bearing animal, scored positive for presence of cancer cells (arrows). (E) Photomicrograph obtained at ×40 from 5-μm-thick hematoxylin- and eosin-stained lung from MDA-MB-231–bearing animal scored positive for presence of cancer cells (arrows). (F) Similar image obtained at ×40 from 5-μm-thick hematoxylin-stained MCF-7 tumor section overlaid with image of same tumor section stained with LYVE-1, with transparency of latter adjusted to enable visualization of lymphatics that have few, if any, tumor cells. (G) Photomicrograph obtained at ×40 from 5-μm-thick hematoxylin- and eosin-stained axillary lymph node from MCF-7–bearing animal, scored negative for presence of cancer cells. (H) Photomicrograph obtained at ×40 from 5-μm-thick hematoxylin- and eosin-stained lung from MCF-7–bearing animal scored negative for presence of cancer cells. (Adapted with permission of (76).)
Studies Tracking the Fate of Labeled Metastatic Cancer Cells
There has been a plethora of studies using a variety of imaging techniques for visualizing various aspects of metastasis at or near the single-cell level in vivo. Because of the inherently high spatial resolution, most of these use optical techniques in conjunction with fluorescent proteins (77) and have provided new insight on tumor cell motility (59), invasion and metastasis (60), and angiogenesis (78). Although there is much extant literature on cell-labeling and -tracking experiments with MRI in vivo (79), these have been limited primarily to the area of stem cell transplantation in different disease models (80). However, a recent study has reported one of the first applications of in vivo MRI to track the fate of labeled cancer cells in a murine model of breast cancer metastasis to the brain (57). In that study, the investigators labeled MDA-MB-231BR cells (an MDA-MB-231 clone selected for its ability to metastasize to the brain) with micron-sized iron oxide particles. Using a specially optimized MRI protocol (57), they were able to track the metastatic cascade from the single-cell stage through metastatic growth. Additionally, they were able to show that most labeled cells delivered to the brain were lost, with metastases forming from only a small subset of the injected cells. Because the MDA-MB-231BR cells were also transfected with enhanced green fluorescent protein (GFP), the authors were able to correlate single cells detected by MRI with confocal microscopy. Such studies have ushered in a powerful new tool for noninvasive, in vivo quantification and monitoring of the metastatic cascade, factors affecting metastatic potential, and the development of novel therapeutics to prevent metastases.
Clinical MRI of Metastatic Potential
Although most of these novel MRI techniques were used to characterize factors affecting metastasis in animal models, several different MRI techniques are currently in use for characterizing metastases in patients. These techniques range from screening the entire body of the patient for the detection of bone metastasis using whole-body MRI (61) to the use of contrast-enhanced MRI for the preoperative detection of axillary lymph nodes in breast cancer patients (81) and the noninvasive detection of clinically occult lymph node metastases in prostate cancer with highly lymphotrophic superparamagnetic iron oxide nanoparticles (82). Although by no means exhaustive, these examples clearly demonstrate the feasibility and utility of MRI techniques and novel contrast mechanisms for investigating the factors and mechanisms affecting metastatic potential.
EMERGING RADIOPHARMACEUTICAL-BASED METHODS
Clinically available PET radiopharmaceuticals for imaging tumor glucose metabolism and hypoxia may provide surrogate markers for monitoring tumor metastatic potential. The development of clinical radiopharmaceuticals that target angiogenesis is an emerging area for imaging metastatic potential. Other classes of radiopharmaceuticals, which target metastasis more directly, are under intense preclinical evaluation.
Current Clinical Radiopharmaceuticals for Imaging Metastatic Potential
A variety of physiologic processes linked to tumor aggressiveness, if imaged, could provide insight into the metastatic potential of primary tumors. Among such processes that have been evaluated clinically are glucose metabolism, hypoxia, angiogenesis, and the activity of MMPs within the tumor microenvironment.
Glucose Metabolism.
Please refer to the comprehensive review of 18F-FDG-based PET by Kelloff et al. for a more detailed discussion (83). Imaging of tumor glucose metabolism with 18F-FDG PET has gained widespread use for cancer diagnosis, staging, restaging, and increasingly for therapeutic monitoring (84–86). Measuring the tumor uptake of 18F-FDG using the standardized uptake value can serve as a prognostic marker in certain tumors (87–89). In non–small cell lung cancer, the maximum standardized uptake value for 18F-FDG has been demonstrated to be an independent prognostic survival factor (90) and has been correlated with high HIF-1α expression (91). 18F-FDG uptake has also been correlated with transformation to a more aggressive phenotype in certain cancers including leukemia, lymphoma, neuroendocrine tumors, and papillary carcinoma of the thyroid (83,92,93).
Although tumor glucose metabolism has been correlated with the expression of HIF-1α (94), 18F-FDG cannot reliably differentiate chronically hypoxic from normoxic tumors (Fig. 5) (95). Factors other than HIF-1α such as vascularization, tumor cell density, proliferation rate, and number of lymphocytes may explain variations in 18F-FDG tumor uptake (96). Independent of hypoxia, expression of certain oncogenes such as c-myc, src, and ras and elements of the PI3K/AKT pathway have been associated with activation of glycolysis (97–99). Accordingly, although not a direct indicator of metastasis, tumor 18F-FDG uptake may represent a marker of metastatic competence, which may identify primary tumor sites at higher metastatic or invasive potential.

Transaxial 18F-FMISO PET, transaxial 18F-FDG PET, and sagittal 18F-FDG PET images of patient with normoxic tumor and patient with hypoxic tumor. 18F-FMISO is taken up in hypoxic tumors (arrows) but not in normoxic tumors. (Adapted with permission from (95).)
Hypoxia.
As tumors grow beyond a critical size, thought to be about 1–2 mm, they outgrow their blood supply, resulting in pericentral hypoxia. The hypoxic tumor microenvironment is thought to exert a selective pressure altering the malignant potential of tumors by expression of HIF-1α, leading to a more aggressive phenotype with activation of angiogenesis, anaerobic metabolism, and other survival factors (100–102). The increase in aggressive phenotype suggests that the ability to image hypoxia directly could shed light on the metastatic potential of certain tumors. Several radiopharmaceuticals designed to target hypoxia have been developed, including the nitroimidazoles 18F-fluoromisonidazole (18F-FMISO) and 18F-fluoroazomycin arabinoside (18F-FAZA) and the copper complexes 60/62/64Cu-ethylthiosemicarbazone (Cu-ATSM), and have been evaluated clinically for tumor hypoxia imaging (103,104).
18F-FMISO has been more closely correlated with tumor hypoxia with a partial pressure of oxygen of less than 10 mm Hg, with tissue retention dependent on nitroreductase activity (reduction status of the NO2 group on the imidazole ring) (105). Clinical 18F-FMISO PET studies have been performed on a variety of malignancies including glioma, head and neck cancers, lung cancer, and sarcomas (106–108). 18F-FMISO PET in patients with sarcoma and head and neck cancers demonstrate a correlation of tumor uptake of the radiopharmaceutical with poor outcome after radiation and chemotherapy (105,109). Limitations of 18F-FMISO PET include a relatively low ratio of hypoxic tumor to normal tissue due to slow blood clearance (110).
18F-FAZA is a more recently developed nitroimidazole-based radiopharmaceutical for hypoxia and has faster clearance than 18F-FMISO, allowing for better hypoxia-to-normoxia contrast in vitro and in murine tumor models (111). In preclinical studies, 18F-FAZA demonstrated increased retention in hypoxic tumors and correlated with tissue oxygen tension (112). Imaging of patients with 18F-FAZA before therapy predicted the success of hypoxia-directed radiochemotherapy using tirapazamine, a hypoxia-specific agent (113). A pilot study of 18F-FAZA PET in patients with head and neck cancer was demonstrated to be feasible, generating readily interpretable images (Fig. 6) (114).

18F-FAZA–based imaging of hypoxia in planning of radiation therapy for head and neck tumor: FAZA PET (A and C), CT (B), and PET/CT (D). In B, large primary tumor (yellow arrow) and retropharyngeal lymph node metastasis (red arrow) demonstrate heterogeneous 18F-FAZA uptake. In C, blue region of interest depicts highest radiopharmaceutical uptake whereas yellow region delineates lowest. Dotted red line in D outlines tumor anatomically, and solid red line shows tumor, with a tumor-to-muscle ratio of more than 1.5. (Adapted with permission of (114).)
The ability of the copper thiosemicarbazones to be retained within tumor is largely attributable to the low oxygen tension and subsequent altered redox environment of such tissues, that is, the presence of increased levels of reduced nicotinamide adenine dinucleotide. Washout of these agents from normoxic tissues is rapid, resulting in high-contrast images (115). However, Cu-ATSM accumulation is thought to reflect a high concentration of reducing agents as opposed to the actual partial pressure of oxygen (116), and tumor uptake may depend on the cell type under investigation (117). Clinical studies have demonstrated that 60Cu-ATSM PET may act as a prognostic indicator for response to therapy in lung and cervical cancers (118,119).
Angiogenesis.
Because the ability for tumors to invoke their own blood supply is necessary for their survival outside the primary site, imaging of angiogenesis could provide a surrogate marker for metastatic potential and is one of the most active areas in cancer radiopharmaceutical development. Several excellent reviews of the development and use of radiopharmaceuticals for imaging angiogenesis exist (120,121). Two prominent targets that have been successfully imaged in humans include the VEGF and the integrin αvβ3 receptors.
VEGF-A is an endothelium-specific angiogenic protein that is expressed in a variety of human tumors (122). VEGF binds to VEGF receptor 2, which is overexpressed on the tumor endothelium during angiogenesis. A humanized version of a monoclonal mouse anti-VEGF antibody, HuMV833, was radiolabeled with 124I and used for PET to evaluate the biodistribution and biologic effects of HuMV833 in a phase I trial (123). The authors reported markedly heterogeneous antibody distribution and clearance between patients and between tumors within the same patient, with implications for the design of antiangiogenesis therapy trials. A radiolabeled variant of VEGF-A, 64Cu-tetraazacyclododecanetetraacetic acid-VEGF121, was recently developed and demonstrated VEGF receptor–specific uptake in mouse xenograft models of human gliomas (124). Interestingly, smaller U87MG tumors (4–6 mm) demonstrated a high but still lower degree of radiopharmaceutical uptake than did larger tumors (10–15 mm), which demonstrated close correlation with the VEGF receptor 2 level measured by ex vivo histopathology.
Integrin αvβ3 is a cell surface receptor with an exposed arginine-glycine-aspartate (RGD) binding site for a variety of ECM proteins (125). It is expressed at low levels in epithelial cells and mature endothelial cells but is selectively and highly expressed on activated endothelial cells in the neovasculature of tumors (126). Integrin αvβ3 correlates well with progression and invasion of a variety of tumors including glioma, breast cancer, and melanoma (127–129) and as such may represent a reasonable surrogate marker for metastatic potential.
A variety of PET- and SPECT-based radioligands using the RGD motif for binding to αvβ3 have been developed, including 18F-galacto-RGD and 64Cu-tetrameric RGD for PET (126). 18F-galacto-RGD PET of αvβ3 expression in patients with solid tumors (musculoskeletal sarcoma, melanoma, head and neck cancer, glioblastoma, breast cancer) demonstrated clear uptake in tumors with αvβ3 expression, with correlation of standardized uptake value and tumor-to-background ratio to microvessel density (Fig. 7) (130). Preclinical evaluation of 64Cu-tetrameric-RGD demonstrated high affinity and specific uptake in integrin-positive U87MG glioblastoma cells in vitro and in vivo (131). Abegrin, a humanized monoclonal antibody against human integrin αvβ3, is currently in clinical trials for cancer therapy. A 64Cu-labeled version of Abegrin demonstrated high uptake in αvβ3-positive U87MG tumor cells (124). Of note, the αvβ3 integrin also plays a role in mediating angiogenesis in chronic inflammatory processes as well as in cancer, with 18F-galacto-RGD having been used to image chronic inflammation (132).

18F-galacto-RGD PET images of woman with lymph node metastasis from melanoma (white arrow). Intense radiopharmaceutical uptake is seen in lesion (black solid arrow). Minimal uptake is seen in urinary bladder (red arrow) and gallbladder (dotted arrow). (Adapted with permission of (130).)
MMPs are zinc- and calcium-dependent proteolytic enzymes that catalyze the breakdown of the ECM and are involved in tumor growth and invasion, with similar functions in benign disease (133). There are more there 20 known MMPs, based on their size and substrate specificities. A variety of SPECT and PET low-molecular-weight inhibitors of MMPs has been developed and evaluated preclinically in tumor and atherosclerosis models, recently detailed in comprehensive reviews by Wagner et al. and Van de Wiele et al. (133,134). To date, only 111In-DTPA-N-TIMP2 (a 127 amino acid recombinant human TIMP-2 (N-TIMP-2) conjugated to the acid N-terminal domain with the bifunctional chelator diethylenetriamine pentaacetic acid (DTPA)) has been used clinically, and that in a pilot study involving patients with Kaposi sarcoma (135). None of the lesions in the patients of that study demonstrated significant radiopharmaceutical uptake. The limited results available for imaging MMPs using radiopharmaceuticals may be due to the propensity of existing compounds for nonspecific binding, the need for improved animal models of metastasis, a lack of verification of MMP within the tumor models attempted, and the need for temporal correlation of MMP expression with tumor progression.
Preclinical Radiopharmaceuticals for Imaging Metastatic Potential
The gastrin-releasing peptide receptor is highly expressed in a variety of tumors such as lung, prostate, breast, stomach, pancreas, and colon and is thought to play an important role in carcinogenesis, including angiogenesis, cell migration, and cell adhesion (136). Bombesin, a 14-amino-acid neuropeptide, is known to have high-affinity binding to gastrin-releasing peptide receptors. A recently developed 99mTc-labeled bombesin analog has been studied in preclinical tumor models and found to have a more favorable biodistribution than an earlier 99mTc-bombesin reported by the same authors (137). 64Cu-, 68Ga- and 18F-labeled bombesin analogs for PET have also been reported (138–141). 18F-bombesin has been evaluated in an experimental model of prostate cancer, demonstrating tumor-specific binding at early time points (139).
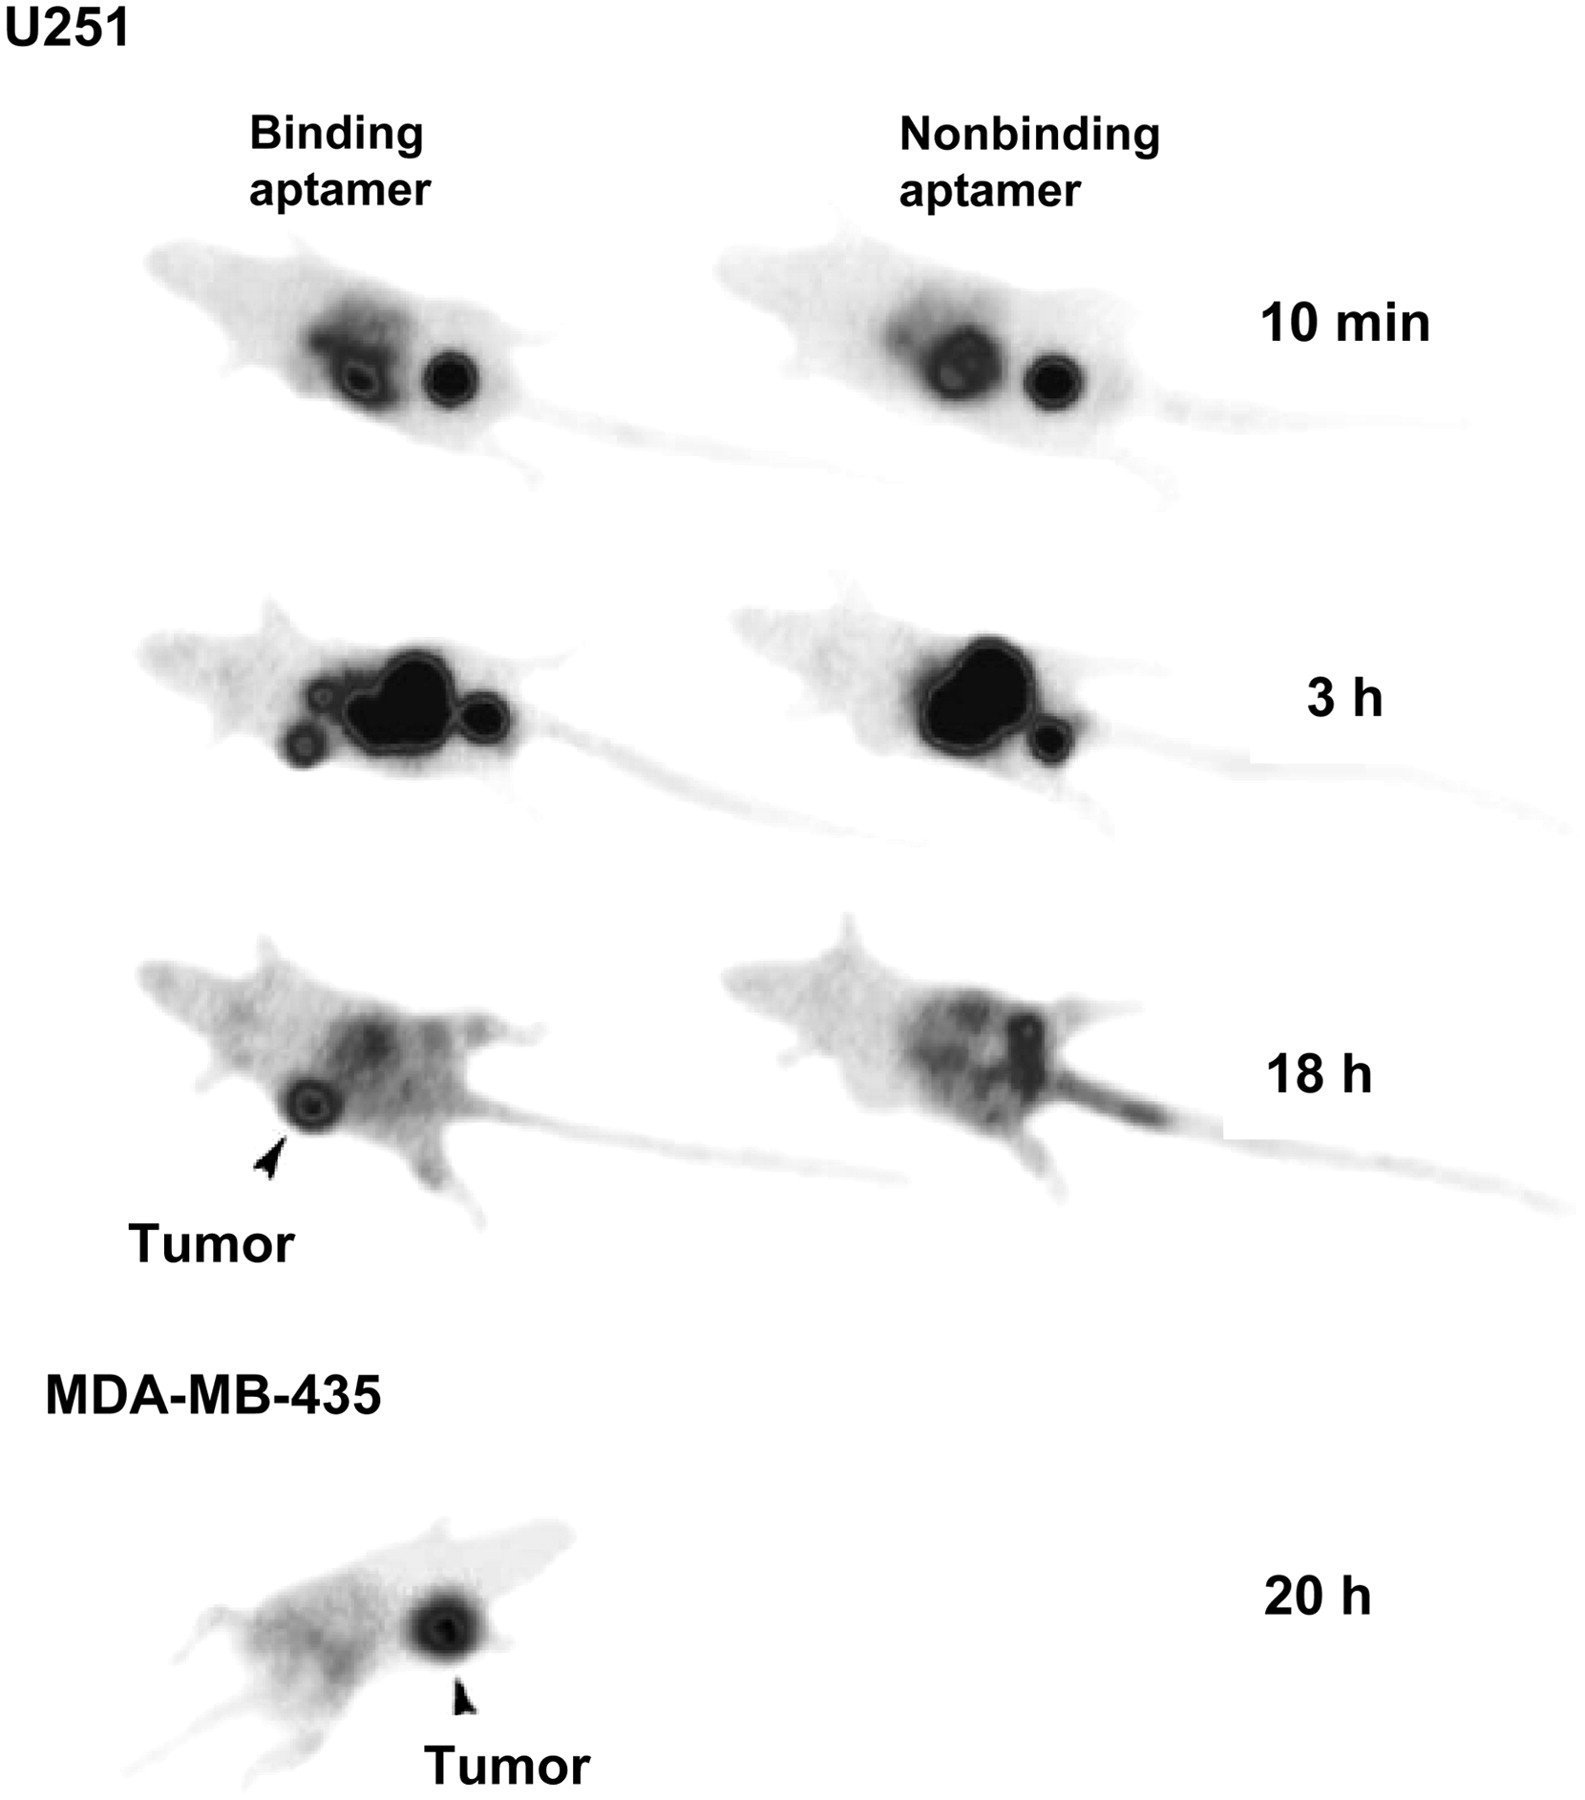
Tenascin-C, an ECM molecule responsible for modulating adhesion, is highly expressed in the microenvironment of most tumors and is thought to be involved in tumorigenesis and progression to metastasis (142). A 99mTc-labeled aptamer targeting tenascin-C demonstrated rapid receptor-mediated uptake in a variety of tumor types including glioblastoma, breast, and colon cancer xenografts (143) (Fig. 8). Particularly interesting was demonstration in this study that modification of the radiometal chelator altered tissue uptake and clearance patterns, allowing for further pharmacokinetic optimization of imaging agents of this class.

Tenascin aptamer imaging. U251 glioblastoma tumor is faintly visible at 10 min, prominent at 3 h, and brightest structure at 18 h. MDA-MB-235 tumors could also be visualized. (Adapted with permission of (143).)
CXCR4 is a chemokine receptor that has been shown in recent studies with its ligand, stromal-derived factor 1, to play an important role in tumor metastasis (144–146). An 111In-labeled peptide targeting CXCR4 was shown to accumulate in a CXCR4-expressing pancreatic tumor xenograft model (147). 125I-stromal-derived factor 1α has been shown to target human neuroblastoma cells in vitro (148).
IMAGING METASTASES AND METASTATIC POTENTIAL WITH OPTICAL TECHNIQUES
Molecular Oncologic Imaging with Optical Techniques
Modeling human cancers in mice has a profound impact on our understanding of disease progression and on the development of new therapies. As these models become ever more relevant, imaging them noninvasively promises to provide even greater insights into human disease. Arguably the most important advances in molecular imaging research over the past decade have involved the use of optical imaging in relevant animal models, particularly bioluminescence imaging (BLI) as it has been applied to cancer. The development of fluorescent proteins and luciferase enzymes as efficient in vivo imaging reporters began with biochemical characterization studies in the 1970s. The cloning of GFP allowed investigators subsequently to mutate it, which has generated multiple forms of GFP, enhanced for imaging in vivo (149–151). Thus, a monomeric GFP with increased expression, enhanced fluorescence in mammalian cells, and a single excitation maximum (λex) centered at a wavelength of 490 nm and an emission maximum (λem) at 515 nm has been widely used. Further mutation research has produced red, blue, and yellow fluorescent proteins. This has greatly increased the variety of fluorescent protein–based imaging applications that are now used.
GFP-based, real-time, longitudinal optical tracking of tumor growth in mouse xenograft models has been investigated in several laboratories (152–157). For instance, successful optical tracking of the metastatic process in a lymphoma mouse model, with GFP as the reporter, has been described (158). However, GFP generally has been visualized in organs such as the lung or liver only during postmortem examinations, because of the optical properties of tissue, which strongly absorb at wavelengths where GFP is excited and is fluorescent (158–161). Accordingly, the GFP signal is attenuated as a function of its depth in tissue. However, the large absorption cross-section of GFP makes it a good candidate for multiphoton imaging using excitation at a λ of 980 nm, that is, in the near-infrared region of the spectrum, which circumvents the tissue absorption problem, and future in vivo applications might be performed at these wavelengths. Along these lines, researchers are developing fluorescent proteins with λexs and λems near or above 600 nm, that is, in the red to far-red region of the spectrum (162–165). This will greatly extend the future use of fluorescent protein–based imaging by allowing for much deeper imaging capabilities.
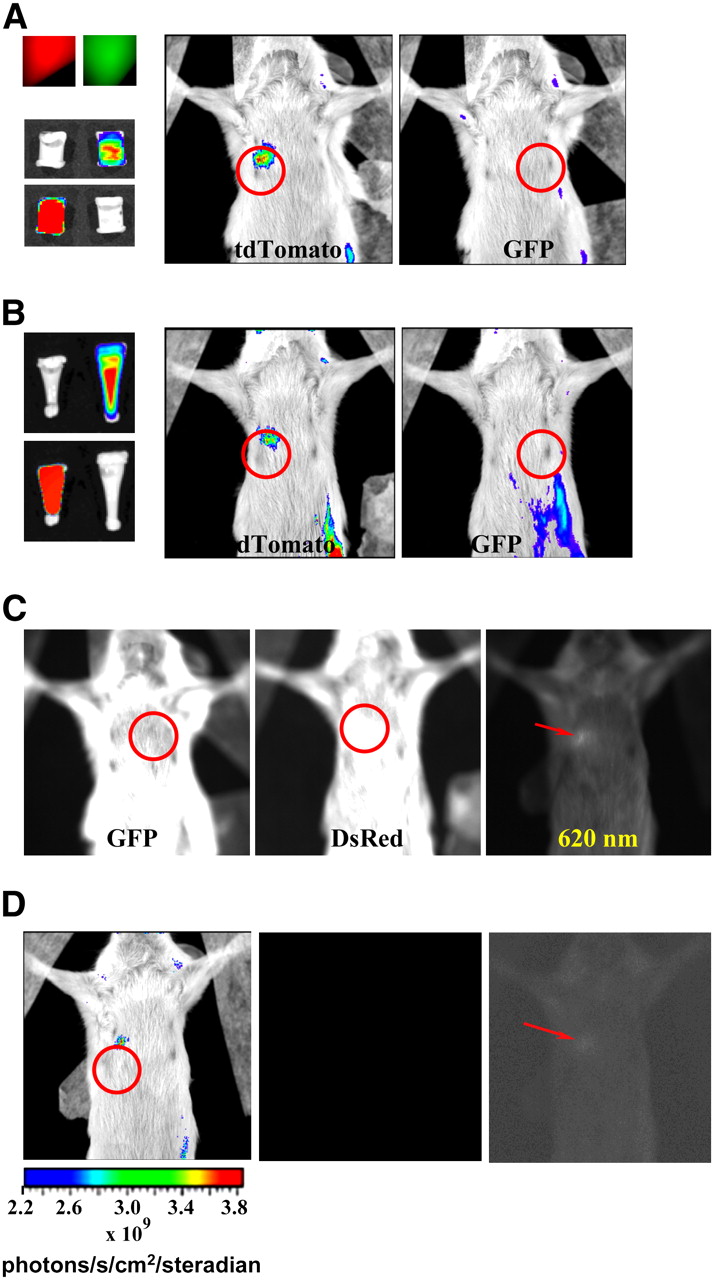
We generated a novel transgenic cell line derived from the aggressive MDA-MB-231 breast cancer cell line that stably expresses a new bright orange-red fluorescent protein reporter (166). As demonstrated in Figure 9, the use of MDA-MB-231-tdTomato cells allows for more efficient and sensitive imaging than GFP-based technologies because GFP detection is hampered by interference from autofluorescence and absorption due to detection at wavelengths near 500 nm. The bright inherent fluorescence of MDA-MB-231-tdTomato cells is detected at wavelengths above 600 nm (166). This increases the sensitivity of detection, because background autofluorescence and absorption, due principally to oxy- and deoxyhemoglobin at wavelengths less than 600 nm, are minimized (161,167). In addition, it was demonstrated that GFP is approximately 5 times less bright than tdTomato and is consequently less sensitive to detection even under optimal conditions. Small numbers of fluorescent cancer cells could be identified in tissue sections or whole-blood samples simply through fluorescence microscopy. This study underscores the high sensitivity of optical imaging in the near-infrared range, suggesting that near-infrared–emitting dyes and probes are necessary for optical tracking of cells in vivo.

Comparison of detection of tdTomato fluorescence and GFP fluorescence in mouse cadaver phantom with Xenogen IVIS 200 system. (A) Upper left image shows fluorescence from tubes packed with 100 × 106 cells expressing MDA-MB-231-tdTomato (red) or MDA-MB-231-GFP (green). Below these are false-color-overlay images (0.01-s exposure time) using either GFP filter set or DsRed set. White tubes in these images indicate that tdTomato did not fluoresce when GFP was being imaged and GFP did not fluoresce when tdTomato was being imaged. Mouse false-color-overlay images (regions of interest circled; 1-s exposure time) at center and right show that only tdTomato fluorescence could be detected from implanted tubes. (B) Panel showing similar results to those in A, only number of tdTomato cells used was 45 × 106 while number of GFP-expressing cells remained same. Implanted tubes are shown on left; red and green fluorescence was easily detected (0.01-s exposure times). (C) Unprocessed fluorescent images with 2.5-s exposure times show that autofluorescence from fur of SCID mouse depends on emission wavelength filter used. Tube implants were those shown in A (left image), B (center image), and tube containing 9.25 × 10⁶ cells expressing tdTomato (right image). Regions of interest are circled in first 2 cases. Left and center images show intense fur autofluorescence that masks detection of implanted fluorescence signals. Right image indicates that use of 620-nm emission filter allowed lowest number of tdTomato cells implanted to be detected (fluorescent signal indicated by arrow) above fur autofluorescence. (D) Images illustrating excellent sensitivity of optical imaging. False color overlay at left, with region of interest circled, shows detection of fluorescence signal from 9.25 × 10⁶ implanted tdTomato-expressing cells using 0.01-s exposure and 620-nm emission filter. Faint fluorescence from implant has been made visible by enhancing central image with PhotoShop (Adobe), as indicated by arrow in image at right.
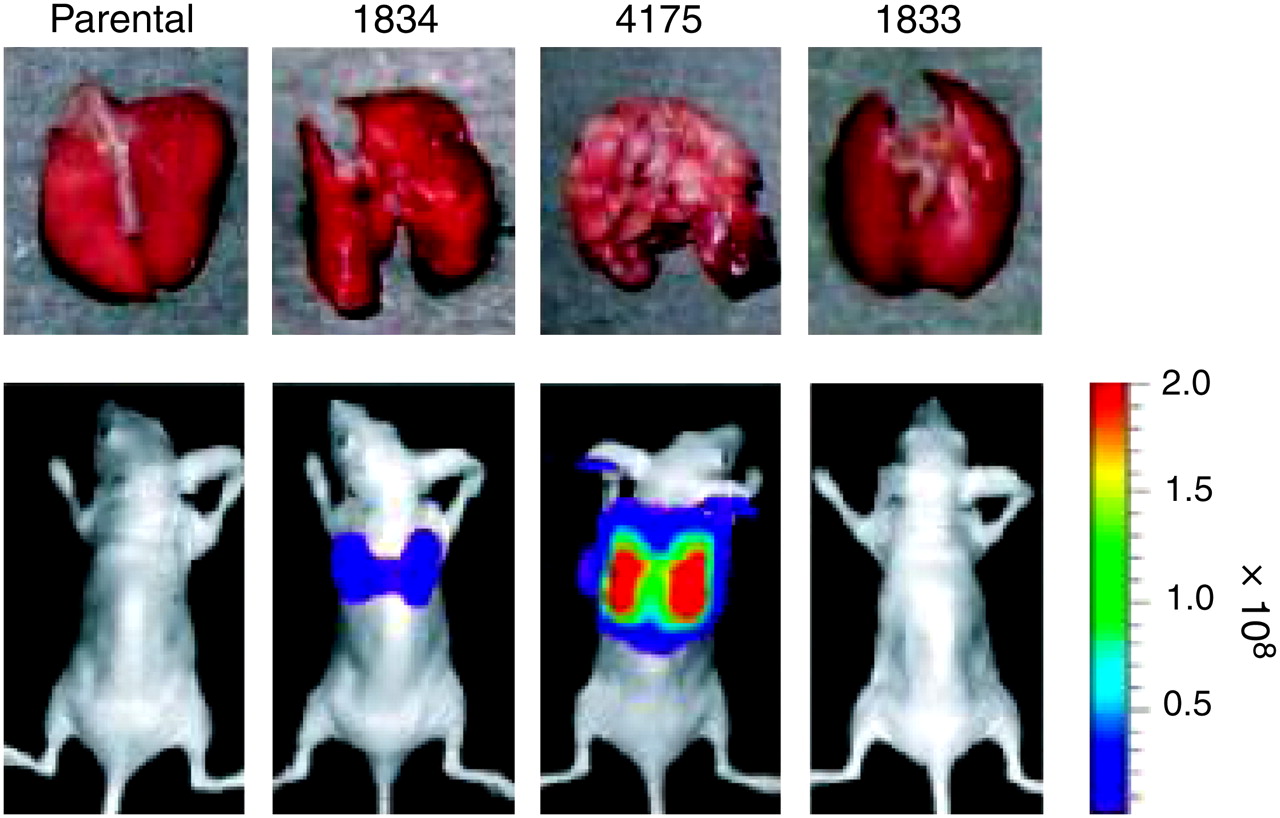
Firefly (Photinus pyralis) luciferase (fLuc) has been studied since the 1940s (168). As with GFP, its use in laboratory studies expanded significantly after the cloning of its complementary DNA (169). Unlike GFP, luciferases are enzymes that require a substrate for the generation of light. Luciferin is the substrate for fLuc, which also requires adenosine triphosphate, Mg2+, and O2. On reaction with luciferin, fLuc produces oxyluciferin, adenosine monophosphate, CO2, and light, forming the basis of in vivo BLI. This process is currently the most widely used method to image transgene expression in vivo (170). Mutated fLuc with increased expression in mammalian cells, better thermal stability, and no peroxisomal signal has been generated (171,172). Similar to work on GFP, mutation has provided red- and green-emitting fLuc mutants (173). Presently, several varieties of luciferase are being studied. Red and green luciferases from the click beetle (Pyrophorus plagiopthalamus), as well as a green Renilla luciferase, are being tested in mice (167). Zhao et al. demonstrated that fLuc was comparable to click beetle red luciferase and that both outperformed Renilla and click beetle green luciferases with respect to tissue penetration. This study also clearly underscored the advantages of imaging at wavelengths above 600 nm. Numerous luciferase-based optical imaging studies have been reported and have been focused primarily on tracking the movements of mammalian cells (174–177), prokaryotes (178), viruses (179), gene therapy (180), drug therapy (181), and tumor growth and metastasis (18,182). For example, luciferase as a reporter of metastases in a variety of mouse xenograft models has facilitated the identification of organ-specific metastatic markers (Fig. 10) (38).

Selection of breast cancer cells metastatic to lung. Representative lungs harvested at necropsy and BLI of indicated cell lines are shown after tail-vein injection. Color scale depicts photon flux (photons/s) emitted from xenografted mice. (Adapted with permission of (38).)
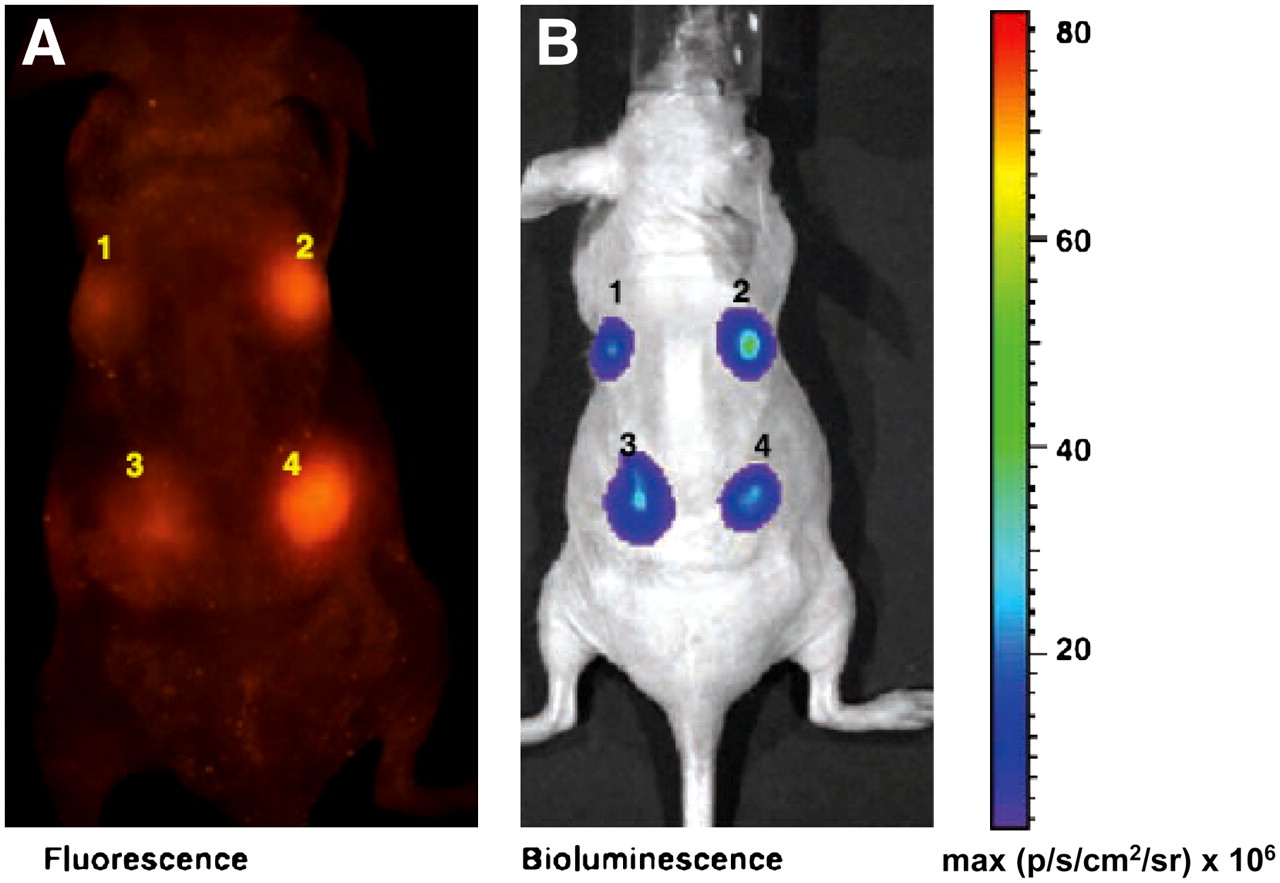
Currently, one has the option of using fluorescence or BLI or a combination of both for optical imaging studies. In addition, dual and triple reporter vectors that allow for multimodality imaging, for example, PET, fluorescence, and BLI, are in use (Fig. 11) (183). When considering which modality to use, it is important to note that fluorescent protein–based optical tracking of cells in mice has the advantage of not requiring a substrate. The need to administer substrates or targeting molecules complicates the imaging process in that the biodistribution and pharmacokinetics of such agents must be considered, and thus, doses, as well as dose timings, need to be optimized (170,184). If these reagents do not reach the cells that are to be imaged or are too diluted at the target cell, then false-negative results may occur. In addition, postmortem fluorescence microscopy facilitates fluorescent cell location and eliminates the need for staining cell-specific markers that might have been lost during the course of metastatic transformation. On the other hand, the optical properties of tissue have limited most GFP-based imaging to superficial lesions. Firefly-based BLI penetrates mammalian tissue to a greater depth than GFP fluorescence (159,160). In addition, unlike GFP, for which background autofluorescence is a problem, there is no bioluminescent background (160), which is also minimized when using fluorescence imaging at wavelengths above 600 nm. In any case, a comparison of fluorescence and bioluminescence optical imaging has shown that, given the proper corrections, both can give similar results (160). Another option has been the use of lacZ-expressing cells (185,186). However, this appears to be limited to ex vivo detection of fixed dead cells. There has been no evidence indicating that circulating cells can be detected with any of these techniques.

Comparison of expression of CMV-mtfl-mrfp1-wttk and CMV-mtfl-jred-wttk vectors by fluorescence and BLI in living mice. (A) Two and 4 million 293T cells were transiently transfected with CMV-mtfl-jred-wttk (left) and CMV-mtfl-mrfp1-wttk (right) vectors, respectively, and implanted on dorsal side of nude mouse (sites 1 and 2 have 2 million cells and sites 3 and 4 have 4 million cells) and imaged for fluorescence using Maestro system. Fluorescence signal from cells expressing CMV-mtfl-mrfp1-wttk was clearly visible (2 and 4). However, cells expressing CMV-mtfl-jred-wttk plasmid (1 and 3) show faint fluorescence signal. (B) Same mouse was then injected with D-luciferin and imaged for bioluminescence in Xenogen IVIS 200 optical system. Bioluminescence signal showed equal signal intensity by both groups of cells (2 and 4 vs. 1 and 3). (Adapted with permission of (183).)
Investigators using PET, SPECT, or MRI will recognize that in order for optical imaging to be a comprehensive photon-based imaging modality, tomographic reconstructions will need to be generated. An example of a 3D reconstruction of live-animal optical imaging based on the MDA-MB-231-tdTomato data is shown in Figure 12. Such tomographic reconstruction capability is presently available on the latest commercial instruments, and development of such reconstruction technologies is being pursued in various laboratories (187,188). As accurate 3-dimensional reconstruction becomes routine, optical imaging—particularly for cell-tracking studies—will be applied with increasing frequency.
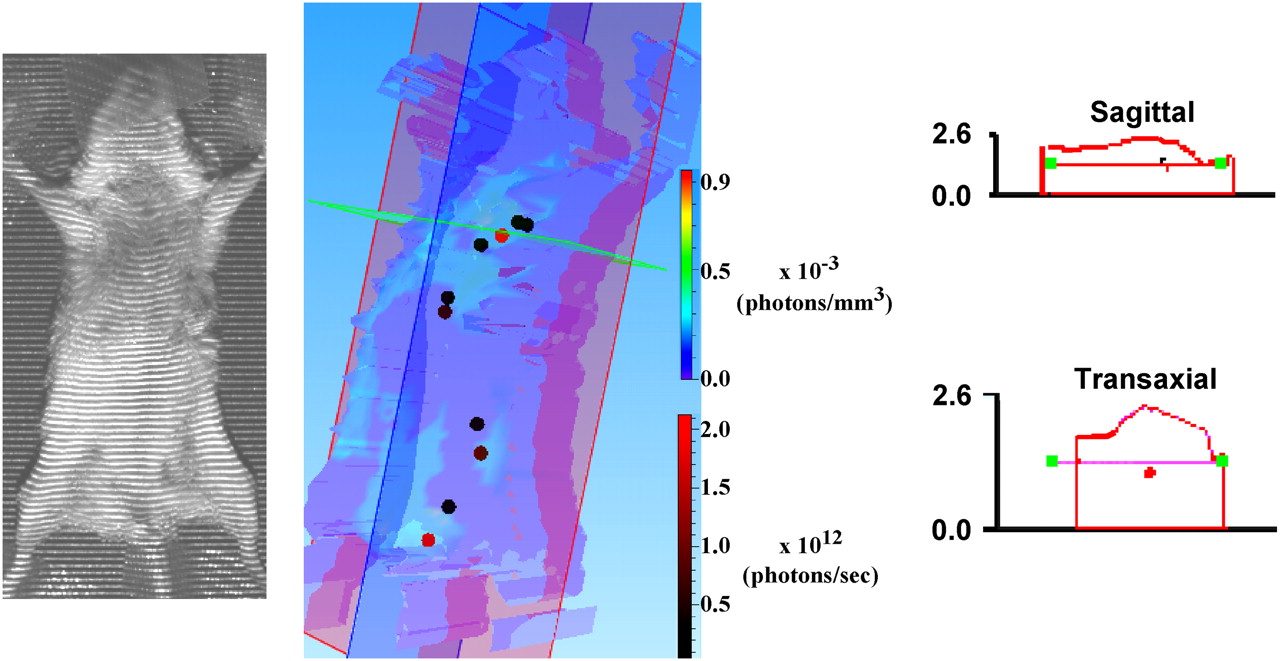
Image reconstruction to estimate penetration depth of fluorescent signal from tdTomato protein. Three-dimensional (3D) reconstruction is shown in center panel. False-colored contour map represents photon densities that have been assigned coloration on basis of multicolored bar spectrum (photons/mm3 × 10−3) shown at right of reconstruction. To obtain this map, program fills structure image (left panel) with cubic voxels and scores fluorescence density of each voxel. Red and dark circles within reconstruction indicate sources of fluorescence that lay on selected coronal (violet), sagittal (blue), and transaxial (green) planes. As seen from black-to-red bar spectrum at lower right of reconstruction, intensity of fluorescence from these sources is on order of 1012 photons/s. Enlarged sagittal and transaxial sections indicate that dorsal–ventral depth of animal was about 2.5 cm. Center (red dot) of fluorescent source from within rib cage cavity was about half way through animal or approximately 1.0 cm from ventral surface. 3D reconstructions were performed using 3D analysis software (Living Imaging; Xenogen Corp.) according to instruction manual from images collected at week 15, with 2.5-s exposure, and at emission wavelengths of 620 and 660 nm. 3D reconstruction program was designed for use with bioluminescence data and does not account for attenuation of fluorescence excitation signal by absorption and scatter. However, because emission wavelengths used (620 and 660 nm) are similar to those used during luciferase-based BLI, and photon densities and source intensities are similar to those observed with BLI, we have been advised that these results likely represent good first estimate of tissue penetration (communications with technical support at Xenogen Corp.).
Optical Techniques for Imaging Metastatic Potential
Three recent studies enable imaging of metastatic potential, each with an emphasis on a different aspect of optical imaging. All are preclinical. Brakenhielm et al. developed a new metastatic model for prostate cancer in which tumor cell lines not normally metastatic were transfected with VEGF-C, which promotes lymphangiogenesis (189). Turning on that “lymphangiogenic switch” could be visualized clearly with optical imaging because the cells were also transfected with fLuc as the reporter gene (Fig. 13). This system was used to compare the metastatic potentials of LAPC-4, LAPC-9, PC3 and CWR22Rv-1. After tumor implantation, the animals were imaged at weekly intervals for several months, truly enabling visualization of the earliest metastatic deposits and study of the role of lymphangiogenesis in mediating metastasis. By transfection with VEGF-C, LAPC-9 tumors proved as metastatic as the other lines, which were normally highly metastatic. The second study used a fluorescent version of chlorotoxin, (CTX:Cy5.5) to enable tumor “painting,” which could be useful intraoperatively because Cy5.5 emits in the near-infrared region, providing suitable tissue penetration of the emitted light (190). A variety of tumors could be imaged because CTX:Cy5.5 binds specifically to MMP-2 (gelatinase), which is a general marker of tumor invasiveness. CTX:Cy5.5 and a radiolabeled analog, 131I-TM-601 (191), by imaging MMP-2, could provide insight into which tumors may prove most invasive and potentially metastatic. Both have high potential for clinical translation. The third project, by Li et al., actually describes 3 methods for measuring the metastatic potential of tumors, that is, dynamic contrast-enhanced MRI, T(1rho)-weighted imaging, and low-temperature fluorescence imaging (for biopsy specimens) (192). These methods could distinguish between indolent (A375P) and aggressive (C8161) metastatic human melanoma xenografts in mice. All 3 methods are potentially clinically translatable.
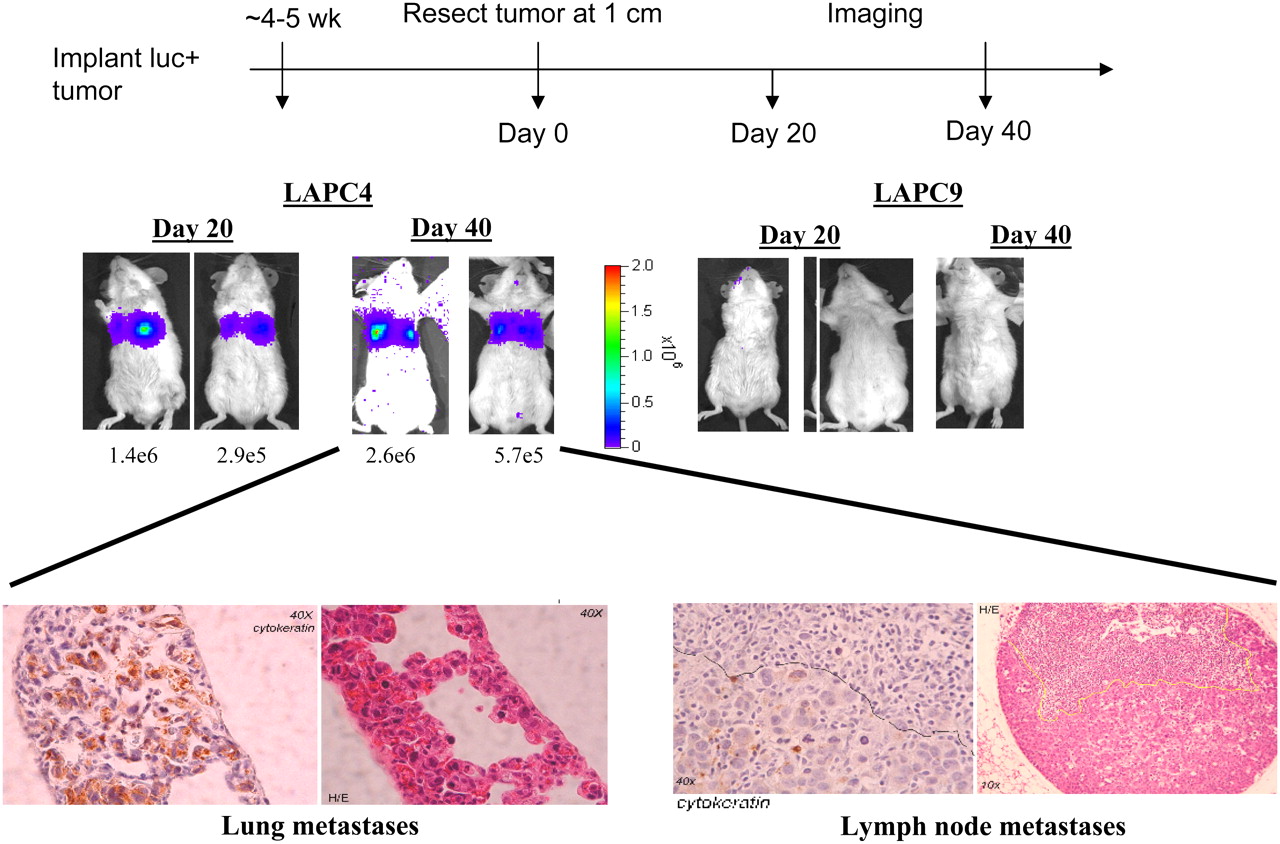
Optical imaging of metastatic potential. Prostate tumors LAPC-4 and LAPC-9 are implanted and resected on reaching 1 cm (day 0). BLI is performed on day 20 then again on day 40. No metastases are evident from more indolent LAPC-9 tumors. LAPC-9 tumors would generate metastases after transfection with VEGF-C (data not shown). (Images courtesy of Dr. Lily Wu, UCLA.)
PERSPECTIVE
The ability to image metastatic potential is an exercise in finding a suitable imaging target within cells that can predict which aspects of a tumor will metastasize and which will not. That generally means finding a signal transduction cascade or other marker that can differentiate indolent from aggressive phenotypes. As molecular–genetic imaging becomes more advanced, through the use of clinically viable, nonimmunogenic reporter systems or more efficient and sensitive reporters, imaging scientists will be able to probe more deeply into the cell and image those processes that will predict the metastatic phenotype. Of course, determining precisely what determines that phenotype is an ongoing area in cancer research, again underscoring the need to marry the techniques of molecular imaging with tumor biology. Fruitful areas of inquiry may include imaging embryonic signal transduction—which may go awry in cancer and provide the most malignant elements of the tumor—and targeting cancer stem cells, which are increasingly recognized not only as providing a malignant nidus for establishing new tumors but also as possibly contributing to metastatic potential.
Acknowledgments
We thank the NIH (grants U24 CA92871 and P50 CA103175) for financial support.
Footnotes
-
COPYRIGHT © 2008 by the Society of Nuclear Medicine, Inc.
References
- 1.↵
- 2.↵
- 3.↵
- 4.
- 5.
- 6.
- 7.
- 8.
- 9.
- 10.
- 11.
- 12.
- 13.↵
- 14.↵
- 15.↵
- 16.↵
- 17.↵
- 18.↵
- 19.
- 20.
- 21.
- 22.↵
- 23.↵
- 24.↵
- 25.↵
- 26.↵
- 27.↵
- 28.↵
- 29.↵
- 30.↵
- 31.↵
- 32.↵
- 33.↵
- 34.↵
- 35.↵
- 36.↵
- 37.↵
- 38.↵
- 39.
- 40.
- 41.
- 42.
- 43.
- 44.↵
- 45.↵
- 46.↵
- 47.
- 48.↵
- 49.↵
- 50.↵
- 51.↵
- 52.↵
- 53.↵
- 54.↵
- 55.↵
- 56.↵
- 57.↵
- 58.↵
- 59.↵
- 60.↵
- 61.↵
- 62.↵
- 63.↵
- 64.↵
- 65.↵
- 66.↵
- 67.↵
- 68.↵
- 69.↵
- 70.↵
- 71.↵
- 72.↵
- 73.
- 74.↵
- 75.↵
- 76.↵
- 77.↵
- 78.↵
- 79.↵
- 80.↵
- 81.↵
- 82.↵
- 83.↵
- 84.↵
- 85.
- 86.↵
- 87.↵
- 88.
- 89.↵
- 90.↵
- 91.↵
- 92.↵
- 93.↵
- 94.↵
- 95.↵
- 96.↵
- 97.↵
- 98.
- 99.↵
- 100.↵
- 101.
- 102.↵
- 103.↵
- 104.↵
- 105.↵
- 106.↵
- 107.
- 108.↵
- 109.↵
- 110.↵
- 111.↵
- 112.↵
- 113.↵
- 114.↵
- 115.↵
- 116.↵
- 117.↵
- 118.↵
- 119.↵
- 120.↵
- 121.↵
- 122.↵
- 123.↵
- 124.↵
- 125.↵
- 126.↵
- 127.↵
- 128.
- 129.↵
- 130.↵
- 131.↵
- 132.↵
- 133.↵
- 134.↵
- 135.↵
- 136.↵
- 137.↵
- 138.↵
- 139.↵
- 140.
- 141.↵
- 142.↵
- 143.↵
- 144.↵
- 145.
- 146.↵
- 147.↵
- 148.↵
- 149.↵
- 150.
- 151.↵
- 152.↵
- 153.
- 154.
- 155.
- 156.
- 157.↵
- 158.↵
- 159.↵
- 160.↵
- 161.↵
- 162.↵
- 163.
- 164.
- 165.↵
- 166.↵
- 167.↵
- 168.↵
- 169.↵
- 170.↵
- 171.↵
- 172.↵
- 173.↵
- 174.↵
- 175.
- 176.
- 177.↵
- 178.↵
- 179.↵
- 180.↵
- 181.↵
- 182.↵
- 183.↵
- 184.↵
- 185.↵
- 186.↵
- 187.↵
- 188.↵
- 189.↵
- 190.↵
- 191.↵
- 192.↵
- 193.↵
- Received for publication November 10, 2007.
- Accepted for publication April 23, 2008.


