


Abstract
The hypoxia-inducible factor-1α (HIF-1α) activates angiogenesis in response to cellular hypoxia, suggesting a spatial correlation between angiogenesis and tissue hypoxia. Methods: Using digital autoradiography of coinjected 18F-labeled azomycin arabinoside (8F-FAZA) (assessing regional hypoxia) and a glycosylated RGD-containing peptide (125I-3-iodo-dTyr4-cyclo(-Arg-Gly-Asp-dTyr-Lys(SAA)-), or 125I-Gluco-RGD) (assessing angiogenesis via binding to αvβ3 integrin receptors on endothelial cells) performed on 22 EMT6 tumor xenografts, we investigated the intratumoral spatial distribution of these tracers. We applied a Bayesian bivariate image analysis using the mean tumor-to-muscle ratio as a discriminator, resulting in 4 groups: FAZA high/RGD high (Q1), FAZA low/RGD high (Q2), FAZA low/RGD low (Q3), and FAZA high/RGD low (Q4). In an additional 18 xenografts, the immunohistochemically derived HIF-1α protein distribution was compared with 18F-FAZA autoradiography. Animals were divided into groups breathing either room air or carbogen (95% oxygen, 5% CO2) for 4 h until sacrifice. Results: Under room air conditions, roughly 60% of the tumor surface displayed a spatial coupling of 18F-FAZA and 125I-Gluco-RGD uptake: either high (Q1) or low (Q3) uptake for both tracers, with Q1 indicating spatial association of hypoxia and angiogenesis and Q3 indicating adequate oxygenation without active angiogenesis. However, the remaining approximately 40% of the tumor surface showed discordant 18F-FAZA and 125I-Gluco-RGD uptake, indicating that hypoxia and angiogenesis are not necessarily spatially linked to each other and highlighting substantial intratumoral heterogeneity of the 18F-FAZA and 125I-Gluco-RGD uptake. Although carbogen breathing conditions significantly decreased the mean 18F-FAZA tumor-to-muscle ratio, no significant changes were observed for 125I-Gluco-RGD, indicating that an acute increase in tumor oxygenation did not influence αvβ3 integrin receptor expression. The HIF-1α–positive (HIFpos) tumor cell fraction was not significantly influenced by breathing conditions and covered between 0% and 35% of the total tumor section surface. However, the HIFpos tumor section surface was much smaller than the tumor section surface of increased 18F-FAZA uptake, suggesting that both markers are identifying distinctly different biologic processes associated with hypoxia. Conclusion: The study revealed a substantial spatial discordance of the 18F-FAZA and 125I-Gluco-RGD tumor distribution suggesting that hypoxia and angiogenesis are not necessarily spatially linked in malignancies. These results may prove essential in developing advanced targeted systemic chemotherapeutic approaches (such as combinations of hypoxia-activated cytotoxins and antiangiogenic drugs) for hypoxic tumors.
It has been suggested that the combined administration of antiangiogenic and cytotoxic therapies (chemotherapy and radiation) yields maximal benefit by treating 2 distinct tumor compartments, the cancer cells and rapidly proliferating endothelial cells (1). Although cytotoxic agents would destroy cancer cells directly, the antiangiogenic agents would target cancer cells indirectly by depriving them of nutrients and oxygen. As a result, the antiangiogenic agent would augment the response to radiation or chemotherapy. Indeed, when given in combination with chemotherapy, bevacizumab, an antibody targeted against the potent angiogenic vascular endothelial growth factor, significantly increased survival in colorectal cancer patients (2). However, destroying the vasculature should severely compromise oxygen delivery and reduce the delivery of therapeutics to the solid tumor, producing or enhancing hypoxia (3), which is well known to counteract the effects of many chemotherapeutics and radiation treatment (4). Indeed, some studies have demonstrated that antiangiogenic therapy may interrupt the delivery of chemotherapeutic drugs to tumors (5) and diminish the effects of radiation therapy (6). In fact, computer simulations suggest that conventional treatment, including antiangiogenic therapies, may trigger spatial heterogeneity (e.g., local hypoxia), thus causing invasive instability (7) and selecting for more malignant cells with increased metastatic potential (8). Unfortunately, some cancer cells may survive in this abnormal microenvironment and regrow to recurrent disease or become the origin of metastatic seed. Together, the abnormal vasculature of tumors and the resulting abnormal microenvironment create an effective blockade to the delivery of cancer therapy.
There is evidence that adequately low doses of antiangiogenic drugs may actually increase delivery of nutrients and oxygen (9), thus reducing hypoxia, and may therefore be effective additions to conventional treatment (“normalization” of blood flow). On the other hand, inadequately high doses of antiangiogenic drugs may lead to more extensive tumor tissue damage but will never completely disrupt blood flow to all cancer cells and therefore increase hypoxia and lead to selection of more aggressive malignant cells with higher malignant potential and thus ultimately decrease outcome (6). This concept of a critical balance between normalization and excessive vascular regression emphasizes the requirement for careful selection of the dose and administration schedule for antiangiogenic agents (9). It appears that only specific noninvasive imaging would be sufficient to deliver this kind of critical information.
As a first step to better understand the regional distribution of tumor hypoxia and angiogenesis, we evaluated the spatial relationship of these 2 key components of tumor growth in the well-characterized EMT6 xenograft tumor model. Tumor hypoxia was measured with 18F-labeled azomycin arabinoside (18F-FAZA), a second-generation hypoxia PET tracer displaying a more rapid clearance from normal tissues and, compared with 18F-fluoromisonidazole, resulting in favorable tumor-to-background ratios in various tumor models (including EMT6 tumors) and humans (10–14). The angiogenic potential of these tumors was investigated with a glycosylated RGD-containing peptide (125I-3-iodo-dTyr4-cyclo(-Arg-Gly-Asp-dTyr-Lys(SAA)-), or 125I-Gluco-RGD) that binds with high affinity and selectivity to the αvβ3 integrin on endothelial cells undergoing angiogenesis (15). Recent studies indicate that tumor-induced angiogenesis can, indeed, be monitored with glycosylated RGD peptides in animals and humans (16,17). Although αvβ3 integrin receptors may also be expressed on certain tumor cells, they are not present on the tumor cell line (EMT6) investigated (18,19), thus allowing us to assume that 125I-Gluco-RGD binding in this tumor model indeed reflects angiogenesis.
In addition, in a subset of animals we also compared the spatial relationship of tumor hypoxia and hypoxia-inducible factor-1α (HIF-1α) expression. In cases of cellular hypoxia, this heterodimeric transcription factor stabilizes and leads to the transcriptional activation of genes responsible for energy production, anaerobic metabolism, hematopoiesis, angiogenesis, vasodilatation, and iron metabolism, all of which are implicated in the basic biology of cancer (20). HIF-1α therefore influences oxygen delivery via angiogenesis and regulates the metabolic adaptation to hypoxia.
MATERIALS AND METHODS
Tracers
18F-FAZA (21) and 125I-Gluco-RGD (22) were synthesized as previously described. The radiochemical purity of both compounds always exceeded 95%. The hypoxia-dependent uptake mechanism of 18F-FAZA and the specificity of glycosylated RGD-containing peptides for the αvβ3 integrin have already been established (10,15,22,23).
In Vivo Experiments
Female Swiss nu/nu mice weighing 25.1 ± 0.4 g (Charles River) were housed 4 or 5 per cage in a limited-access area at a mean temperature of 26°C and a humidity of 50%–60% and had free access to food and water. A donor tumor was initiated by subcutaneously injecting 2.5 × 10⁶ EMT6 tumor cells into 1 mouse. For double-autoradiography studies, 11 mice received 2 subcutaneous xenotransplants (approximately 1 mm3 in size) to both upper dorsal thoraces. This cell line was chosen because the resulting tumor is fast-growing and presumably contains vasculature that is rich in αvβ3 integrins, whereas the cells themselves do not express RGD binding sites (18,19). Also, EMT6 tumors are known to express various levels of hypoxia (10). After 2–3 wk, the tumors reached the desired size of approximately 10 mm in maximal diameter.
The animals were matched according to their body weight and maximal tumor diameter and were assigned to breath either room air (n = 8; group A) or carbogen (95% O2 and 5% CO2, n = 3; group B). Because 2 xenotransplants were implanted per animal, further analyses were performed on 16 tumors under room air breathing conditions and 6 under carbogen breathing conditions. Animals breathing carbogen were kept in a large custom-built clear acrylic container (flushed with 3 L of carbogen per minute), starting 1 h before tracer injection. Animals breathing room air were held under otherwise similar conditions in a large cage. Except for a period of approximately 1–3 min for tracer injection (inhalation anesthesia), the respective oxygen atmosphere was never compromised until sacrifice. For the comparison of 18F-FAZA and 125I-Gluco-RGD, both tracers were coinjected intravenously (50.0 ± 2.8 MBq of 18F-FAZA and 0.24 ± 0.02 MBq of 125I-Gluco-RGD) into the tail vein (approximately a 0.1-mL volume). The animals were euthanized in CO2 gas and rapidly dissected 3 h after tracer injection. Animal experiments were conducted in compliance with the guidelines for the care and use of research animals established by the animal research committee at the Technical University of Munich and in accordance with the German Law for the protection of animals. Image data analyses were performed at the University of Michigan.
18F-FAZA and 125I-Gluco-RGD Autoradiography
Autoradiography was performed on multiple sections of all tumors and corresponding thigh muscle tissue as a reference. Immediately after dissection, tumors and muscle tissue were quickly frozen and cut into 20-μm-thick sections (Kryostat Microm Typ HM 500; Microm). The radioactivity of the sections was determined according to the manufacturer's recommendations using a Phosphor Imager 445 SI (Molecular Dynamics). Briefly, sections were exposed to storage phosphor screens for 2 h, capturing positron and γ-emissions as soon as possible after sectioning. The screens were read generally 4–5 h after injection to determine the distribution of total radioactivity. After complete decay of 18F (half-life, 109 min), the radioactivity resulting from 125I (half-life, 60.1 d) was determined for 2 h to determine the fraction of counts that resulted from the 125I decay in the first acquisition. These counts were then subtracted (on a pixel-by-pixel basis) from the first acquisition to represent the “true” 18F distribution. A third acquisition (exposed for 24 h) provided the 125I distribution. Autoradiographic images were then analyzed using Image Quant image analysis software (Molecular Dynamics), with background corrections performed and a pixel size of 88 μm selected (114 dots/cm). Typically, each tumor section resulted in approximately 70,000 counts above the background level from 125I and 50,000 from 18F. Then, the mean muscle uptake was calculated from 4–7 tissue sections per animal, and the tumor-to-muscle (T/M) ratio was calculated on a pixel-by-pixel basis. The tissue section surface area was derived from individually drawn regions of interest around the tumor and respective muscle tissues.
Double-Autoradiography Image Analysis
The intratumoral distribution of tracer uptake was assessed using Bayesian bivariate image analysis. The mean T/M ratio across all animals breathing room air (3.18 for 18F-FAZA and 4.6 for 125I-Gluco-RGD (24)) was chosen as a discriminator for high or low uptake, resulting in 4 categories: FAZA high/RGD high (Q1), FAZA low/RGD high (Q2), FAZA low/RGD low (Q3), and FAZA high/RGD low (Q4). The analysis resulted in grayscale-coded surface plots representing the respective location of these 4 categories per tumor slice, from which the percentage of the tumor section surface showing high or low uptake of 18F-FAZA and 125I-Gluco-RGD was calculated.
Immunohistochemistry
In an additional 9 mice xenotransplanted with 18 EMT6 tumors (5 animals breathing room air and 4 carbogen), the expression of HIF-1α was evaluated by immunohistochemical analysis. The slices used for immunohistochemical analysis were 3-μm-thick sections contiguous to the last 20-μm section used for autoradiography. To perform HIF-1α staining using the labeled streptavidin biotin technique method, we used the primary HIF-1α monoclonal antibody (MAB5382, final concentration 2 μg/mL; Chemicon) after embedding the remainder of the frozen tumor in paraffin. Staining was performed according to the manufacturer's instructions using ChemMate streptavidin peroxidase (horseradish peroxidase) as a secondary antibody.
HIF-1α and 18F-FAZA Image Analysis
The intratumoral distribution of HIF-1α was determined by light microscopy using nuclear HIF-1α immunostaining and compared with the corresponding 18F-FAZA digital autoradiographic image. Regions of interest were defined on autoradiography images using the T/M ratio of 3.18 as the discriminator and calculating the intratumoral areas of high and low 18F-FAZA uptake (in μm2). Histology slides were scanned using a Leica Digital Module R microscope including a CCD image sensor (Leica Microsystems) and segmented using Sigma Scan Pro 5.0 software (SPSS). The resulting HIF-1α maps were superimposed on autoradiography images. HIF-1α–negative areas were defined as total tumor minus HIF-1α–positive areas.
Statistics
Parameters were compared by means of a 1-way ANOVA, including tests for homogeneity of group variances using the Bartlett test, selecting a conservative significance level of P ≥ 0.1. The data were then compared using a t test. Results are expressed as mean ± SE (SEM) and, as appropriate, with their respective 95% confidence interval. P < 0.05 was considered statistically significant. Statistical tests were performed with the JMP, version 5.1 (SAS), statistical software package.
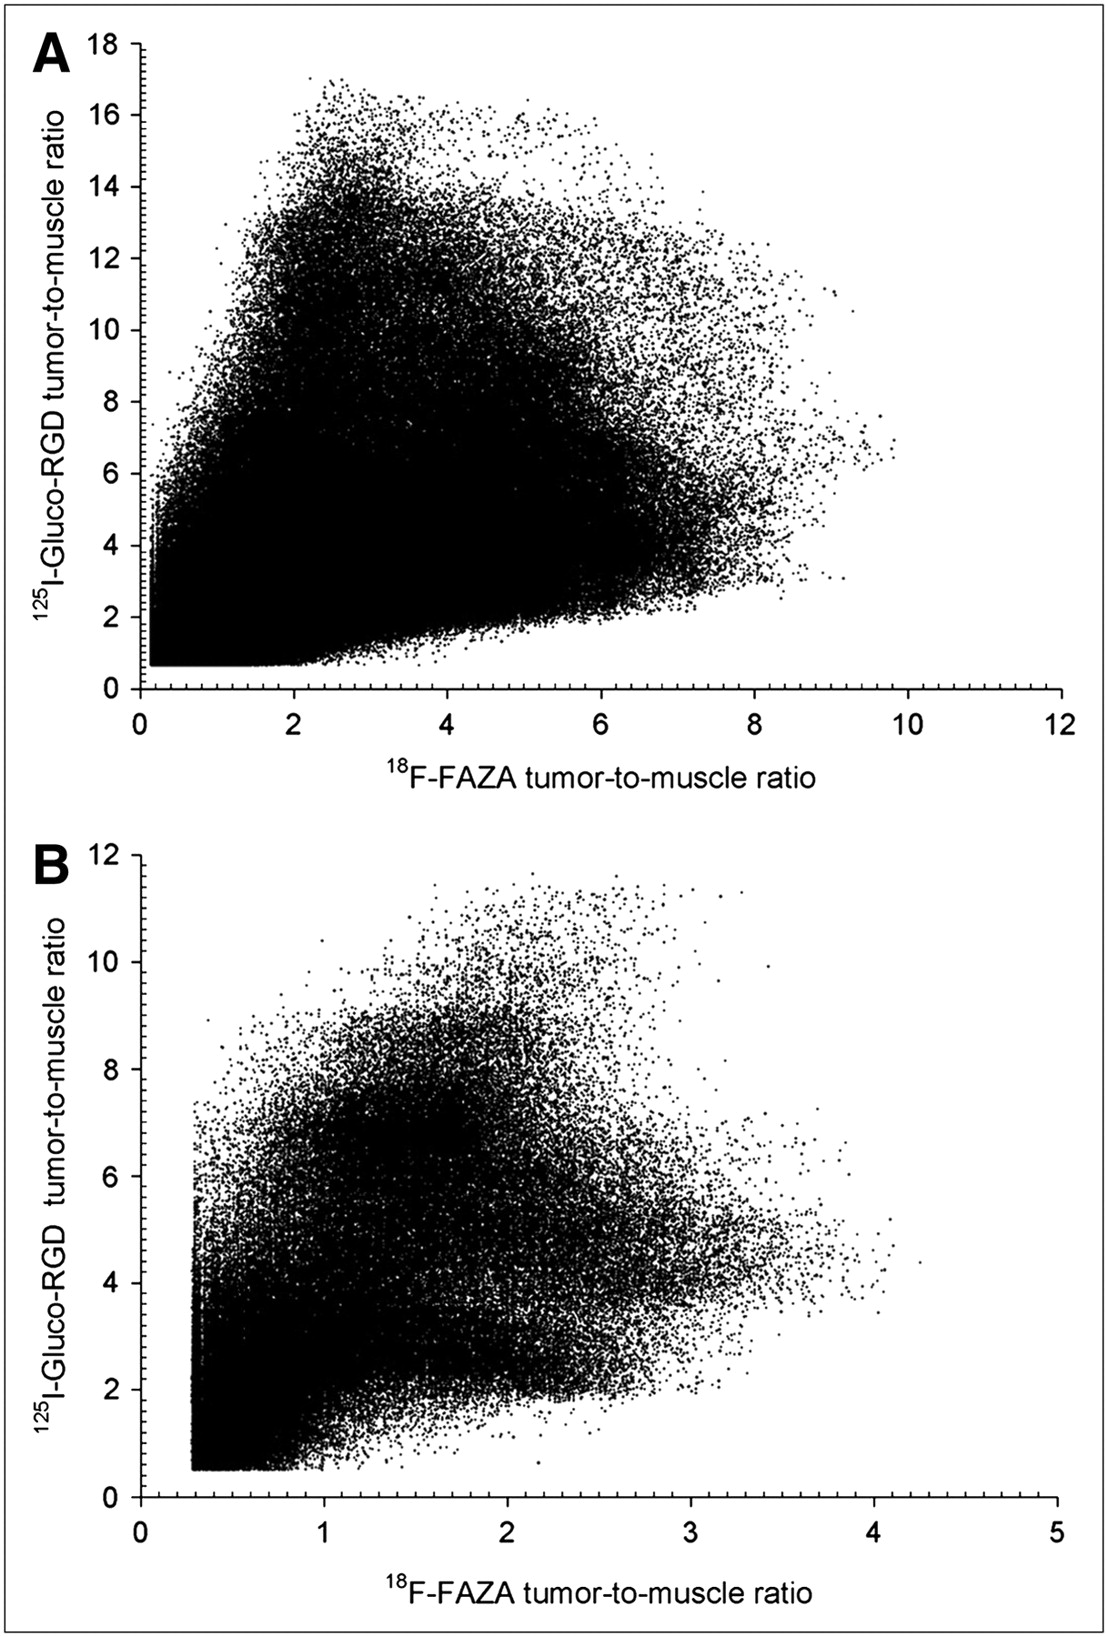
Figure 1 displays the 18F-FAZA and 125I-Gluco-RGD T/M ratios plotted for the entire population of pixels for room air and carbogen breathing. We segmented a total of 599,240 individual pixels from room air–breathing animals and 227,389 pixels from carbogen-breathing animals. All pixels containing fewer counts than the sum of the background count plus 1 SD were excluded, reducing partial-volume effects at the tissue borders (tumor and muscles). On examination of these graphs, it becomes evident that no simple linear or nonlinear function would sufficiently describe the relationship of these tracers on this 2-dimensional level, thus excluding the possibility that any threshold technique could identify hypoxic or angiogenic tissues. We therefore examined the intratumoral distribution of tracers on a purely spatial level, treating each tumor slice individually.

Pixel distribution of 18F-FAZA and 125I-Gluco-RGD T/M ratios of entire EMT6 tumor population under room air breathing conditions (n = 599,240) (A) and under carbogen breathing conditions (n = 227,389) (B). No obvious relationship exists between the 2 parameters.
To simplify the statistical analysis associated with such large data volumes from double-tracer autoradiography, we applied a Bayesian bivariate image model (primarily used for image segmentation). Briefly, conditional on the image label, the tracer intensities are assumed to follow a bivariate normal distribution. The labels themselves follow a Potts model. We assume that the number of image labels in the model is unknown and use reversible jump Markov chain Monte Carlo (RJMCMC) to estimate the number of labels. The joint distribution of the labels and model parameters are estimated via a hybrid RJMCMC/MCMC procedure. We are primarily interested in the mean intensity of each image pixel and not the labeling of the image. Therefore, we obtain the marginal mean intensity image by integrating over the labels as well as the other parameters. To obtain a clearer picture of the spatial pattern of hypoxia and angiogenesis, we partition the mean images into 4 distinct subsets of pixels: the set of all pixels where both 18F-FAZA and 125I-RGD tracer activity is high (Q1), the set of all pixels where 18F-FAZA tracer activity is low and 125I-RGD activity is high (Q2), the set of all pixels where 18F-FAZA activity is high and 125I-RGD activity is low (Q4), and the set of all pixels where the activity of both tracers is low (Q3). For discrimination purposes, we define tracer activity as high or low if the estimated posterior mean intensity is greater or less, respectively, than the empiric average intensity. A pixel is classified into 1 of these 4 subsets if the posterior probability that both conditions hold is greater than 0.5. For example, Q1 is the set of all pixels i such that the following condition holds: Eq. 1where Y is data,
  is the mean 18F-FAZA intensity of pixel i, and
  is the mean 125I-RGD intensity. The empiric mean intensity of 18F-FAZA is 3.18 and that of 125I-RGD is 4.6. Details of the model and algorithm have been published elsewhere (24).
To assess the relative location of tracer uptake within a respective tumor slice, we assessed the number of pixels between the tumor border and the “center” of the tumor section for groups Q1–Q4, using the centroid (average position on the x- and y-axes) as a reference. A mixed-effect linear model was built, with pixel distance to the centroid as the outcome of interest. The fixed effects are quadrant (Q1–Q4), tumor size (area), and breathing condition (room air [0] or carbogen [1]). The random intercept was nested within a quadrant, which was further nested in a tumor slice, which was nested in a tumor, which was nested in a mouse. These random effects help account for spatial correlation in the data. Contrasts between the quadrant fixed effects were tested for statistical significance, with P < 0.05 considered significant, controlling for tumor size and breathing condition.
RESULTS
Animals
No significant differences in animal weight, tumor weight (room air, 0.20 ± 0.1 g; carbogen, 0.22 ± 0.15 g), or tumor section surface area (room air, 2,931 ± 765 μm2; carbogen, 3,718 ± 1,002 μm2) were found on autoradiography between animals breathing room air and animals breathing carbogen. Also, no significant differences in animal or tumor weight were noted between groups selected for comparison of 18F-FAZA versus 125I-Gluco-RGD distribution and 18F-FAZA versus HIF-1α distribution.
18F-FAZA and 125I-Gluco-RGD Autoradiography
The mean 18F-FAZA T/M ratio derived under room air conditions (group A) was determined as 3.2 ± 0.1 (mean ± SEM), which was significantly higher than the ratio derived under carbogen breathing conditions (1.4 ± 0.2, group B), indicating that carbogen breathing was indeed increasing tumor oxygenation. On the other hand, the mean 125I-Gluco-RGD T/M ratio was not significantly different between groups A (4.6 ± 0.2) and B (4.5 ± 0.4), indicating that an acute increase in tumor oxygenation was not followed by noticeable changes in αvβ3 integrin receptor expression.
Under room air conditions, the intratumoral distribution of radioactivity was inhomogeneous in both 18F-FAZA– and 125I-Gluco-RGD–derived images. When the mean T/M ratio was selected as the discriminator, the largest proportion of the evaluated tumor surface (36.5%) displayed low 18F-FAZA uptake and low 125I-Gluco-RGD uptake (Q3), indicating that these areas were predominantly well oxygenated and not subject to activated angiogenesis. Also, a significant proportion of the tumor surface area (19.5%) displayed high 18F-FAZA uptake and, at the same time, high 125I-Gluco-RGD uptake (Q1), indicating a spatial association between hypoxia and angiogenesis. Interestingly, the remainder of the tumor surfaces showed discordant 18F-FAZA and 125I-Gluco-RGD uptake, with either low 18F-FAZA uptake and high 125I-Gluco-RGD uptake (Q2, 19.7%) or high 18F-FAZA uptake and low 125I-Gluco-RGD uptake (Q4, 22.9%), indicating that hypoxia and angiogenesis are not necessarily spatially linked to each other. Under carbogen breathing, 18F-FAZA uptake was significantly lower, resulting in exclusively low 18F-FAZA uptake areas, with Q2 at 44.6% and Q3 at 55.4% of the total surface (Table 1). Although Figure 1B displays few pixel (0.2%) above the threshold level of 3.18 for 18F-FAZA, the statistical analyses classified them as spatial random fluctuations; thus, these pixels were smoothed out before the final data analysis. Figures 2 and 3 display the pattern of 18F-FAZA and 125I-Gluco-RGD uptake in representative tumors under room air and carbogen breathing conditions, respectively.
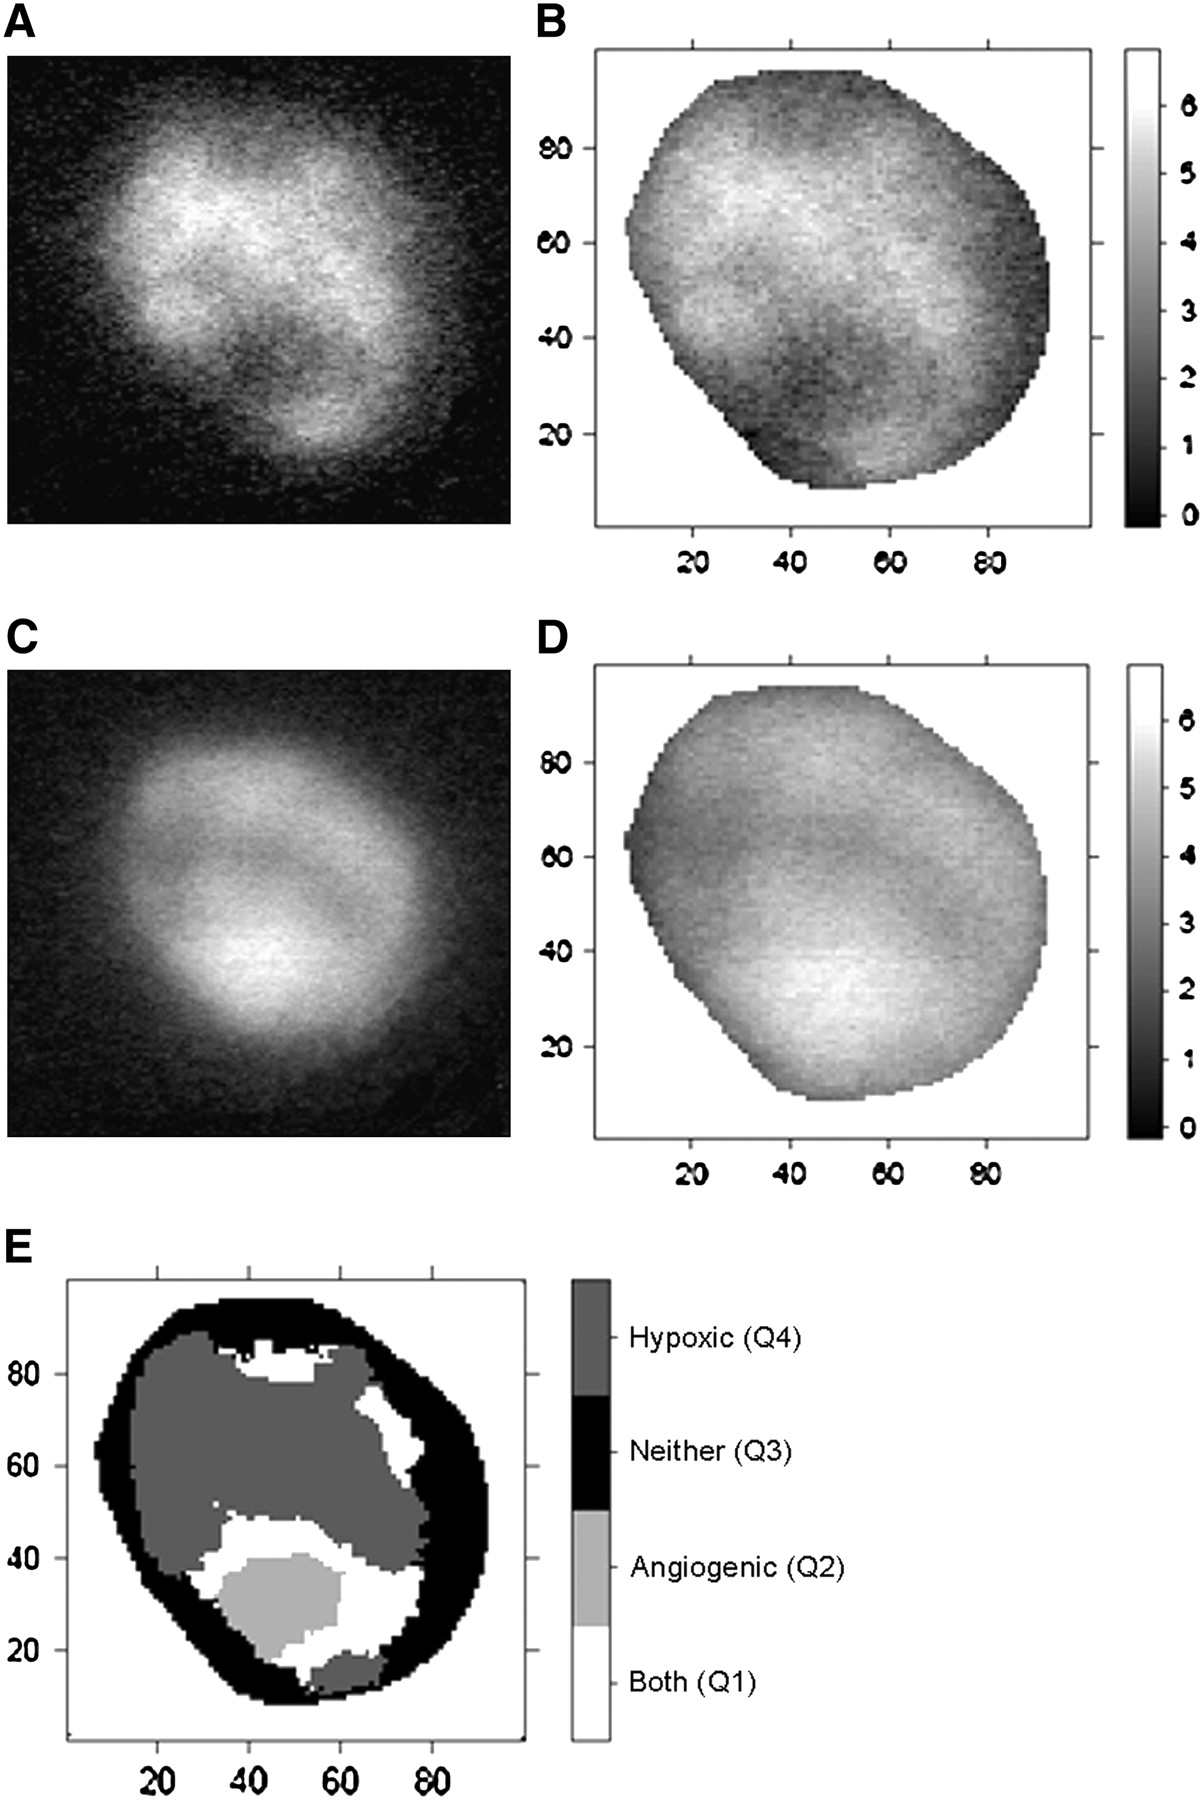
(A and C) Autoradiographic images of 18F-FAZA (A) and 125I-Gluco-RGD (C) uptake in EMT6 tumor xenograft investigated under room air conditions. (B and D) Spatially matched T/M ratios (as grayscale intensity) of 18F-FAZA (B) and 125I-Gluco-RGD (D). Labels of x- and y- axes represent pixel location. Areas of intense 18F-FAZA uptake are predominantly areas of low 125I-Gluco-RGD uptake, and vice versa. (E) Bayesian bivariate image analysis classified tumor surface into 4 categories (Q1–Q4), with predominant feature being hypoxic (Q4), angiogenic (Q2), both (Q1), or none (Q3).
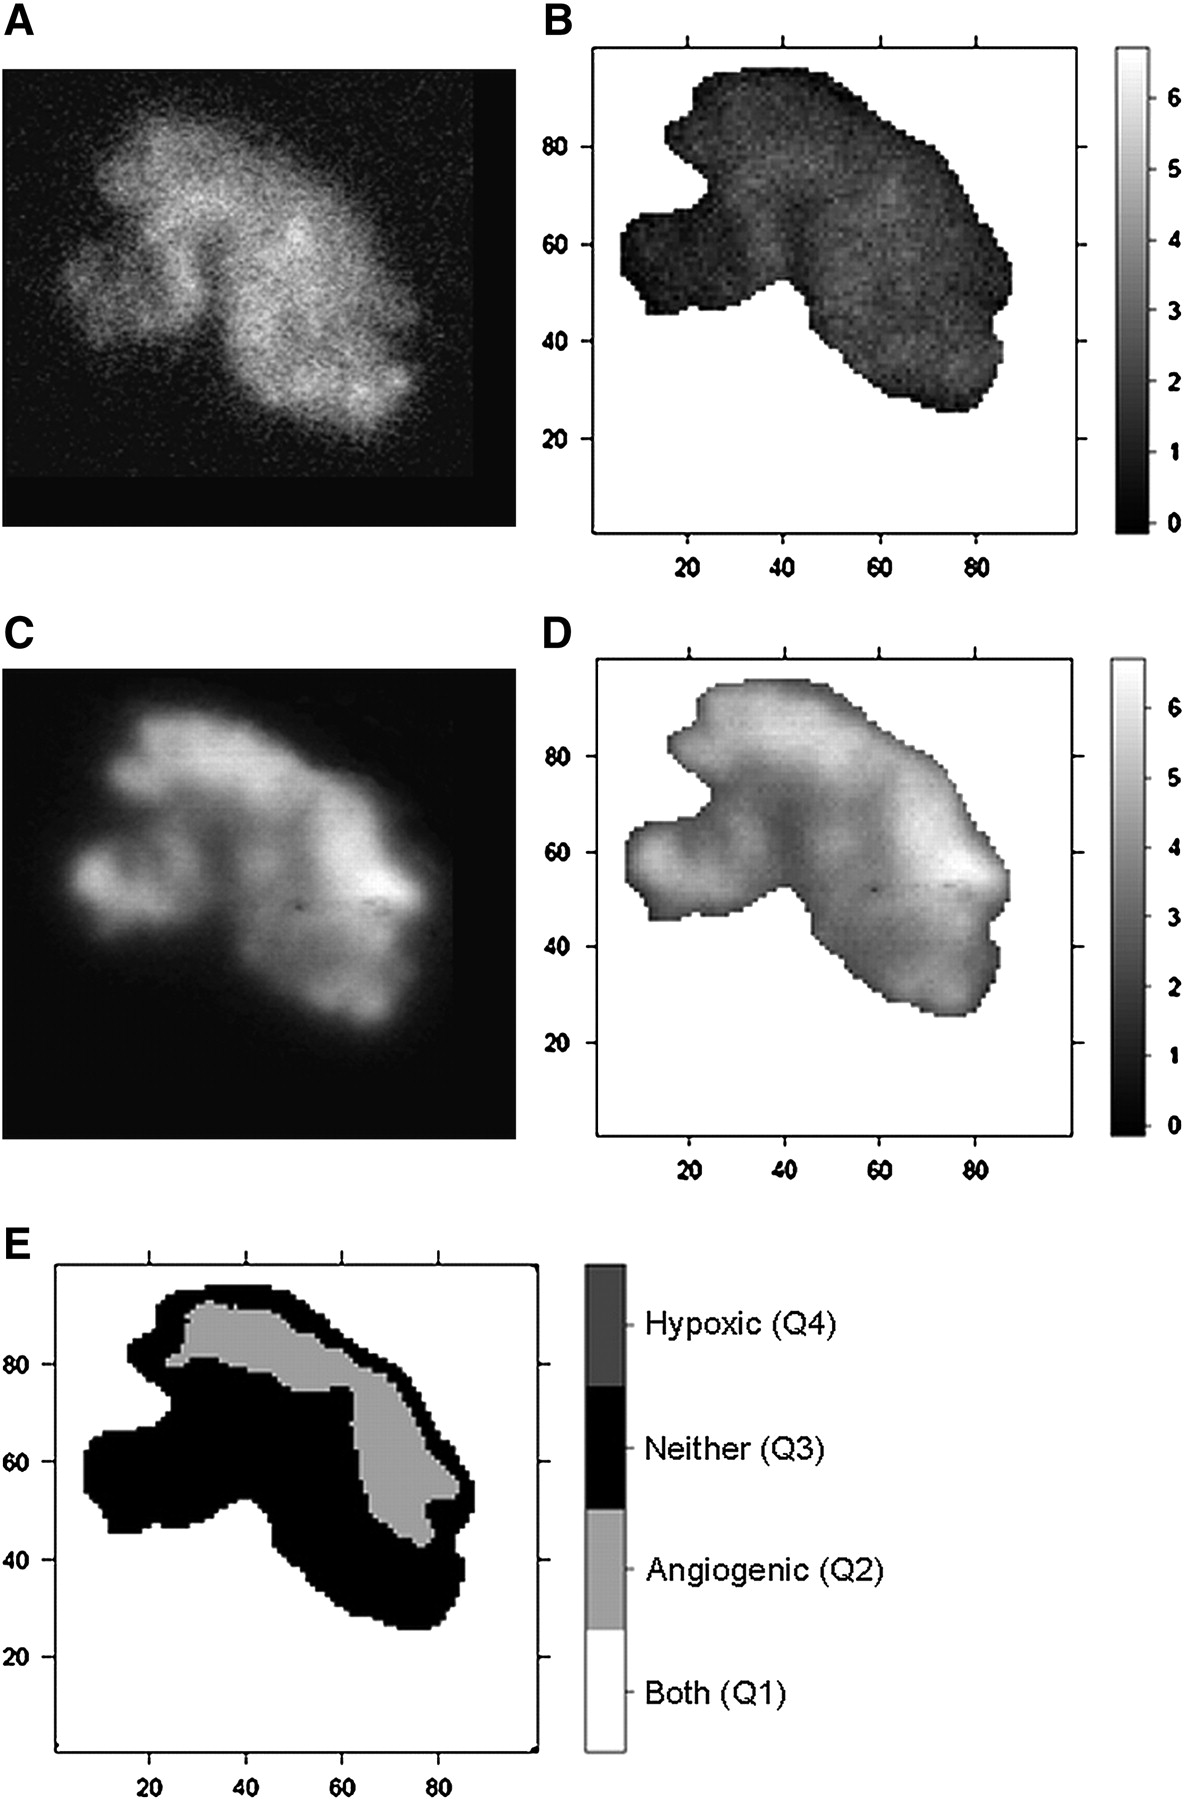
(A and C) Autoradiographic images of 18F-FAZA (A) and 125I-Gluco-RGD (C) uptake investigated under carbogen breathing conditions. (B and D) Spatially matched T/M ratios (as grayscale intensity) of 18F-FAZA (B) and 125I-Gluco-RGD (D). (E) In bayesian bivariate image analysis, 18F-FAZA T/M ratio is below cutoff value of 3.18 in entire tumor; therefore, only categories Q2 and Q3 are present.
Autoradiographic Intratumoral 18F-FAZA and 125I-Gluco-RGD Distribution
High 18F-FAZA uptake (Q1, Q4) and high 125I-Gluco-RDG uptake (Q1, Q2) were found significantly closer to the relative center (centroid) of the respective tumor section than to the tumor borders, indicating that both hypoxia and angiogenesis were predominantly present in the core of tumors and not at the periphery. However, there was no trend as to whether high 18F-FAZA uptake or high 125I-Gluco-RGD uptake was closer to the centroid, indicating a nonsystematic and thus more heterogeneous spatial distribution of hypoxia and angiogenesis within the tumor cores.
HIF-1α and 18F-FAZA Colocalization
The spatial distribution of HIF-1α expression and 18F-FAZA uptake in a typical case (under room air conditions) is displayed in Figure 4. Tumor cells with nuclear staining positive for HIF-1α (HIFpos) were found predominantly as clusters near necrotic zones (Fig. 4B). This distribution is consistent with the pattern found in chronic hypoxia. Two tumors, 1 from the room air group and 1 from the carbogen-treated group, did not show any HIF-1α staining, whereas 2 other tumors from each group showed rather diffuse HIF-1α staining throughout the entire tumor.
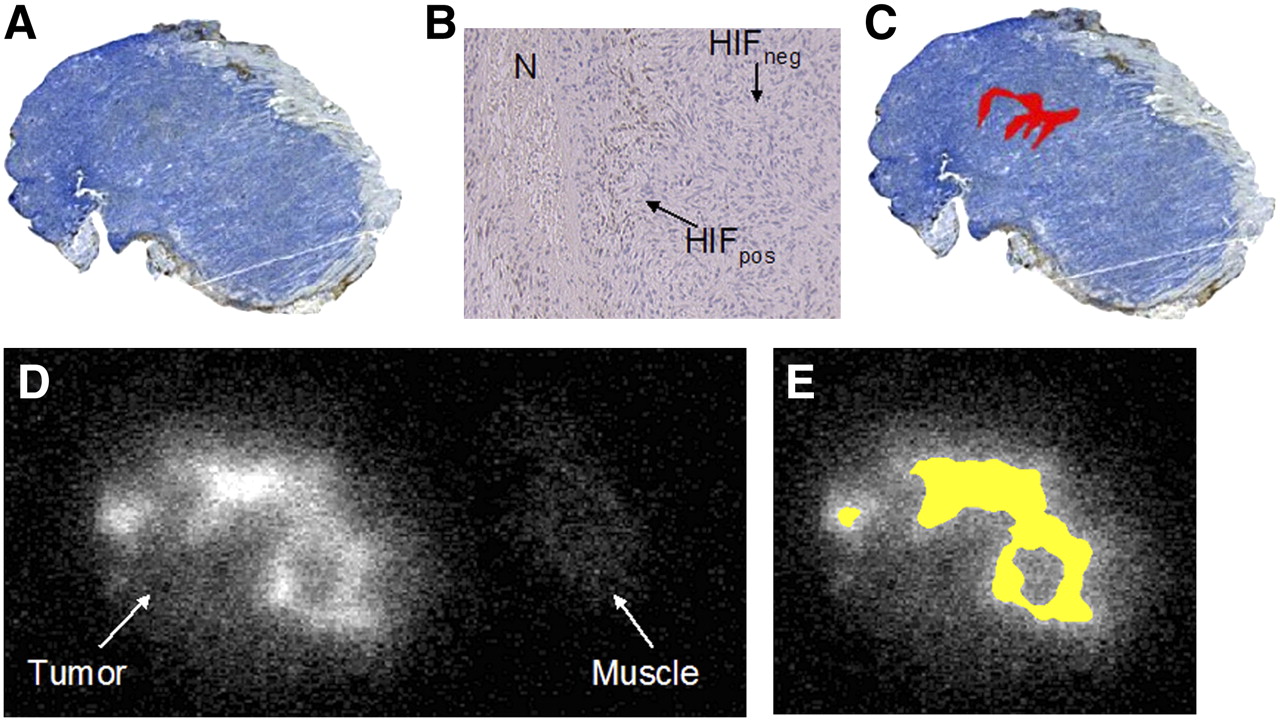
(A) Immunohistochemically derived HIF-1α expression under room air breathing conditions (×4). (B) HIF-1α expression (×40) shows positive brown staining (HIFpos) near small necrotic zone (N), whereas negative staining (HIFneg) was predominant feature in this EMT6 tumor. (C) HIFpos tumor fraction (in red) was calculated as 2.6% of total tumor surface area. (D) 18F-FAZA autoradiography shows inhomogeneously increased uptake in comparison with muscle tissue as reference. (E) Segmentation resulted in 29% of tumor surface displaying a T/M ratio above cutoff value of 3.18 (in yellow). Area of elevated 18F-FAZA uptake (E) vastly exceeds that of positive HIF-1α staining (C).
On average, the HIFpos fraction did not significantly differ between groups (room air breathing, 9.4% ± 3.5%; carbogen breathing, 4.4% ± 4.0%) and displayed large variations within groups (range, 0%–35% under room air and 0%–26% under carbogen breathing), whereas the 18F-FAZA T/M ratio above the cutoff value was significantly higher for the group breathing room air (20.6% ± 4.6%) than for the group breathing carbogen (0% ± 0%). In addition, the HIFpos fraction was considerably smaller than the fraction of increased 18F-FAZA tumor uptake; thus, areas of increased 18F-FAZA uptake extended the areas of HIF-1α–positive tumor cells markedly and were also found in areas where no HIF-1α staining was present (compare Figs. 4C and 4E). Nevertheless, under carbogen breathing conditions, most tumors displayed HIFpos tumor areas despite the fact that increased 18F-FAZA uptake (above the threshold) was not observed.
DISCUSSION
Based on histologic observations using fluorescent immunohistochemical markers, the most intense hypoxia staining is found near necrotic tissues (25)—thus, predominantly around necrotic cores of malignancies that outgrow their vascular supply. Accordingly, the adaptive activation of angiogenesis would be expected to occur in the vicinity of hypoxic regions as a result of activation of the HIF system (26). In fact, in this study and others (27), HIF-1α staining was indeed predominantly found close to necrotic zones. On the other hand, increased 18F-FAZA uptake was present much more broadly than was the HIF-1α staining pattern, indicating that HIF-1α staining underestimates the true extent of tissue hypoxia.
It is widely accepted that HIF-1α activates angiogenesis in response to cellular hypoxia (28), which in turn would suggest a relatively close spatial correlation between angiogenesis and tissue hypoxia (26). However, our data assessing the spatial distribution of hypoxia (as measured by 18F-FAZA) and angiogenesis (derived from 125I-Gluco-RGD binding to αvβ3 integrin) showed a much more complex and heterogeneous spatial pattern than this simple relationship would suggest. Roughly 60% of the tumor surface displayed a spatial coupling of 18F-FAZA and 125I-Gluco-RGD, whereas the remaining tumor surface showed discordant 18F-FAZA and 125I-Gluco-RGD uptake, indicating that hypoxia and angiogenesis are not necessarily spatially linked to each other.
How can we explain the observed spatial distribution of 18F-FAZA and 125I-Gluco-RGD? Hypoxia can be roughly categorized into 2 classes: chronic and acute (29). This grossly simplified distinction reflects primarily the duration of exposure to a hypoxic microenvironment but also reflects a different basis for development of hypoxia. Chronic hypoxia refers to cells at a greater distance from capillaries, because proliferation pressure forces them away from perivascular areas. Chronic hypoxia, also called diffusion-limited hypoxia, is therefore related to an insufficient tumor microvasculature, reflecting insufficient angiogenesis. This pattern is likely present in our tumor model, with HIF-1α staining confined to the vicinity of necrotic tumor zones. On the other hand, acute hypoxia is the result of severe structural abnormalities of tumor vessels that lead to a sudden interruption of blood flow and, thus, acute cessation of oxygen and energy supply (30). Acute hypoxia may be only temporary. Rapid reoxygenation by restoration of flow increases the release of free radicals, with mutagenic consequences (31). Hypoxia may therefore function as a mutagen by elevating oxygen radical levels after repeated cycles of hypoxia and reoxygenation, leading to chromosomal breaks or reoxygenation-induced DNA overreplication. Therefore, not surprising is the overwhelming evidence that hypoxia is a major negative prognostic factor not only for the success of radiation treatment but also for chemoresistance and malignant progression (32). Because increased 18F-FAZA uptake is expected to be seen with both acute hypoxia and chronic hypoxia, areas with increased 18F-FAZA uptake but baseline 125I-Gluco-RGD uptake might therefore reflect acute hypoxia (due to acute capillary dysregulation or blockage) that has not (yet) prompted an increase of angiogenesis via the HIF-1α system. In turn, areas with increased 125I-Gluco-RGD uptake but baseline 18F-FAZA uptake might have escaped hypoxia because of the activation of angiogenesis or may represent regions of hypoxia-independent angiogenesis (33). There is evidence that activation of the HIF-1α system in response to cellular hypoxia occurs rapidly (a 3-fold increase in HIF expression at 24 h after 2% oxygenation (34)) and that αvβ3 integrin expression peaks about 24 h after hypoxic stress (35). However, further studies comparing the temporal dynamics of regional hypoxia, αvβ3 expression, and HIF-1α expression are needed to clarify these observations.
This concept is further supported by the fact that tumor hypoxia can be acutely modulated by the oxygen concentration in the inspired air (36). In this study and in previous studies using direct tissue oxygenation measurements or luminescence-based fiberoptic probes, a high oxygen content in the inspired air decreased tissue hypoxia but did not significantly modulate oxygenation in well-oxygenated tissues such as normal musculature (10). Nevertheless, our data showed regionally elevated 18F-FAZA uptake in several carbogen-treated tumors, compared with uptake in normal muscle tissue, indicating that carbogen treatment cannot completely abolish tumor hypoxia in our model.
Because the EMT6 tumor cells themselves do not express αvβ3 integrin receptors (18,19), regionally increased 125I-Gluco-RGD uptake is considered to reflect tumor areas with activated angiogenesis. Independent verification of the presence of αvβ3 integrin receptors on endothelial cells would have been desirable; unfortunately, antibodies against the αvβ3 integrin are not yet commercially available for murine tissues.
The mean 125I-Gluco-RGD T/M ratios were not different between animals breathing room air and animals breathing carbogen, indicating that αvβ3 expression is not affected by acute oxygenation changes within the duration of these experiments (4 h). Because absolute uptake measurements were not performed, we cannot entirely exclude the possibility that hyperoxygenation due to carbogen breathing might have influenced αvβ3 expression in both tumor and muscle tissue to the same degree and in the same direction. However, we consider such a behavior unlikely for 2 reasons: first, a decrease in αvβ3 expression below baseline (in muscle tissue) would be rather unusual and has never been observed; second, any increase in αvβ3 expression on endothelial cells after hypoxia is gradual and peaks about 24 h after hypoxic stress (35), rendering any potential carbogen-induced reduction within 4 h of the onset of hyperoxygenation highly unlikely.
Because storage phosphor imaging plates have superior sensitivity, it is possible to accurately record tracer radioactivity at a low concentration range with a sufficient signal-to-noise ratio. At the investigated slice thickness of 20 μm, the storage phosphor plates display a linear response over a wide radioactivity range, and image resolution is optimal for high-photon-energy acquisitions (37). 18F and 125I count statistics were sufficient to perform dual-tracer autoradiography with superior image resolution, compared with the resolution of in vivo small-animal PET. However, the spatial resolution of 18F and 125I autoradiography is clearly insufficient to localize tracer uptake to specific cell types.
Therefore, the attempt to identify particular capillaries undergoing angiogenesis by comparing 125I-Gluco-RGD autoradiography with the results of general vascular immunostaining (i.e., CD31) will fail, and specific anti-αvβ3 antibodies are currently not commercially available for murine tissues.
Regional differences in tumor perfusion may have affected tracer accumulation, and high T/M ratios for 125I-Gluco-RGD may have been related mainly to perfusion effects and not to specific binding to αvβ3. We consider these possibilities to be unlikely, because measurements were performed 3 h after tracer injection, a time at which equilibrium between tissue and intravascular space has long been established (with approximately 0.2% of the injected dose per gram in blood (22)) and sufficient amounts of tracer have been delivered to allow binding to the αvβ3 integrin even in flow-reduced areas (as seen with 18F-FAZA). In addition, because 18F-FAZA was obviously delivered to these areas in an amount sufficient to produce accumulation, and because 18F-FAZA accumulation can occur in viable but not in necrotic cells (because of the energy dependency of the crucial intracellular reduction step of nitroimidazole compounds), extensive tumor cell necrosis is excluded as a potential cause of this phenomenon.
Although nuclear staining positive for HIF-1α was found predominantly in clusters near small necrotic areas, the tumor surface covered with positive HIF-1α cells was generally much smaller than that with increased 18F-FAZA uptake. To a certain extent, this finding is related to the large differences in spatial resolution between 18F-FAZA autoradiography and histology. Because positrons emitted from 18F travel considerably before annihilating, autoradiographic images are significantly blurred, compared with histologic sections. However, increased 18F-FAZA uptake was also noted in areas considerably distant from HIFpos regions (Figs. 4C and 4E). Therefore, it seems reasonable to assume that regional colocalization of HIF-1α and hypoxia tracer uptake is not a necessary prerequisite in malignancies. 18F-FAZA uptake, as well as uptake of other hypoxia tracers, reflects tissue oxygenation, which to a large degree reflects the condition of the local tumor microvasculature. Tumor tissue oxygenation is spatially and temporally heterogeneous and dependent on multiple factors, including vascular density and function, oxygen transport capacity, and regional oxygen consumption (38,39). On the other hand, HIF-1α is a transcription factor activated mainly by hypoxia but also by extracellular acidosis and specific oncogenic factors (28) and additionally displays temporal dynamics (34). Several oncogenic signaling pathways overlap with HIF-1–inducible genes, leading to the transcriptional activation of many genes involved in tumor progression (20). Obviously, the mechanisms are functionally linked but are essentially different processes.
CONCLUSION
The study offered insight into the spatial relationship between HIF-1α expression, tissue oxygenation, and angiogenesis—essential elements in understanding and developing advanced systemic chemotherapeutic approaches toward hypoxic tumors. The fact that large tumor areas alternate in preferential accumulation of 18F-FAZA and 125I-Gluco-RGD indicates opportunities for targeted treatment. Hypoxia tracer uptake can be used to select suitable patients for hypoxia-targeted treatment regimes. The predictive value of such approaches using the cytotoxin tirapazamine has been shown in murine tumor models and humans (12,40). Likewise, novel antiangiogenic drugs blocking αvβ3 integrins or other established antiangiogenic drugs will likely predominantly diminish access to nutrients and energy for tumor cells downstream of 125I-Gluco-RGD/αvβ3 integrin–positive vasculature. Therefore, heterogeneous tumors such as the investigated EMT6 tumors will likely be targeted best using a combination of hypoxia-activated cytotoxins and antiangiogenic drugs. Our results therefore clearly support a decisive role for specific molecular imaging in the selection of patients for targeted treatment and offer evidence supporting the combination of hypoxia-activated cytotoxins and antiangiogenic treatments.
Acknowledgments
We thank Prof. Friedrich Hammerschmidt (Institute of Organic Chemistry at the University of Vienna, Austria) for synthesis of the 18F-FAZA precursor. This study was supported by Deutsche Forschungsgemeinschaft grants Pi 242/3-1 and MA 1096/5-1 and by the Radiology Department of the University of Michigan.
Footnotes
-
COPYRIGHT © 2008 by the Society of Nuclear Medicine, Inc.
References
- Received for publication September 1, 2007.
- Accepted for publication December 27, 2007.


Jump to section
Related Articles
Cited By...
- Implementation of a Multicenter Biobanking Collaboration for Next-Generation Sequencing-Based Biomarker Discovery Based on Fresh Frozen Pretreatment Tumor Tissue Biopsies
- Multiparametric Analysis of the Relationship Between Tumor Hypoxia and Perfusion with 18F-Fluoroazomycin Arabinoside and 15O-H2O PET
- 18F-FAZA PET Imaging Response Tracks the Reoxygenation of Tumors in Mice upon Treatment with the Mitochondrial Complex I Inhibitor BAY 87-2243
- Quantum Dots for Cancer Research: Current Status, Remaining Issues, and Future Perspectives
- Reply: Intratumoral Spatial Distribution of Hypoxia and Angiogenesis Assessed by 18F-FAZA and 125I-Gluco-RGD Autoradiography
- Intratumoral Spatial Distribution of Hypoxia and Angiogenesis Assessed by 18F-FAZA and 125I-Gluco-RGD Autoradiography
- Correlative Imaging of Hypoxia and Angiogenesis in Oncology