


Abstract
The clinical identification and differential diagnosis of dementias is especially challenging in the early stages, but the need for early, accurate diagnosis has become more important, now that several medications for the treatment of mild to moderate Alzheimer’s disease (AD) are available. Many neurodegenerative diseases produce significant brain-function alterations detectable with PET or SPECT even when structural images with CT or MRI reveal no specific abnormalities. 18F-FDG PET images of AD demonstrate focally decreased cerebral metabolism involving especially the posterior cingulate and neocortical association cortices, while largely sparing the basal ganglia, thalamus, cerebellum, and cortex mediating primary sensory and motor functions. Assessment of the precise diagnostic accuracy of PET had until recently been hindered by the paucity of data on diagnoses made using PET and confirmed by definitive histopathologic examination. In the past few years, however, studies comparing neuropathologic examination with PET have established reliable and consistent accuracy for diagnostic evaluations using PET—accuracies substantially exceeding those of comparable studies of the diagnostic value of SPECT or of both modalities assessed side by side, or of clinical evaluations done without nuclear imaging. Similar data are emerging concerning the prognostic value of 18F-FDG PET. Improvements in the ability of PET to identify very early changes associated with AD and other neurodegenerative dementias are currently outpacing improvements in therapeutic options, but with advances in potential preventive and disease-modifying treatments appearing imminent, early detection and diagnosis will play an increasing role in the management of dementing illness.
Alzheimer’s disease (AD) is the leading neurodegenerative disorder and accounts for approximately two thirds of cases of dementia. AD currently affects 4 million people in the United States and is estimated to eventually affect 14 million as the aging of the baby boomers expands our geriatric population (1–3).
Advances in therapeutic agents for the treatment of AD have progressed substantially in the past decade. Cholinesterase inhibitors have successfully been used for a decade to delay cognitive decline associated with mild to moderate disease, and memantine was approved by the U.S. Food and Drug Administration last year for treating patients with more advanced AD. Similarly, neuroimaging techniques, including SPECT and PET, used in the evaluation and early detection of the disease have improved considerably.
AD can be diagnosed definitively only by histopathologic examination of brain tissue (4). The identification and differential diagnosis of AD is especially challenging in its early stages, partly because of the difficulty in distinguishing it from the mild decline in memory that can occur with normal aging and from mild cognitive manifestations of other neuropsychiatric conditions, such as depression, as well as other causes of dementia. Physicians frequently err both by failing to make the diagnosis of AD when the disease is present and by diagnosing early AD when it is absent (5–8). Moreover, clinical assessment frequently involves multiple examinations and laboratory tests over months or years.
The need for early, accurate diagnosis has become more important, now that several medications for the treatment of mild to moderate AD are available. Patients with neurodegenerative disease have the most to gain from therapy that intervenes as early as possible in the course of inexorably progressive, irreversible damage to brain tissue, and controlled clinical trials have demonstrated that cholinesterase inhibitors can improve, or delay decline in, memory and other cognitive functions in mild or moderately affected AD patients (9–15). These treatments can cut by more than half the proportion of patients requiring nursing home placement over a given time (16,17). Cholinergic (and other (18)) agents also are beneficial through reducing behavioral problems, improving patients’ functional abilities, and decreasing caregiver burden (13,19–22). Studies examining long-term effects of cholinesterase inhibitors indicate that drug treatment delays cognitive decline in AD patients by 9–12 mo on average and delays the need for institutionalization by 18 mo on average (19,23–25). Moreover, delaying the implementation of therapy by as little as 6 mo—besides carrying the inherent adverse consequence of depriving the patient of the short-term advantages of potentially enhanced cognitive and functional abilities during that time—may have long-term consequences as well (13,19,26). In a randomized, placebo-controlled trial of the cholinesterase inhibitor galantamine in patients with mild to moderate AD, Raskind et al. (13) found that the drug significantly improved cognitive function relative to placebo after 6 mo of treatment; during an ensuing 6-mo open-label treatment period, the patients who were originally in the placebo group were also given galantamine. At 1 y, better cognitive performance was seen in patients who began drug treatment at the beginning of the trial than in those whose treatment had been delayed for 6 mo. Similar benefits have also resulted from earlier institution of therapy with either rivastigmine (11) or donepezil (26). If functional neuroimaging is indicated for a particular patient, performing it within 6 mo of identifying progressive cognitive decline that could represent incipient AD would be prudent.
LIMITATIONS OF CONVENTIONAL CLINICAL EVALUATION
Few studies have specifically addressed the question of clinical detection of very mild disease, particularly in comparison with the standard criterion of histopathologic diagnosis. In an investigation aimed at doing so, patients who initially appeared healthy or minimally affected were followed up with repeated examinations for an average of 4 y (27). Even by the end of this longitudinal follow-up period, a neurologist detected AD in only 70% of the patients who were histologically positive for AD. In the recent report of the Quality Standards Subcommittee of the American Academy of Neurology (AAN) (28), the source of the most comprehensive guidelines and standards for the clinical evaluation of dementia in the last several years, 3 class I studies (7,29,30) were identified in which the diagnostic value of clinical assessment could meaningfully be measured. Class I indicates “a well designed prospective study in a broad spectrum of persons with the suspected condition, using a ‘gold standard’ for case definition, and enabling the assessment of appropriate tests of diagnostic accuracy.” Only one of them (7) focused on evaluating dementia at a relatively early stage. To be included in that investigation, patients were required to have had an onset of dementia symptoms within 1 y of entry. All 134 patients evaluated underwent a complete standardized diagnostic work-up comprising comprehensive medical history, physical examination, neurologic examination, neuropsychologic testing, laboratory testing, and structural neuroimaging and an average of 3 additional years of clinical follow-up with repeated testing. Sensitivity of this assessment for AD was 83%–85%, whereas specificity was 50%–55%, yielding an overall accuracy of 69%. In these studies, and in most similar studies, the reported sensitivities and specificities represent not the diagnostic accuracy of an initial clinical evaluation but the diagnostic accuracy of an entire series of evaluations repeated over a period of years.
When neuroimaging is performed in the evaluation of dementia, patients are usually referred for a structural imaging examination—that is, MRI or CT. Conventional MRI or CT of patients with symptoms of dementia may be useful for identifying unsuspected clinically significant lesions, present in approximately 5% of patients (28). However, in patients with AD (which is much more common), such scans are typically read as showing normal findings, as demonstrating the nonspecific finding of cortical atrophy, or as revealing ischemic changes that are (mis)interpreted as pointing to cerebrovascular disease as the primary or sole cause of the patient’s cognitive decline. The result could be failure to institute appropriate, timely pharmacotherapy (e.g., donepezil, rivastigmine, or galantamine, which are approved for the indication of “mild to moderate dementia of the Alzheimer’s type”). It is unfortunately not rare for that type of misinterpretation to occur, even among expert clinicians. In a multicenter study involving 7 university-affiliated AD Diagnostic and Treatment Centers, among patients in whom “vascular dementia” was diagnosed after clinical and structural neuroimaging evaluations and in whom other dementia diagnoses were specifically thought to be absent, fewer than 30% actually had isolated cerebrovascular disease, and the majority (55%) had AD on pathologic diagnosis (31).
NEURONUCLEAR IMAGING IN DEMENTIA ASSESSMENT
Over the last 2 decades, clinicians and researchers have obtained substantial experience in using the 3-dimensional imaging capabilities of PET and SPECT for the identification and differential diagnosis of dementia (32–34). Thousands of patients with clinically diagnosed and, in some cases, histopathologically confirmed AD from many independent laboratories have been studied using measures of cerebral blood flow, glucose metabolism, or oxygen use obtained through these tomographic neuronuclear imaging modalities. The principal findings from that experience briefly are as follows: A consistent pattern of focally decreased cerebral metabolism and perfusion has been identified, involving especially the posterior cingulate and neocortical association cortices but largely sparing the basal ganglia, thalamus, cerebellum, and cortex mediating primary sensory and motor functions. Most studies also reported greater sensitivity to disease severity for the parietal lobe deficit than for the temporal lobe deficit. Frontal lobe hypoperfusion was also often reported, but not in the absence of temporoparietal abnormalities. A pattern of focal cortical inhomogeneities, all accounted for by areas of infarction on MRI, implies dementia secondary to cerebrovascular disease, which also often affects cerebellum and subcortical structures. A pattern of focal cortical inhomogeneities unmatched by MRI findings is consistent with a primary neurodegenerative disorder (e.g., AD, Pick’s disease, other frontotemporal dementia, dementia with Lewy bodies, dementia of Parkinson’s disease, Huntington’s disease, or progressive subcortical gliosis.) As a rule, the pattern of bilateral temporoparietal hypoperfusion or hypometabolism well discriminates AD patients not only from age-matched healthy controls but also from patients with vascular dementia or frontal lobe dementia. However, more overlap of that pattern has been observed in patients with Lewy body dementia, Creutzfeldt–Jakob disease, and Parkinson’s disease with dementia (Table 1). Neuronuclear imaging abnormalities correlate not only with dementia severity and specific patterns of cognitive failure in AD patients but also with regional densities of neurofibrillary tangles (35).
Imaging Findings Pertaining to Differential Diagnosis of Dementias
RECENT STUDIES ON PET ACCURACY IN DEMENTIA EVALUATION
Diagnosis
Clinical applications of neuronuclear imaging in dementia patients stem from numerous studies that have found many neurodegenerative diseases to produce significant alterations in brain function detectable with SPECT or PET even when structural images with CT or MRI reveal no abnormality. The utility of PET in this regard has been under study since the early 1980s (36–39) and has been extensively reviewed more recently (40–45).
Thousands of patients with clinically diagnosed—and, in some cases, histopathologically confirmed—causes of dementia from many independent laboratories have been studied using PET measures of cerebral blood flow, glucose metabolism, or oxygen use. The best-studied application of this type is the use of 18F-FDG PET to evaluate AD. Table 2 presents published studies that assessed the diagnostic value of PET in the evaluation of dementia. The typically high sensitivity of 18F-FDG PET, even in patients with mild impairment, suggests that by the time a patient presents with symptoms of a neurodegenerative dementia, substantial alteration of cortical metabolic function generally has occurred. The associated decreases in glucose metabolism in certain brain areas are readily detectable on 18F-FDG images. Some visually evident differences between scans of patients with different dementing illnesses are seen in Figures 1–7.

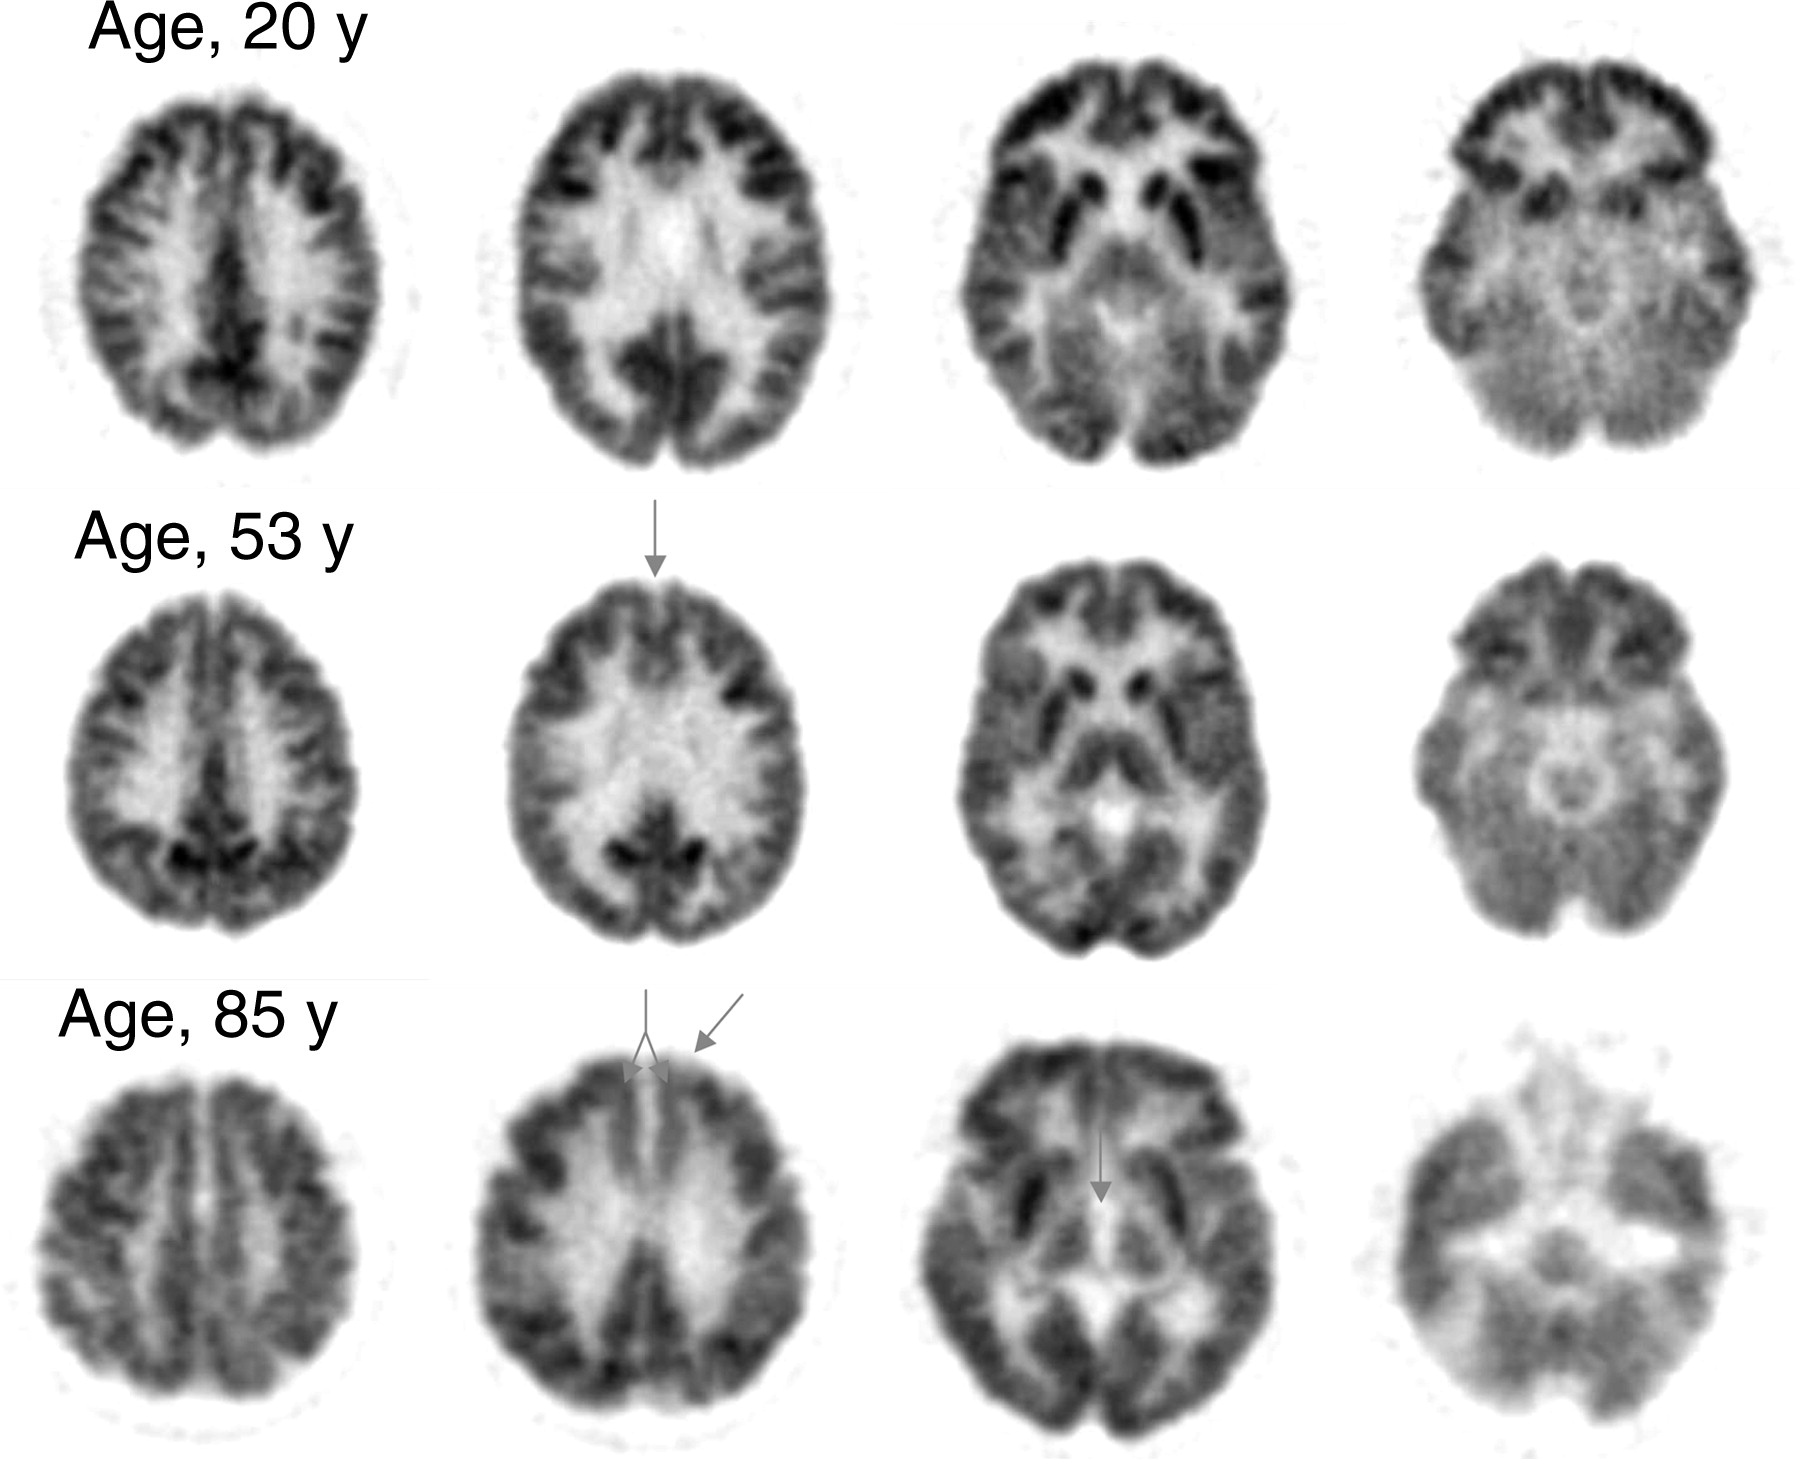
Normal adult pattern of cerebral glucose metabolism measured with 18F-FDG. Images are shown from the most superior (far left column) to most inferior (far right column) planes of the brain. In this and later figures, images are cross-sectional and are displayed with the anterior brain at the top of each image and the left side of the brain on the right of each image. Normal aging is associated with some increased generalized cortical atrophy, as evidenced by moderate widening (arrow) of the interthalamic distances in the 85-y-old patient (middle right). Additional arrows highlight the progression of mild metabolic decline, also attributable to normal aging, in the medial prefrontal cortex bilaterally (middle left, ages 53 and 85 y) and in the left anterior prefrontal cortex (middle left, age 85 y). Otherwise, in healthy adults, the pattern of regional cerebral metabolism changes little throughout adulthood.
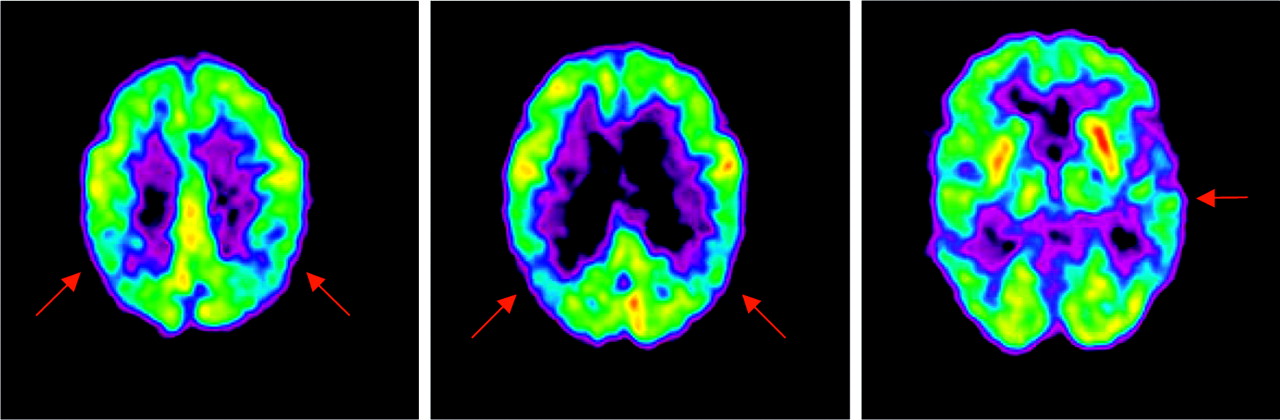
18F-FDG PET images of early AD. Early Alzheimer’s typically affects the parietal, temporal, and posterior cingulate cortices. Brain images of this 80-y-old woman demonstrate hypometabolism of the parietal cortex, bilaterally (left and middle), with relative sparing of the primary visual cortex, sensorimotor cortex, thalamus, and basal ganglia. In the early stages of AD, deficits often appear asymmetrically, as evidenced here by mild hypometabolism of the left temporal cortex (right). In later stages of the disease, degeneration will be apparent bilaterally.
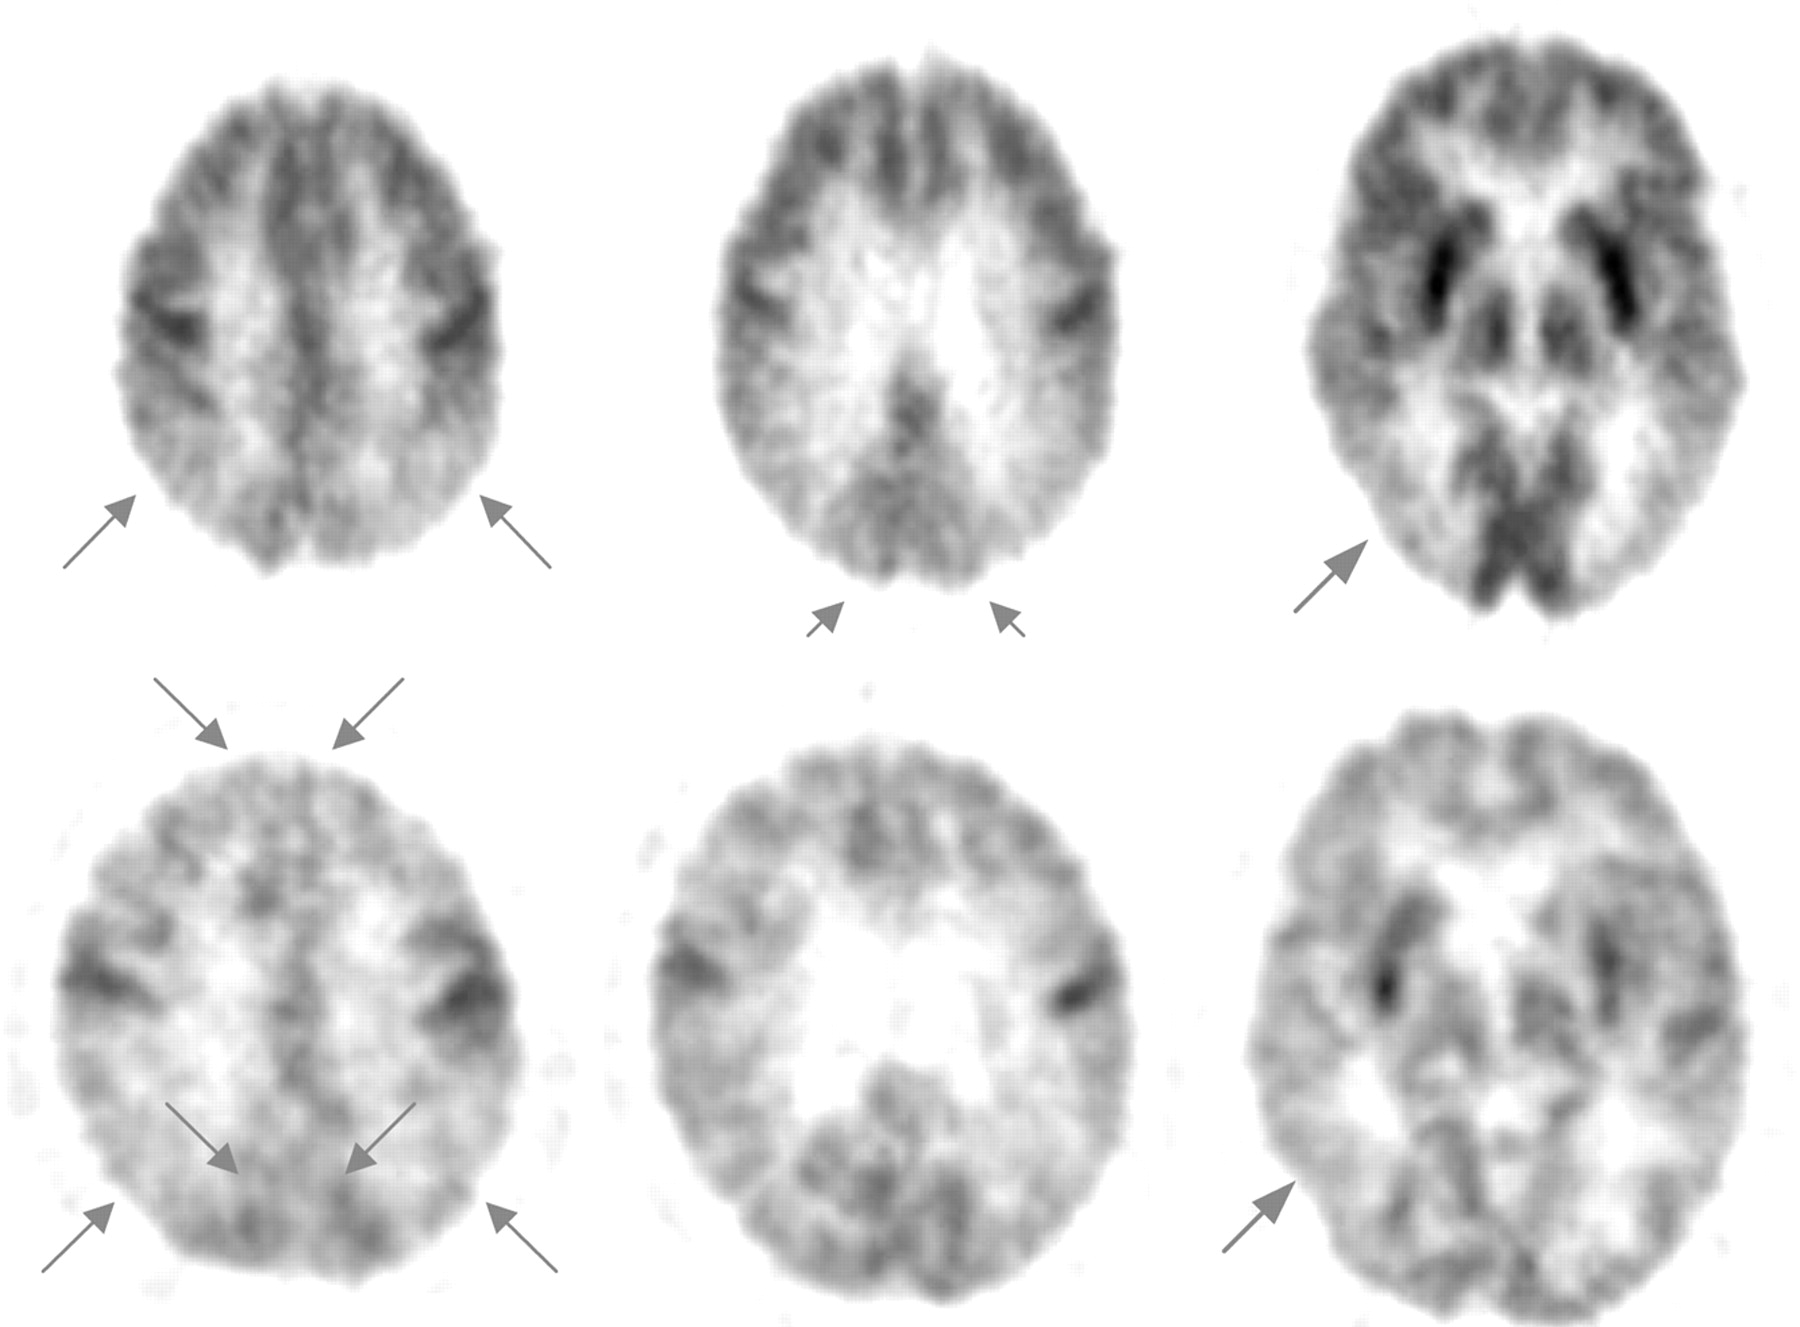
18F-FDG PET images of early- and late-stage dementia with Lewy bodies. Typical cerebral metabolic patterns for patients with dementia with Lewy body disease are similar to AD patterns, but with less sparing of the occipital cortex. A patient with early-stage disease (top row; 63-y-old woman) was clinically followed up for 28 mo, during which her MMSE score dropped from 23 to 14, of 30 possible points. The arrows on her scan highlight bilateral hypometabolism of the parietal (left) and occipital (middle) cortices, as well as hypometabolism of the posterior temporal cortex (right). A patient in a later stage of the disease (bottom row; 71-y-old man) has moderate to severe bilateral hypometabolism in the parietal cortex (left) and in the temporooccipital cortex (right), as similarly seen in the early-stage patient. Additional arrows in the left image refer to progression of hypometabolism in the occipital and prefrontal cortices, bilaterally.

18F-FDG PET images of Parkinson’s disease dementia. Typical patterns of regional cerebral metabolism are similar in Parkinson’s dementia and AD, with less sparing of the occipital cortex and more sparing of the mesiotemporal area. The diagnosis of Parkinson’s disease in this patient (72-y-old woman) was subsequently confirmed by autopsy. The arrows on her scan indicate parietal (left and middle images) and occipital (middle and right images) hypometabolism, whereas the 18F-FDG uptake in basal ganglia is undiminished at this stage of her disease.
18F-FDG PET images of vascular dementia. Hypometabolism affecting cortical, subcortical, and cerebellar areas is often seen in vascular dementia. This patient (65-y-old woman) was followed for 10 mo, and vascular dementia was diagnosed both clinically and by structural imaging. Arrows indicate hypometabolism of the right frontal cortex (far left, middle right), right parietal cortex (far left, middle left), right basal ganglia and thalamus (middle right), and right temporal cortex (far right). The hypometabolism of the left cerebellum (far right) is characteristic of cross-cerebellar diaschisis, caused by diminished afferent input from the contralateral cortex.

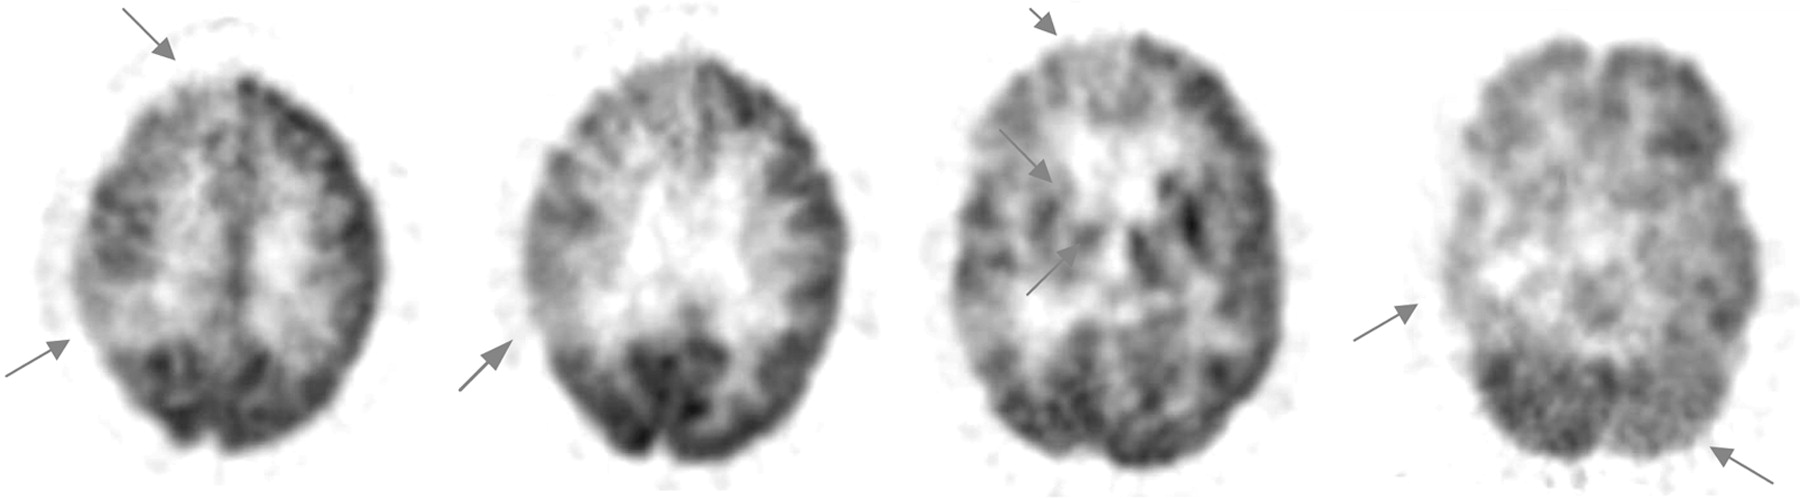
18F-FDG PET images of early frontotemporal dementia. This patient (66-y-old man) was diagnosed both clinically and by PET as having frontotemporal disease. The patient’s MMSE score at the time of PET was 27 of a possible 30 points. Arrows indicate bilateral hypometabolism of the frontal cortex (far left), at a time that the remainder of the cerebral activity is not appreciably affected (middle left, middle right, and far right).

18F-FDG PET images of Huntington’s disease. This patient (43-y-old man) has an 8-y history of progressive Huntington’s disease. Arrows highlight the typical metabolic pattern of hypometabolism severely affecting the basal ganglia (right) at a time that cortical metabolism is still relatively intact (left and middle). As the disease progresses, diffuse cortical involvement gradually develops.
Use of PET for Differential Diagnosis of AD
Assessment of the diagnostic accuracy of PET had until recently been hindered by the paucity of studies involving patients who were followed up long term or for whom subsequent pathologic diagnosis was available; most previous clinical series compared PET findings with clinical assessments performed near the time of PET. The ability of the latter approach to assess diagnostic accuracy is unfortunately limited by the potential inaccuracy of clinical diagnosis, particularly for patients presenting in the earliest stages of disease—a time when the opportunity for effective therapy, and for meaningful planning, is greatest.
Studies comparing neuropathologic examination with imaging are thus most informative in assessing the diagnostic value of PET. In a pooled analysis (44) of 3 previously published studies (46–48), the histopathologically confirmed sensitivity and specificity of PET for detecting the presence of AD were 92% and 71%, respectively. In the largest single-institution series, Hoffman et al. (49) found the sensitivity and specificity of PET for AD to fall in the range of 88%–93% and 63%–67%, respectively. A subsequent multicenter study collected data from an international consortium of clinical facilities that had acquired both 18F-FDG PET and histopathologic brain data for patients undergoing evaluation for dementia (50). The PET results identified AD patients with a sensitivity and specificity of 94% and 73%, respectively. This last study, which had more than 3 times as many patients as did the 4 previous studies combined, included a stratified examination of the subset of patients with documented early or mild disease. The performance of PET with respect to sensitivity (95%), specificity (71%), and overall accuracy (89%) was unaltered. These values agree with the ranges found in a broader literature review of PET studies, including those lacking neuropathologic confirmation of diagnoses (51). That review found reported sensitivities ranging from 90% to 96% and specificities ranging from 67% to 97%. The values also agree with a recent review of the PET literature reported by the AAN (28), which concluded that “PET scanning appears to have promise for use as an adjunct to clinical diagnosis [of AD],” based on its review of published studies that demonstrated diagnostic accuracies of 86%–100% for PET.
Regional cerebral metabolic changes associated with early AD can be detected with PET even before the symptomatic manifestations of the disease become evident (50,52,53). How accurate can 18F-FDG PET be in the evaluation of nondemented patients, who are in the earliest stages of cognitive impairment? Table 3 reviews the most recent 18F-FDG PET neuroimaging studies involving patients classified as cognitively impaired nondemented or having mild cognitive impairment. The studies were conducted or published between 2001 and 2003 and were found by searching PubMed in July 2003 (keywords: PET, cognitively impaired not demented, mild cognitive impairment) and by systematically checking the bibliographies of relevant articles so identified. The major criterion for inclusion was the use of 18F-FDG PET to evaluate cognitively impaired nondemented patients or patients with mild cognitive impairment as a specific subject subset in the study; investigations that did not involve 18F-FDG PET were excluded. Overall accuracies achieved with 18F-FDG PET have been nearly as high in very mildly affected patients as in demented patients, generally exceeding 80% and ranging from 75% to 100%, in these recent studies. PET may be especially valuable in this clinical setting, considering the difficulty of distinguishing these patients from those with mild memory loss attributed to normal aging.
18F-FDG PET in the Evaluation of Nondemented Subjects (Cognitively Unimpaired or Mildly Impaired)
Prognosis
18F-FDG PET may also serve explicitly as a prognostic tool, to determine likelihood of deterioration of mental status during the time after scanning. Relative hypometabolism of associative cortex can accurately predict whether cognitive decline will occur more quickly than would be expected for normal aging during the first several years after a PET evaluation (52,54). Moreover, the magnitude of decline during 2 y, for some standardized measures of memory, correlates with the initial degree of hypometabolism of inferior parietal, superior temporal, and posterior cingulate cortical regions (55). As cognitive impairment caused by neurodegenerative disease progresses, associated progression of regions of hypometabolism also occurs.
In a longitudinal evaluation of 170 patients who underwent brain PET, analyses were stratified according to presence of the most common comorbidities affecting cognitive function (other than primary neurodegenerative disease)—depression and thyroid disease—and according to scanner type (56). At the time of PET, more than one third (65/170, or 38%) of all patients were documented to have had a history of depression; 18%, a history of thyroid disease; and 6%, a history of both. PET findings accurately predicted, with a sensitivity of 91% (99/109), which patients would have a subsequent progressive course. Patients having a subsequent nonprogressive course were identified with a specificity of 80% (49/61). Of the patients without a history of depression or thyroid disease, the specificity of PET was nearly as high as its sensitivity (89%, with a 95% confidence interval [CI] of 77%–100%), but the specificity tended to be lower for patients with a history of depression or thyroid disease (74%, with a 95% CI of 59%–88%) than in those without either condition. In contrast, sensitivity was unaffected by the presence of those conditions (90%, with a 95% CI of 82%–98%, vs. 92%, with a 95% CI of 84%–100%). Although the prognosis of most subjects was correctly predicted by visual analysis of PET scans regardless of the presence of depression or thyroid disease, specificity tended to be lower for patients with a history of those conditions, and the overall false-positive rate of PET used in the prediction of a clinically progressive course of dementia was 3 times higher (3.5% [3/86] vs. 10.7% [9/84]) in patients with a history of depression or thyroid disease. It is thus suggested that physicians interpret positive brain scan findings with added caution when determining the prognosis for dementia in cognitively impaired patients with depression or thyroid disease, because of the potentially confounding effects of those conditions on regional brain metabolism (Figs. 8 and 9). What is also of clinical pertinence is that, because data were collected for almost a decade, scanner types changed during that time (e.g., brain PET conducted on the older generation of scanners contained only 15 planes, whereas scans obtained on the newer generation of scanners contained either 47 or 63 planes), and specificity tended to be higher for scans obtained on the newer generation of scanners (87%, with a 95% CI of 73%–100%, vs. 76%, with a 95% CI of 63%–90%).
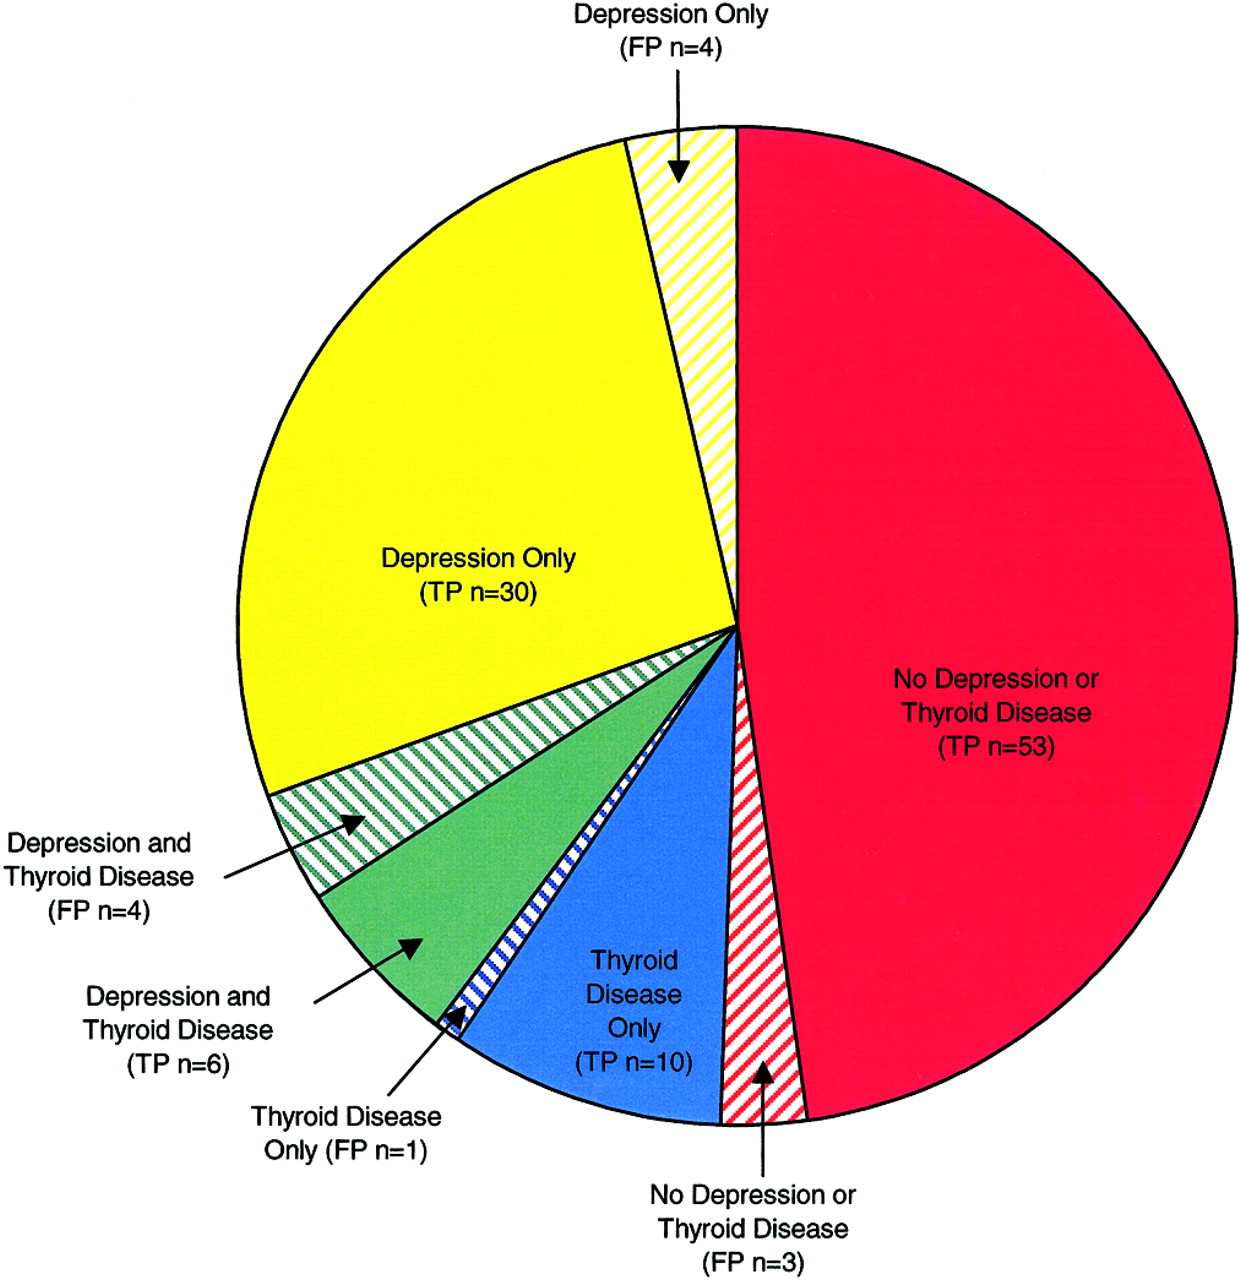
Distribution of 111 scan-positive cases among 170 patients undergoing PET for cognitive evaluation. TP = true positives; FP = false positives.

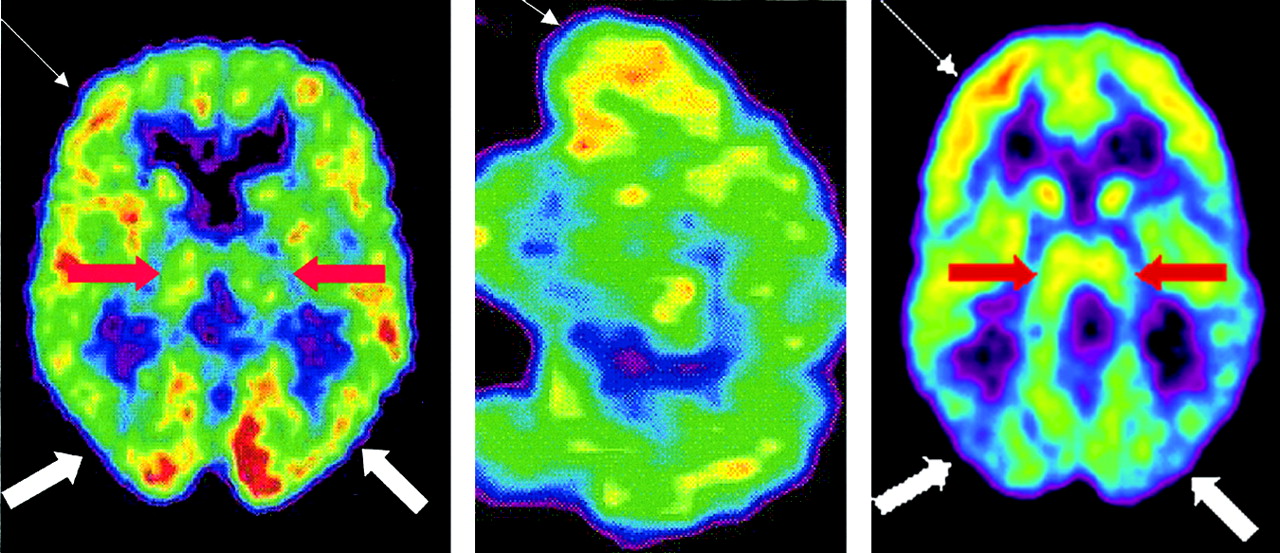
18F-FDG PET scans of a patient with false-positive findings and an AD patient. Shown are representative axial (left) and sagittal (middle) slices through an 18F-FDG PET brain scan of a 79-y-old woman undergoing clinical evaluation for cognitive impairment. The patient had a history of depression and thyroid disease and was receiving thyroid hormone replacement therapy at time of PET. The interpreting nuclear medicine physician had read the scan as consistent with early neurodegenerative changes in an Alzheimer-like pattern, because of the apparent relative decreased activity in the parietal cortex (bold white arrows), relative to the adjacent frontal and temporal cortex (thin white arrows). Longitudinal clinical follow-up for 2.5 y after the scan showed no progressive dementia, so the scan interpretation was classified as false positive. If this scan were being read now, the false-positive interpretation might have been avoided by comparing the thalamic activity (red arrows) to the parietal activity, with which it is approximately isometabolic, and to the (higher) frontal activity—in contrast to the pattern found in AD (right), in which parietal cortex becomes hypometabolic relative to the (preserved and normally isometabolic) thalamus.
It is interesting to consider the mechanistic basis that may underlie at least some of the false-positive associations. Bench et al. (57) reported that metabolism of certain cerebral regions correlates negatively with mood symptoms and severity of psychomotor slowing in depression; these regions included the inferior parietal and superior temporal cortex, areas also affected in AD. Effects of hypothyroidism on regional cerebral metabolism have also recently been described (58,59), involving relative reduction in parietal and temporal metabolism. These effects may further help explain the compromise in PET specificity associated with such conditions, particularly with older scanners lacking the resolution to distinguish characteristic patterns of regional involvement from similar but distinct regions.
With respect to the incremental value of PET beyond conventional clinical assessment, it was recently found that among patients having clinical working diagnoses presuming nonprogressive etiologies for their cognitive complaints, those whose PET patterns nevertheless indicated progressive dementia were more than 18 times more likely to experience progressive decline than were those with nonprogressive PET patterns (54). Neurologists who diagnosed progressive dementia in their patients were correct 84% of the time. Adding a positive diagnosis from a PET scan boosted the accuracy of that prediction to 94%, and negative PET findings made it 12 times more likely that the patient would remain cognitively stable.
COMPARISONS BETWEEN SPECT AND PET
SPECT has historically been the most widely available modality for functional imaging of the brain and thus became the one most commonly used in the clinical evaluation of dementia (60). Most of the clinical and research SPECT studies for this application have been perfusion based. Although the specific radiopharmaceuticals and instrumentation used in SPECT differ from those used in PET, the principles of interpretation, as well as the neurobiologic processes underlying the use of the 2 modalities, are similar. The primary practical differences in application are, first, the typically poorer spatial resolution of SPECT images relative to that of PET images and, second, the occasional loss of the generally parallel relationship between cortical metabolism (usually measured with PET) and perfusion in the presence of certain cerebrovascular disorders. In general, the magnitude of hypometabolism seen with 18F-FDG PET is generally greater than the amplitude of hypoperfusion seen with SPECT (61–63).
As might be expected, studies of AD using SPECT have yielded results similar to those using PET but typically with less sensitivity and decreased overall accuracy. Optima (Oxford Project to Investigate Memory in Aging) was a relatively large study that compared functional brain imaging data (SPECT regional cerebral blood flow) against clinical diagnosis and, in the dementia subset, autopsy diagnosis. The study included 70 dementia patients (all of whom had autopsy data) and 85 nondemented subjects (only 14 of whom had autopsy data) (64). Clinical diagnosis of probable AD was reported to have a 59% sensitivity and a 95% specificity for patients with an autopsy-confirmed diagnosis, and these values increased to 93% and 88%, respectively, for the combination of possible or probable AD. SPECT alone was reported to have a 63% sensitivity and a 93% specificity. The combination of SPECT findings positive for temporoparietal hypoperfusion and a clinical diagnosis of possible or probable AD was associated with a 96% sensitivity and an 84% specificity. These data were acquired with a single-head γ-camera with approximately 12-mm spatial resolution and may represent the lower end of sensitivity measurements possible with state-of-the-art equipment. These authors also used logistic regression analysis to compute the degree to which SPECT enhanced clinical diagnosis. Clinical diagnosis of probable AD alone was associated with an 84% chance of AD on death; positive SPECT findings raised the likelihood to 92%, whereas negative SPECT findings reduced the likelihood to 70%. For the diagnosis of possible AD, clinical measures alone had a 67% likelihood, which increased to 84% with positive SPECT findings and decreased to 52% with negative findings. Therefore, a clinical diagnosis of possible AD combined with a SPECT scan positive for temporoparietal hypoperfusion was as likely to be associated with AD at death as was clinical diagnosis of probable AD alone.
Unfortunately, in this study the nondemented controls were not control subjects in a clinically meaningful sense of the term: the mean Mini-Mental State Examination (MMSE) score for the patients was 13 ± 8 points (of a total of 30 possible points), whereas the mean MMSE of the “controls” was 29 ± 2. Subjects with cognitive performances so discrepant from those of the patient group would easily be distinguishable in clinical practice, even without formal dementia evaluation or functional imaging. Including them in the analysis thus lent a considerable but artificial boost to estimates of specificity and overall accuracy relative to how the test would perform in an actual clinical setting. In addition, the moderately severe degree of mean cognitive impairment of the AD cases may have increased the sensitivity estimates. Moreover, because 71 of the 85 control subjects were not autopsied, for the majority of non-AD cases clinical diagnosis was being compared with a gold standard of clinical diagnosis—a tautology that provided another artificial boost to specificity and overall accuracy. These problems are largely avoided, however, if the analysis is confined to the (autopsy-proven) dementia cases. Among those 70 patients, at a clinical diagnostic sensitivity for AD of 93% (43/46) (achieved by pooling both probable-AD and possible-AD patients), clinical specificity was 46% (11/24). Also among those cases, the sensitivity of SPECT for AD was 63% (29/46) and specificity was 75% (18/24), for an overall accuracy of 67% (47/70).
The higher diagnostic accuracy achievable with PET than with SPECT has been further borne out through side-by-side comparisons of the 2 modalities. These comparisons include studies using high-resolution SPECT scanners (34,66) on AD patients with mild symptoms (65), with data suggesting an increased accuracy of approximately 15%–20% for PET relative to SPECT. When considering the results of these types of comparative studies, it is worth noting that the utility of both PET and SPECT can be influenced by factors such as the spatial resolution and count sensitivity of detector configurations and by other instrumentation parameters, acquisition and processing techniques, methods and quality of image display, the interpretive criteria used, and the experience of the interpreters with each modality. In a recent study minimizing the impact of at least one (the last) of these factors, Herholz et al. (67) compared the ability of PET and SPECT to identify abnormalities in AD subjects, using statistical parametric mapping to assess the number of abnormal voxels relative to an age-matched control group for each technique. The best correspondence was in the temporoparietal and posterior cingulate cortices (r = 0.90). However, tracer uptake reductions were significantly more pronounced with PET than with SPECT. Herholz et al. also measured the correlation between dementia severity and the number of abnormal voxels. That correlation was somewhat better for PET than for SPECT. The higher sensitivity of PET may be especially relevant for identifying disease in its earliest stages to target patients for therapy while neurodegeneration is minimal.
CLINICAL ROLE OF NEURONUCLEAR IMAGING
As previously mentioned, in the recent report of the Quality Standards Subcommittee of the AAN (28), 3 studies (7,29,30) were identified in which the diagnostic value of conventional clinical assessment could be measured well (Table 4). If one accepts the recently affirmed AAN recommendation (28) that the National Institute of Neurological and Communicative Disorders and Stroke (NINCDS)-Alzheimers Disease and Related Disorders Association (ADRDA) criteria for “probable AD [rather than the more inclusive ‘possible AD’] should be routinely used,” then clinical sensitivity appears to range in the interval of 66% ± 17%, whereas PET sensitivity ranges in the interval of 91.5% ± 3.5%, relative to the standard criterion of neuropathologically confirmed diagnosis (Table 5). The sensitivity of clinical evaluation can be increased to 90.5% ± 5.5% (comparable to that using PET), but at the expense of specificity (55.5% ± 5.5% in the class I studies), by expanding the diagnosis of AD to include patients who meet NINCDS-ADRDA criteria for “possible AD” and including moderately and severely advanced dementia cases in the analysis. In contrast, at that level of sensitivity, the specificity using PET is 70% ± 3%. The AAN Quality Standards Subcommittee also reviewed 9 studies that addressed the clinical diagnostic accuracy of AD but were classified as having lower “quality of evidence.” Across all these studies, they found an average clinical specificity of 70% (as occurs with PET), whereas average sensitivity in that analysis was 81% (compared with the 91% ± 3% reported for PET). In the 2 largest class II studies that uniformly used NINCDS-ADRDA diagnostic criteria (31,68), at a sensitivity of 90% ± 1% (achieved by including “possible AD” patients and moderately advanced dementia cases), specificity fell to 29% ± 8%.
Sensitivity and Specificity of Conventional Clinical Evaluation, Compared with Neuropathologic Confirmation of Presence or Absence of AD
Ranges of Sensitivity and Specificity of Clinical Diagnoses Made With and Without the Use of PET, Compared with Neuropathologic Confirmation of Presence or Absence of AD
Thus, when the most reliable published measures of sensitivity and specificity in the diagnosis of AD (7,28–30) are applied to a comparison of diagnoses made with PET and diagnoses made without PET, one finds that both false-negative and false-positive diagnoses may substantially be decreased by adding PET to the diagnostic work-up of appropriately selected patients (69).
The available evidence supports considering PET for at least 2 groups of patients: patients with mild or moderate cognitive impairment who meet the standard criteria for dementia, the cause of which has not been identified by an appropriate and thorough medical work-up (group A; Table 6), or patients with mild or moderate cognitive impairment who exhibit progressive cognitive dysfunction that has not reversed after a thorough medical work-up including history taking, physical examination, neurologic examination, and indicated standard laboratory and structural neuroimaging tests along with appropriate treatment for any positive findings (group B; Table 7).
Impact of Diagnostic Accuracy Achievable with Use of PET, for Patients in Group A (Mild or Moderate Dementia of Unclear Etiology)
Impact of Diagnostic Accuracy Achievable with Use of PET, for Patients in Group B (Progressive Cognitive Decline That All Attempted Treatments Have Failed to Reverse)
For each of these 2 patient groups, the respective tables indicate the impact of the diagnostic accuracy achievable when PET is included as part of the medical work-up, relative to when it is not included. The high sensitivity of PET may be especially useful in identifying progressive dementia among those for whom suspicion of a progressive dementing illness is otherwise low; appropriate therapy to delay decline can then be started earlier. The best time to perform functional neuroimaging is thus early in the clinical work-up, as soon as the appropriateness of including neuroimaging in the evaluation of cerebrocortical dysfunction has been determined (69).
THE FUTURE
Although AD has no cure, symptomatic treatment has proven effective, especially in earlier stages of the disease, and therapies targeting etiology-based treatments are in development. Possible etiology-targeting cures in the future would be most effective during the milder phases of the disease, making an early clinical diagnosis of AD, when treatment can alter the progression of symptoms, especially important. Progress in understanding of the etiology of AD will lead to new and more effective methods of treatment.
Studies examining combination treatments are limited. Combining current treatments such as anticholinesterase inhibitors with other interventions may further improve the management of AD. For example, the proven benefits of the psychosocial intervention studied by Mittelman et al. (70) may be made more dramatic by combining it with anticholinesterase therapy, and studies of the combination of cholinesterase inhibitors with other agents such as memantine or vitamin E are under way. As more studies examine the combined effects of currently available treatments, a better understanding of multimodal treatment plans will emerge.
Current studies targeting earlier processes in the pathophysiologic changes of AD show potential for new treatment approaches. Rinne et al. (71) recently determined that acetylcholinesterase activity in the hippocampus differs significantly between control patients, patients with mild cognitive impairment, and patients with early AD. The ability to detect these differences may allow patients requiring therapeutic intervention to be identified early, before the onset of clinical symptoms. Other studies have focused on the amyloid precursor protein-cleaving enzyme responsible for β-site cleavage of amyloid precursor peptide, leading to formation of the amyloid-β-peptide implicated in the pathogenesis of AD (72). Inhibitors of this enzyme may potentially be applied for future therapeutic interventions for AD.
As our understanding of the biology of AD increases, we will be able to target future treatment options toward patients in those disease stages for which treatment is most appropriate and beneficial. Currently, the categorization of patients with memory deficits such as mild cognitive impairment and age-associated memory impairment is not universal. Although categorization is not uniform between different groups, the opportunity is arising to sort out and create categories that are more meaningful with regard to the underlying biology of the disease process, as made possible with diagnostic approaches such as 18F-FDG PET.
The biologic changes that occur with AD take place decades before the onset of clinical symptoms. Use of more powerful diagnostic approaches allows earlier detection of initial changes in a target population, before AD is diagnosed. Currently, tools for identifying the early changes of AD are outpacing available therapeutic options. With advances in potential disease-modifying treatments, the benefits of early detection will be even greater by allowing therapy to begin as early as possible.
Footnotes
Received Jan. 28, 2004; revision accepted Feb. 11, 2004.
For correspondence or reprints contact: Daniel H.S. Silverman, MD, PhD, Ahmanson Biological Imaging Division, UCLA Medical Center, CHS AR-144, MC694215, Los Angeles, CA 90095-6942.
E-mail: dsilver{at}ucla.edu
↵* NOTE: FOR CE CREDIT, YOU CAN ACCESS THIS ACTIVITY THROUGH THE SNM WEB SITE (http://www.snm.org/education/ce_online.html) THROUGH APRIL 2005.
REFERENCES
In this issue


Jump to section
Related Articles
Cited By...
- Early-Phase 18F-Florbetapir and 18F-Flutemetamol Images as Proxies of Brain Metabolism in a Memory Clinic Setting
- Comparison of Early-Phase 11C-Deuterium-L-Deprenyl and 11C-Pittsburgh Compound B PET for Assessing Brain Perfusion in Alzheimer Disease
- MRI-Based Attenuation Correction for PET/MRI Using Multiphase Level-Set Method
- Everything you wanted to know about neuroimaging and psychiatry, but were afraid to ask
- Neuroimaging in dementia: a practical guide
- Early 11C-PIB Frames and 18F-FDG PET Measures Are Comparable: A Study Validated in a Cohort of AD and FTLD Patients
- Preclinical Properties of 18F-AV-45: A PET Agent for A{beta} Plaques in the Brain
- SPECT imaging in dementia
- Role of Neuroimaging in Alzheimer's Disease, with Emphasis on Brain Perfusion SPECT
- Visual Assessment Versus Quantitative Assessment of 11C-PIB PET and 18F-FDG PET for Detection of Alzheimer's Disease
- Hypometabolism Exceeds Atrophy in Presymptomatic Early-Onset Familial Alzheimer's Disease