


Abstract
The aim of the present study is to compare brain atrophy with hypometabolism as preclinical markers of Alzheimer's disease (AD) by studying presymptomatic individuals from families with known early-onset autosomal dominant AD (FAD) carrying mutations in the Presenilin 1 gene. Methods: Seven asymptomatic at-risk FAD individuals (age, 35–49 y; 4 women; education ≥ 12 y) and 7 matched healthy control subjects received complete clinical, neuropsychologic, MRI, and 18F-FDG PET examinations. Regions of interest (ROIs: whole brain [WB], hippocampus [Hip], entorhinal cortex [EC], posterior cingulate cortex [PCC], inferior parietal lobule [IPL], and superior temporal gyrus (STG]) were drawn on the MRI scans of all subjects and used to measure volumes on MRI and glucose metabolism (MRglc) from the MRI-coregistered, atrophy-corrected PET scans. Results: Compared with controls and after correcting for head size, MRI volume reductions in FAD subjects were restricted to the IPL (18%, P < 0.02). After atrophy correction and adjusting for pons MRglc, PET MRglc reductions were found in all FAD subjects compared with controls in the WB (13%), bilaterally in the IPL (17%) and in the STG (12%), and in the left EC (21%), PCC (20%), and Hip (12%) (P values < 0.05). PET MRglc measurements were consistently less variable than MRI measures, yielding significantly larger effect sizes in separating FAD from controls. Conclusion: Presymptomatic FAD individuals show widespread MRglc reductions consistent with the typical AD PET pattern in the relative absence of structural brain atrophy. These data further suggest that PET MRglc measures may serve as biomarkers for the preclinical diagnosis of AD.
To develop prevention treatments for Alzheimer's disease (AD) it is necessary to identify early biologic markers that are predictive of AD. To date, the best-recognized in vivo markers of AD are measures of brain structure and function as obtained with neuroimaging. Brain volume loss (atrophy), as assessed on MRI, and reductions in the metabolic rate of glucose (MRglc), as measured with 18F-FDG PET, are sensitive to AD-related brain changes. A crucial question is whether these brain measures are capable of preclinical detection of dementia. Understanding how AD starts and progresses requires following subjects through normal aging to the onset of clinical symptoms. However, given the low incidence and slow progression of healthy elderly to AD (1), such studies are hindered by the need for very large samples and long follow-up intervals to observe significant numbers of declines.
An alternative has been to examine individuals from families with early-onset AD with known genetic mutations. Familial AD (FAD) is characterized by autosomal dominant inheritance with nearly 100% penetrance and a specific age of onset for a given pedigree (2). Therefore, presymptomatic at-risk individuals close to the expected age of onset may provide unique information about preclinical AD-related brain changes.
As these rare genetic mutations are found in 5% of the AD cases in the general population (2), only a few neuroimaging studies on FAD exist, particularly in individuals at a presymptomatic stage. Most FAD studies were done with MRI and revealed that the onset of dementia is accompanied by progressive structural atrophy in the hippocampal formation and in the neocortical regions (3,4). The few 18F-FDG PET studies on FAD, including at-risk and sympomatic individuals, showed severe cortical MRglc reductions in the parietotemporal and posterior cingulate cortices compared with control subjects (5,6). However, to our knowledge, no study has compared the MRI atrophy and PET MRglc measures.
By using MRI and 18F-FDG PET, the aim of the present study was to examine brain atrophy and hypometabolism as early indicators of future AD by studying presymptomatic at-risk individuals from families with known early-onset AD as caused by mutations in the Presenilin 1 (PS-1) gene.
MATERIALS AND METHODS
Subjects
Seven at-risk individuals from 3 unrelated Italian families with known early-onset autosomal dominant FAD (7–9) carrying mutations in the PS-1 gene were enrolled in an ongoing longitudinal clinical/MRI/FDG PET study at the University of Florence (UoF), Italy. These individuals were compared with 7 healthy, medication-free, age-, sex-, and education-matched control subjects. The 7 control subjects were 3 siblings from the same Italian families who did not carry the genetic mutations (7–9) and 4 healthy subjects derived from the clinical/MRI/FDG PET database of healthy volunteers at the Center for Brain Health at the New York University (NYU) School of Medicine. Both centers administer several identical neuropsychologic tests, use comparable criteria for the definition of normality, follow the recommendations of the NINCDS–ADRDA work group (10) and the Diagnostic and Statistical Manual of Mental Disorders (DSM-IV) (11) criteria for the diagnosis of AD, and use common standardized imaging acquisition protocols.
All subjects received an extensive screening and diagnostic battery that consisted of medical, neurologic, psychiatric, neuropsychologic, MRI, and 18F-FDG PET examinations. Criteria for the diagnosis of normal (or asymptomatic in FAD individuals) were (a) no evidence of functional impairment in the subject based on intensive interviews and (b) a structured clinical interview resulting in a Clinical Dementia Rating (CDR) score = 0 (12) or Global Deterioration Scale (GDS) score = 1 (13).
The clinical impression for 1 FAD subject (Table 1, FAD-3) was less certain, and at the clinical consensus meeting this subject was assigned a CDR score of 0.5, which indicates mild functional impairments that do not reach a dementia level (12). However, this subject was included in the present study, as the subject was considered to be asymptomatic by himself and the family.
Subjects' Characteristics
None of the subjects had evidence of conditions affecting brain structure or function—that is, stroke, clinically uncontrolled diabetes, major head trauma, and depression as assessed on the Hamilton Psychiatric Rating Scale for Depression (14) or use of cognitively active medications. The participants provided informed consent and were studied under guidelines approved by the Institutional Review Board, local ethics committees, and radiation-protection authorities at both institutions.
The subjects completed a detailed battery of neuropsychologic tests, including the Mini-Mental State Examination (MMSE), immediate and delayed recall of paired associates, copy and recall of the Rey's complex figure, the designs test, the Token test, the Stroop test, Trail making test, and Phonemic fluency tests (15). For all of these tests, normative reference values exist (15).
Genotyping
Genomic DNA from individuals known to belong to families with early-onset FAD was extracted from peripheral blood samples with the phenol–chloroform procedure, and all coding and 5′ noncoding exons of the PS-1 gene were analyzed with polymerase chain reaction (PCR) amplification (7–9). Single-strand conformation polymorphism (SSCP) was performed and, in the presence of irregular SSCP patterns, PCR products were sequenced. Apolipoprotein E (ApoE) genotyping was also performed using standard PCR analysis. Of the 7 FAD individuals, 3 carried Leu392Val, 1 carried Met146Leu, and 3 carried Cys92Ser mutations in the PS-1 gene (7–9) (Table 1). Description of codon changes and phenotypic profiles and information about the expected age at onset for these 3 mutations are available from symptomatic FAD individuals from the same families as well as other families as described (7–9) (http://www.molgen.ua.ac.be/ADMutations). The mean age at onset for the family carrying the Leu392Val mutation is 45 ± 4 y (range, 40–48 y) (8), for the family carrying the Met146Leu mutation is 41 ± 4 y (range, 38–45 y), and for the family carrying the Cys92Ser mutation is 62 ± 4 y (range, 56–67 y) (7,9).
Brain Imaging
MRI Study.
All subjects received a standardized MRI scan protocol, which included a clinical and a research MRI scan. The clinical scan covered the entire brain with contiguous 3-mm axial T2–weighted and proton density–weighted images. The research MRI scan was acquired at both centers with a 3-dimensional (3D) T1-weighted fast-gradient-echo sequence on a 1.5-T magnet (UoF [Gyroscan ACS-NT; Philips Medical Systems]: repetition time [TR] = 25 ms, echo time [TE] = 4.6 ms, flip angle = 30°, matrix = 256 × 160; NYU [Signa; GE Healthcare]: TR = 35 ms, TE = 9 ms, flip angle = 60°, matrix = 256 × 128), yielding identical tissue contrast. Images were reconstructed into 124 contiguous slices with 1.3-mm slice thickness in a coronal orientation perpendicular to the long axis of the hippocampus (Hip).
18F-FDG PET Study.
Within 1 mo of the MRI, all subjects received a PET scan using 18F-FDG as the tracer, using common and standardized procedures and scanners with comparable spatial resolution (UoF: Advance scanner [GE Healthcare], in-plane axial resolution = 4.6 mm, slice thickness = 4.25 mm, axial field of view [FOV] = 154 mm; NYU: ECAT EXACT HR+ scanner [Siemens], in-plane full width at half maximum [FWHM] = 4.5 mm, slice thickness = 4.23 mm, axial FOV = 155 mm). Each subject's head was positioned using 2 orthogonal laser beams and imaged with the scanner tilted 25° negative to the canthomeatal plane, which runs approximately parallel to the long axis of the Hip. To reduce head movement during scanning, a molded plastic head holder was custom-made for each subject. Attenuation correction was obtained using 68Ga/68Ge transmission scans. Subjects received 110–370 MBq (∼5.28 MBq/kg body weight) of 18F-FDG intravenously while laying supine in a dimly lit room. PET images were acquired ∼35 min after isotope injection and lasted for 20 min. Images were reconstructed using the Hanning filter with a frequency cutoff of 0.5 cycle/pixel and resized using a bilinear extrapolation scheme to a 256 × 256 matrix with pixel size = 1.52 mm and slice thickness = 4.25 mm.
Image Analysis
PET/MRI Coregistration and Atrophy Correction.
All image processing and data analysis were performed at NYU. MRI and PET scans were transferred to a Sun Sparc workstation (Sun Microsystems), where each PET scan was coregistered with the corresponding MR image by using a 3D method based on minimizing the variance of the signal ratios implemented in the Multimodal Image Data Analysis System package (MIDAS, version 1.6) (16). The implementation calls for a preliminary spatial alignment, using intrinsic anatomic landmarks followed by a surface-fitting algorithm (16). The coregistered PET/MR images consisted of coronal sections perpendicular to the long axis of the Hip (256 × 256 × 91 matrix, 1-mm2 pixel size, 2-mm slice thickness).
After MRI coregistration, PET scans were corrected for the partial-volume effects of cerebrospinal fluid (CSF) using a 2-segment model (i.e., brain tissue and CSF) (17–19). On the basis of phantom-validated threshold techniques, MRI regions are locally sampled to minimize radiofrequency coil inhomogeneity (20) and converted to binary images, where pixels corresponding to brain are given a value of 1 and those corresponding to nonbrain—such as CSF and air spaces—are given a value of 0. This binary image is convolved with the 3D point spread function of the PET camera, resulting in a recovery coefficient (RC) image, and the coregistered PET image is divided by the RC image to yield PET images corrected for the partial volume of CSF. The atrophy-corrected and noncorrected PET scans were sampled using the MRI regions of interest (ROIs).
ROIs.
The ROI technique was chosen for image analysis because it allows one to directly compare hypometabolism with atrophy within the same brain region and to examine small structures such as the Hip with high anatomic precision. The selected ROIs included 2 medial temporal lobe (MTL) structures (Hip and the anterior portion of the parahippocampal gyrus, which corresponds to the entorhinal cortex [EC]) and 3 cortical regions (inferior parietal lobule [IPL], superior temporal gyrus [STG], and posterior cingulate cortex [PCC]), which are typically affected in AD (21,22). Figure 1 provides a visual depiction of the ROIs. One author who was unaware of subject diagnosis drew all ROIs in both hemispheres using MIDAS. The intrarater reliability for these ROIs, as measured using intraclass correlation coefficients (ICCs), ranges from ICC = 0.92 for the STG to ICC = 0.99 for the Hip (P values < 0.001) (18,19,23,24). The MRI ROIs were used to sample MRglc from the MRI coregistered PET images for the following brain regions:

ROI drawings are displayed on coronal (A and B) and left sagittal (C and D) MR images of a representative FAD subject (FAD-1). (A) Hippocampus (1), entorhinal cortex (2), superior temporal gyrus (3). (B) Ventricles (4), whole brain (5). (C) Posterior cingulate cortex (6). (D) Inferior parietal lobe (7). Left medial temporal lobe is shown magnified in A to highlight hippocampal (1) and entorhinal cortex (2) ROIs.
EC.
The anterior boundary was 4 mm posterior to the frontotemporal junction, and the posterior boundary was the anterior margin of the lateral geniculate body. The superior boundary in both anterior and posterior sections was the dorsal and most medial aspect of the parahippocampal gyrus (PHG). The inferior boundary was the rhinal or collateral sulcus (18,19,24).
Hip.
Drawings were performed along the full anterior–posterior extent of the pes hippocampus and included a portion of the subiculum. The lateral border was the temporal horn of the lateral ventricle, and the medial border was the ambient cistern. The inferior border was the white matter (WM) of the PHG. Most anterior, the Hip was distinguished from the amygdaloid body by fibers of WM interposed between these regions (18,19,23,24).
IPL.
This region was drawn on all slices between the posterior commissure and the slice immediately caudal to the posterior limit of the splenium of the corpus callosum (25). At the surface, the superior boundary was the postcentral sulcus and the inferior boundary was the most superior branch of the lateral sulcus. This ROI includes most of Brodmann area (BA) 40.
PCC.
This region is bounded by the cingulate and callosal sulci and extends laterally to include all gray matter of the cingulate gyrus. Its posterior boundary coincides with the occipitoparietal sulcus. This region includes BA 23 and the retrosplenial cortex (BA 29 and BA 30), which was shown to be affected in mild cognitive impairment (MCI) and mild AD (26).
STG.
This region spans from the anterior EC to the posterior crux of the fornix, is bound superiorly by the sylvan fissure and inferiorly by the superior temporal sulcus (18,19), and corresponds to BA 22.
Whole Brain (WB).
A WB ROI was drawn on the MRI scans by excluding all nonbrain voxels—that is, scalp tissue, skull and dural venous sinus, as well as CSF-containing voxels.
Ventricles.
Ventricular volume was measured with a 3D ROI constructed to span the ventricular CSF that excluded subarachnoid CSF on MRI.
Reference Regions.
The MRI ROI volumes were corrected for between-subject variations in head size (HS) by using the volume of the intradural supratentorial volume (19). The 18F-FDG PET ROI MRglc data were corrected for variations in the global MRglc using pons MRglc, which was reported as the brain region least metabolically affected in AD (27). Pons MRglc was sampled at the center of a midpontine slice at the level of the middle cerebral peduncles with an 8 × 8 mm box (19,23).
Data Analysis
Qualitative Evaluations.
All scans were visually inspected by 2 raters for the presence of significant atrophy on MRI and hypometabolism on 18F-FDG PET using published protocols with known intra- and interrater reliabilities (24,28,29). Each 18F-FDG PET and MRI scan was independently rated by both observers and the final diagnosis was made by joint agreement.
Quantitative Analysis.
Statistical analyses were done using SPSS 12.0 (SPSS Inc.). Ratios were created for all ROIs by dividing the MRI volume measures by the HS and by dividing the 18F-FDG PET MRglc measures by pons MRglc. 18F-FDG PET analyses were done with and without atrophy correction. Descriptive statistics included the arithmetic mean (SD) and the coefficient of variation (%CV = [SD/mean] · 100). The statistical significance of group differences was tested for each neuropsychologic variable and ROI measure using the Mann–Whitney rank sum test (α = 0.05, 1-sided, exact inference) (30). Whereas the MRI and 18F-FDG PET scans of the FAD subjects were acquired on the same MRI or PET scanner, those of the control group were acquired using different scanners. Although the scanners had comparable resolution, the Mann–Whitney test was used to examine whether scanner effects were present within the control group before other statistical analyses. Neither the MRI volumes nor the MRglc values showed scanner effects in any ROIs (P > 1).
Cohen's d tests (31) were used to calculate effect sizes (ES) for all ROIs and to compare the capability of MRI volumes and PET MRglc measures in detecting group differences. An ES of 0 indicates complete overlap of the 2 groups, whereas ES ≥ 1 are considered significant, with an ES of 1 indicating 55.4% of non-overlap between groups. Logistic regressions with cross-validation (leave-one-out classification) were used to assess whether group membership could be predicted using MRI volumes and 18F-FDG PET MRglc measures.
RESULTS
Subjects
Clinical and neuropsychologic data of the individual FAD subjects and the control group are found in Table 1. Two FAD subjects from different families carrying Leu392Val (FAD-2) and Met146Leu (FAD-3) mutations were examined 1 y before the mean age of onset for each respective pedigree, and the other 5 FAD subjects were examined, on average, 13 ± 9 y before the anticipated mean age at onset (range, 2 y for Leu392Val mutation to 27 y for Cys92Ser mutation) (7,9). Two FAD subjects (FAD-2 and FAD-5) were heterozygous for the ApoE E4 allele. Five FAD subjects had MMSE scores of 30 of 30, and 2 individuals scored 27 of 30 (FAD-5) and 25 of 30 (FAD-6), respectively. The FAD subjects scored in the normal range of all neuropsychologic tests administered (Table 1) except on the delayed recall of Rey's complex figure (P = 0.01).
Brain Imaging Data
Qualitative Analysis.
We found 100% interrater agreement with respect to the 18F-FDG PET scans. With respect to the MRI scans, the 2 raters disagreed only on the MRI of subject FAD-6, whose MRI was deemed to be normal for age, as no global atrophy or ventricular enlargement was evident, whereas the other observer judged the MRI to show mild atrophy restricted to the posterior cortical regions. The subject was diagnosed as showing mild posterior brain atrophy by joint agreement.
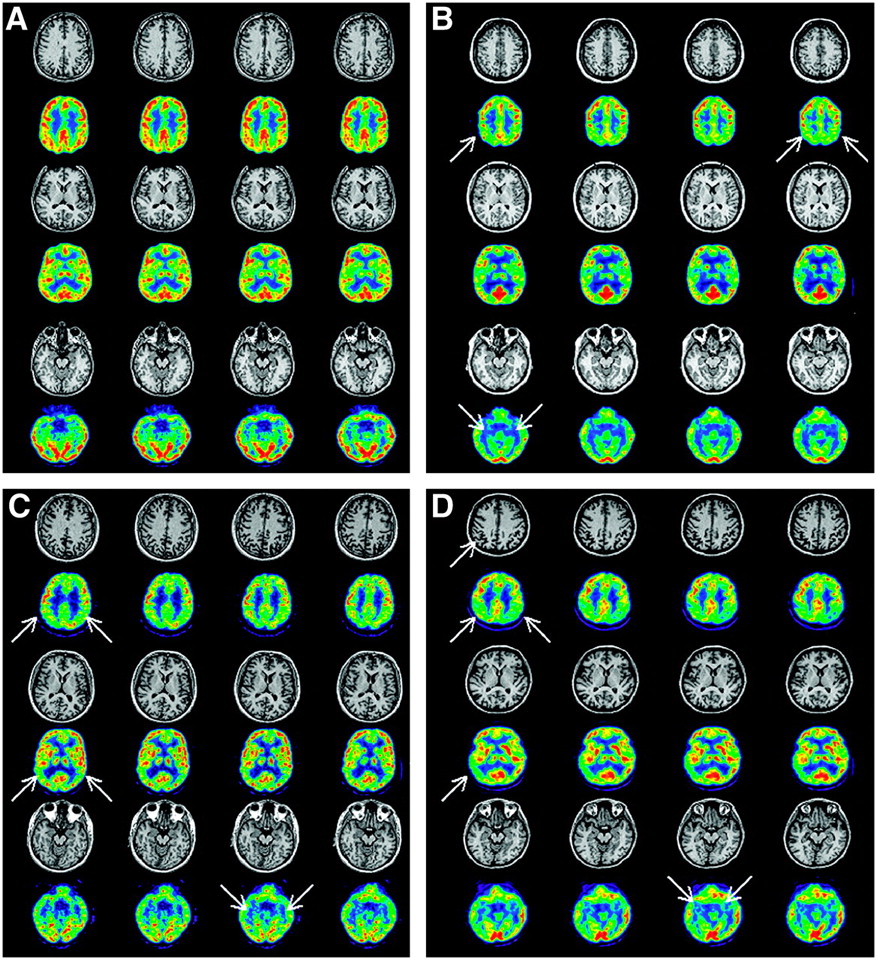
None of the subjects presented with vascular or significant WM lesions. On visual examination, none of the FAD subjects showed cortical and MTL atrophy on MRI, except for subject FAD-6—with the lowest MMSE scores and 49 y of age—who showed mild atrophy localized in the superior parietal lobe/precuneus (Table 1; Fig. 2D). Interestingly, the FAD subject with questionable impairment (FAD-3) did not show cortical or MTL atrophy on MRI, whereas parietotemporal and MTL hypometabolism was evident on PET (Fig. 2C). Cortical hypometabolism on 18F-FDG PET was observed in all FAD subjects, primarily involving the parietal and temporal regions. All FAD subjects showed mild-to-severe MTL hypometabolism (24). None of the control subjects showed abnormalities on 18F-FDG PET visual inspection. Figure 2 shows the 18F-FDG PET and MRI scans of 3 FAD subjects who presented with regional hypometabolism in the absence of structural atrophy.

MRI and 18F-FDG PET scans of 4 subjects. (A) Control subject, male, age = 40 y, MMSE = 30, CDR = 0. (B) FAD, female, age = 35 y, MMSE = 30, CDR = 0 (Table 1, FAD-1). Bilateral hypometabolism of parietal cortex and MTL is evident on PET in absence of atrophy on MRI. Hypometabolism is more severe in left hemisphere. (C) FAD, male, age = 41 y, MMSE = 30, CDR = 0.5 (Table 1, FAD-3). Bilateral hypometabolism of parietal and temporal cortices and of MTL is evident on PET in absence of atrophy on MRI. MTL hypometabolism is more severe in left hemisphere. (D) FAD, female, age = 47 y, MMSE = 25, CDR = 0 (Table 1, FAD-6). Hypometabolism of parietal regions and MTL (bilaterally) and of left temporal lobe is evident on PET. Mild atrophy is present on MRI in parietal/precuneus regions. Within these regions, atrophy correction increased the MRglc measures by 10%, which were still 1 SD below control subjects' mean. Coregistered PET and MRI scans are shown at high (top row), middle (middle row), and low (bottom row) transaxial levels. PET scans are displayed in a blue-to-red color-coded scale, with intensity in each pixel representing radioactive counts per second. 18F-FDG PET images are shown using the same color scale. Areas of regional hypometabolism on PET are indicated by arrows on first slice showing abnormalities.
Quantitative Analysis.
MRI volume data are found in Table 2]. There was no HS difference between FAD and control subjects. The ROI volume study showed that, compared with controls, the FAD subjects showed volume reductions only in the IPL (left: 18%, P = 0.017; right: 19%, P = 0.007). The FAD group did not show global atrophy (P = 0.26, not significant [NS]) and ventricular enlargement (P = 0.46, NS) compared with control subjects.
MRI and 18F-FDG PET Data
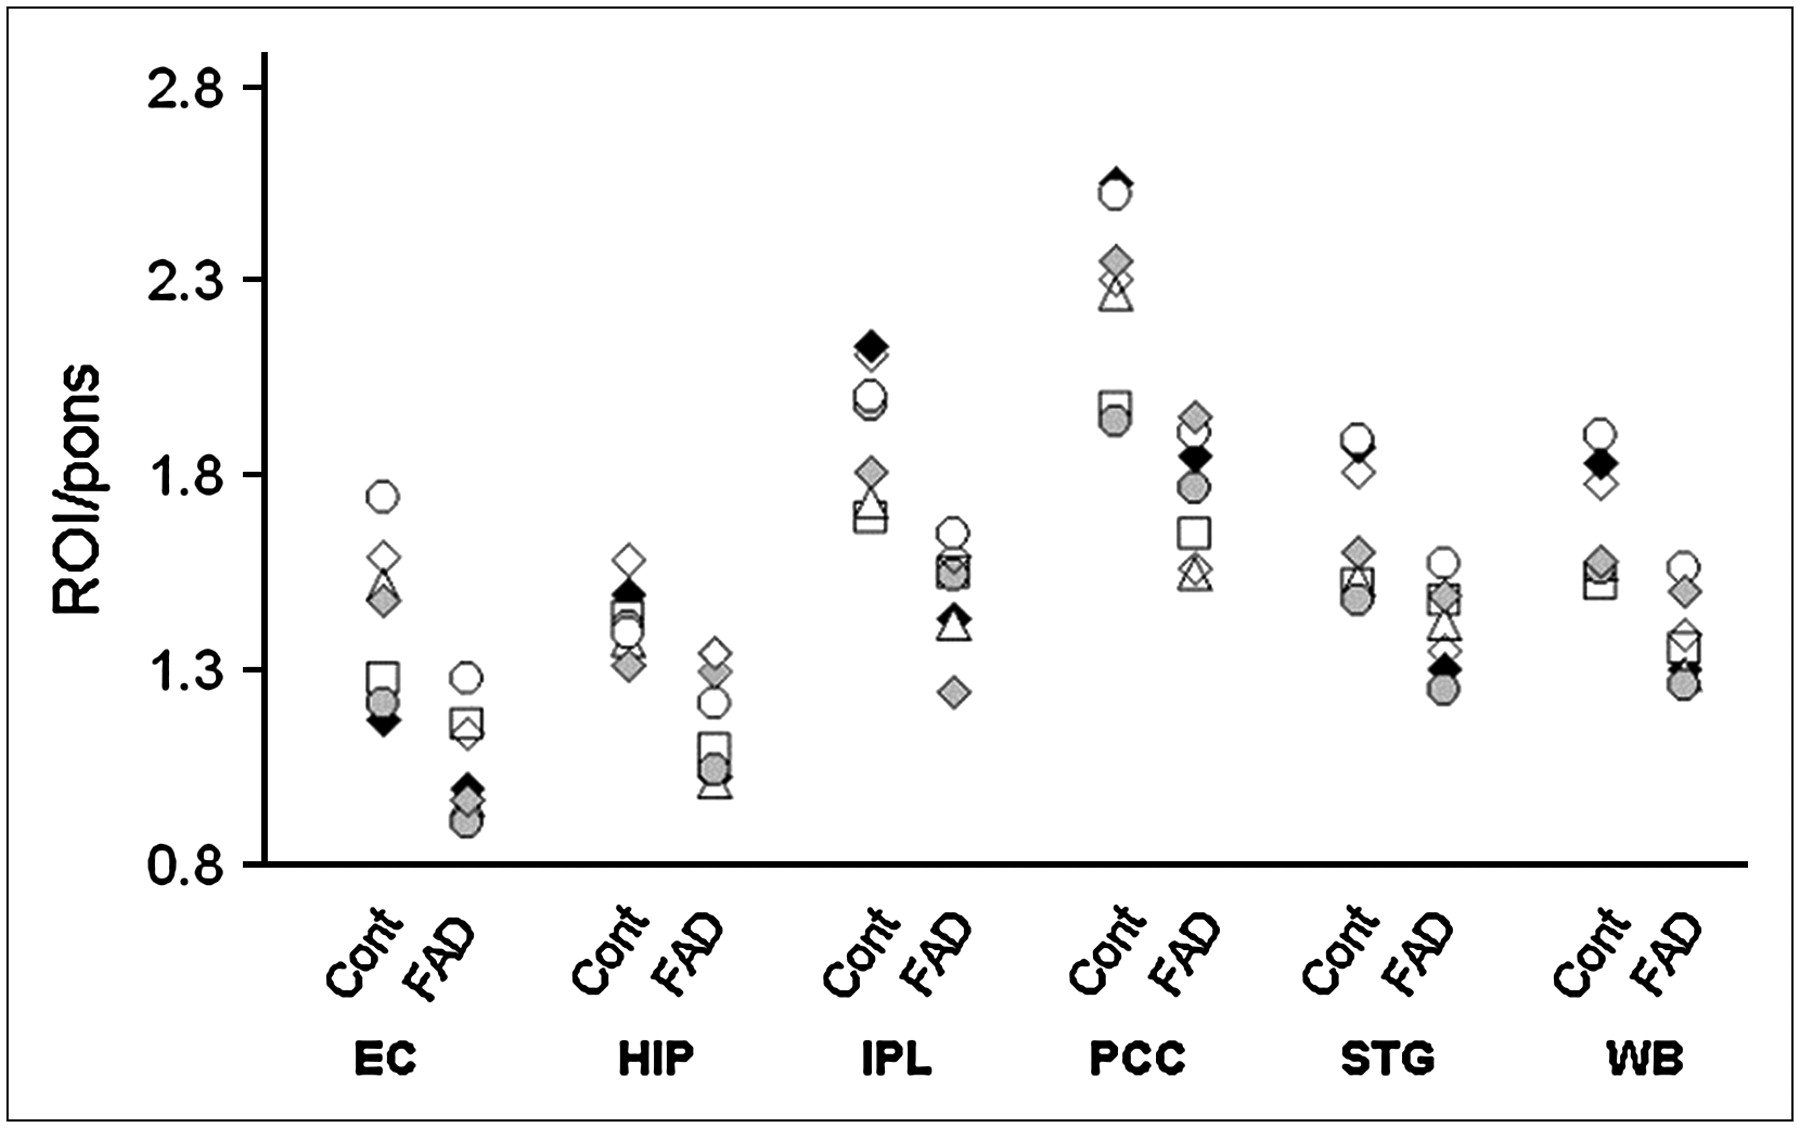
Table 2 presents 18F-FDG PET data. Atrophy correction increased regional MRglc by 0%–10% in control subjects and 2%–12% in FAD subjects, with the greatest adjustment seen in the EC for both groups. Non-atrophy–corrected MRglc data are found in Table 2. The following results are restricted to the atrophy-corrected MRglc data. No difference was found for pons MRglc between FAD and control subjects. Compared with controls, the FAD subjects showed MRglc reductions in the WB (13%, P = 0.017) and bilaterally in the IPL (left: 16%, P = 0.026; right: 17%, P = 0.038) and STG (left: 11%, P = 0.044; right: 13%, P = 0.039). Unilateral MRglc reductions were found in the left hemisphere for the EC (21%, P = 0.017), PCC (20%, P = 0.007), and Hip (12%, P = 0.039) (Table 2). As shown in Figure 3, each FAD subject showed consistently reduced MRglc values compared with the respective age-matched control.

18F-FDG PET MRglc data for age-, sex-, and education-matched control and FAD subjects. Regional MRglc is averaged across hemispheres. Compared with respective control subjects, all FAD subjects show reduced MRglc values. Two FAD subjects with MMSE scores of 27 of 30 (FAD-5) and 25 of 30 (FAD-6) are marked with a white circle and a white diamond, respectively, and 1 FAD subject with questionable impairment (FAD-3) is marked with a white triangle. Note that these subjects were not driving statistical effects. HIP = hippocampus.
MRI and 18F-FDG PET effect sizes were examined. PET MRglc measures tended to be less variable than MRI volume measures, yielding CV (%) values in the FAD group of <10% for all ROIs except left EC (12%) and left Hip (11%). The CV (%) values for the MRI measures were >10% in all ROIs.
As shown in Figure 4, the PET MRglc measures consistently separated FAD and control subjects and resulted in large ES for all ROIs (d values, 1.1–2.2). The largest ES was observed in the PCC, reflecting the highest group separation resulting from lower interindividual variability. Significant ES for the MRI measures were restricted to the IPL volumes (left: d = 1.9, right: d = 2.0), which were comparable with the PET IPL MRglc data.
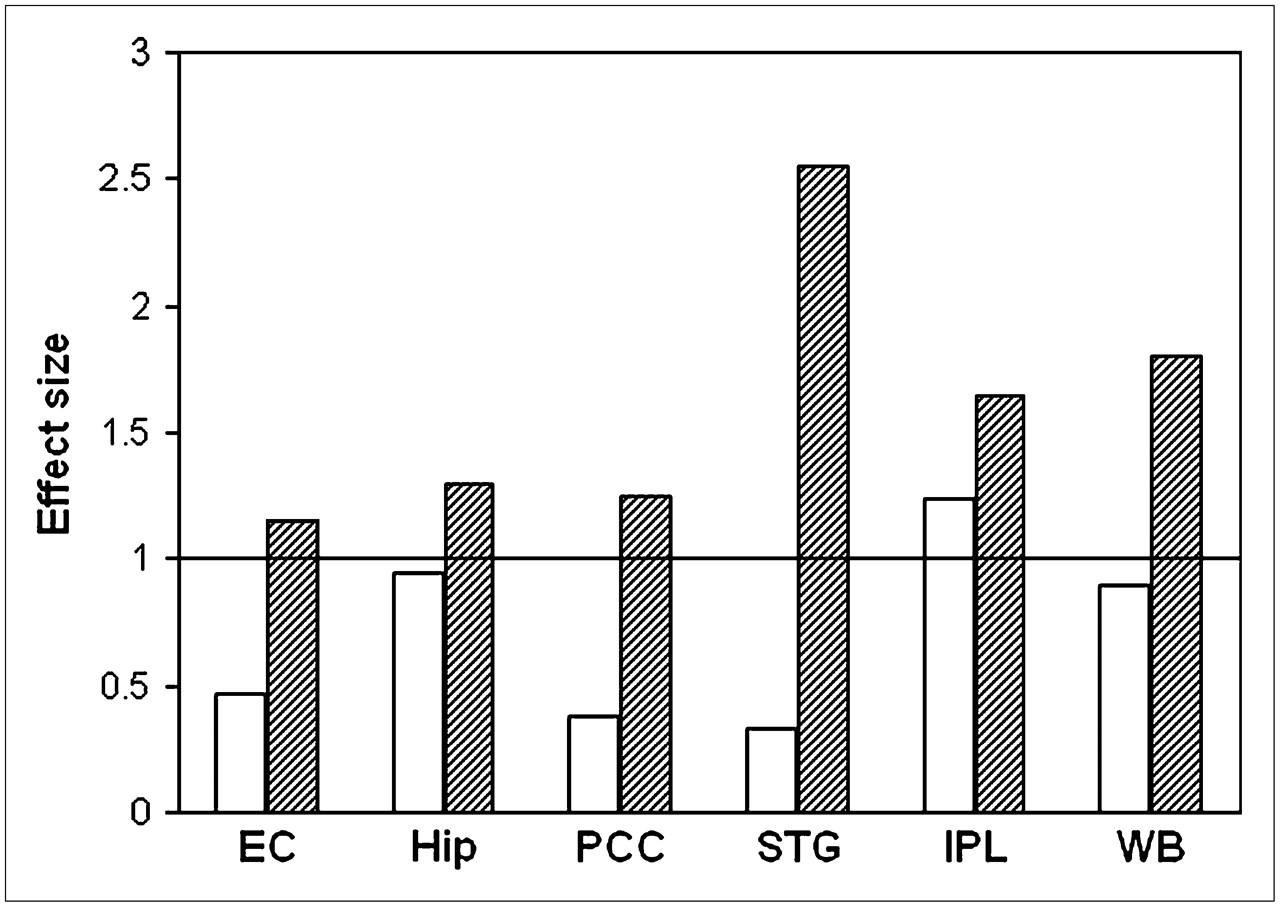
ES were examined for all ROIs, comparing MRI volumes (white) with PET MRglc measures (hatched).
MRI and 18F-FDG PET classification of sensitivity, specificity, and accuracy estimates is given in Table 3.
Diagnostic Value of MRI Volumes and 18F-FDG PET MRglc Measures in Discriminating Between FAD and Control Subjects
The MRI volume data showed substantial overlap between FAD and control subjects, with accuracies ranging from 50% (STG, P = 0.85, NS) to 57% (PCC and EC, P = 0.59, NS), except for the bilateral IPL volumes, which discriminated the clinical groups with 86% sensitivity (6/7 FAD correctly identified) and 86% specificity (6/7 controls correctly identified) (86% accuracy, χ12 = 8.20, P = 0.004).
The PET MRglc measures, mostly in the left hemisphere, proved to be sensitive group discriminators. The best group separation was achieved by the left PCC MRglc, which yielded 100% classification accuracy, reflecting no overlap between FAD and control subjects (χ12 = 19.5, P < 0.001). The other ROIs had accuracies ranging from 64% in the left STG (χ12 = 5.28, P = 0.022) to 86% in the left IPL (χ12 = 5.53, P = 0.019).
DISCUSSION
This study shows metabolic deficits on 18F-FDG PET in a group of presymptomatic individuals from early-onset FAD families carrying mutations in the PS-1 gene, which were evident in the absence of structural abnormalities on MRI and remained significant after atrophy correction. Compared with age-matched healthy control subjects, FAD individuals showed MRglc reductions in the WB and in all brain regions examined, which were more consistent in the left hemisphere. These data suggest that the global MRglc reduction usually observed in AD patients (21,22) occurs early in the course of the disease, with the regional temporoparietal, PCC, and MTL hypometabolism being present on a background of widespread global MRglc impairment. These findings are consistent with previous 18F-FDG PET reports of widespread cortical hypometabolism in FAD members of a British pedigree with mutations in the amyloid precursor protein (APP) gene or in the PS-1 gene (5,6). Parietotemporal hypometabolism was observed in all FAD subjects who also showed moderate atrophy within the same brain regions, possibly reflecting more advanced disease (5,6). Atrophy correction of the 18F-FDG PET data was not performed in these studies (5,6).
To clarify the brain changes implicated in disease onset, it is important to determine the extent to which hypometabolism measured with 18F-FDG PET is due to brain atrophy. The presence of brain atrophy artificially lowers PET measures because of the partial-volume effects of CSF, and the resulting MRglc measures reflect the combined effects of hypometabolism and atrophy. The present study shows that measures of MRglc per unit brain volume (i.e., as obtained with atrophy correction) are reduced in FAD, providing realistic evidence for tissue MRglc impairment. These data are consistent with PET studies showing a relative independence of hypometabolism from atrophy in MCI and AD patients (17,19,23).
We used a 2-segment (brain tissue vs. CSF) partial-volume correction (PVC) technique (17). This method corrects PET measures for the partial-volume effects of the CSF pool but does not take into account possible differences in 18F-FDG uptake between gray and WM regions. Alternatively, a 3-segment (gray matter vs. WM vs. CSF) PVC (32) may be used to correct for “spill-out” of activity from gray matter as well as “spill-in” of WM activity into gray matter pixels, which is the preferred choice when tracer uptake is heterogeneous depending on the brain tissue involved, such as in receptor studies. Although this method might be of value also in 18F-FDG studies, we chose to use the 2-segment PVC because our subjects showed only minimal atrophy, and the 3-segment procedure is highly susceptible to segmentation and coregistration inaccuracies—particularly in small brain structures, where the likelihood of tissue misclassification is higher.
In contrast to previous studies of FAD (3–6), our FAD subjects showed minimal, if not absent, atrophy on MRI, as underlined by the lack of ventricular enlargement compared with control subjects. At-risk FAD subjects included in previous publications were examined 1–3 y before they developed symptoms of AD (3–6), whereas our FAD subjects were examined over a broader range of 1–27 y before the anticipated age at onset. The fact that hypometabolism was found in all subjects, irrespective of age, suggests that MRglc reductions may be an early sign of future AD. It is well established that substantial hypometabolism is evident on 18F-FDG PET by the time a patient presents with symptoms of dementia (29,33). The presence of severe hypometabolism in our FAD subjects, who were clinically asymptomatic, suggests that 18F-FDG PET evaluations may support the clinical diagnosis when cognitive deficits are still minimal and difficult to interpret.
Diagnostically, we found that PCC MRglc provided complete group separation and was positively correlated with the time to the expected age of decline in the FAD group (r = 0.78, P = 0.005; Fig. 5), with those subjects closer to the expected age of AD onset having lower MRglc. Although the anticipated age of onset for a given pedigree is known, it does not predict exactly when FAD subjects will develop the clinical symptoms of AD, which may vary according to the individual compliance against advancing pathology. Nonetheless, these data show a potential for using 18F-FDG PET measures in the preclinical diagnosis of AD to identify individuals at risk for future decline based on the extent of the metabolic reductions.

Correlation between PCC MRglc and time to expected age at AD onset in FAD group (r = 0.78, P = 0.005).
The pattern of hypometabolism observed in our FAD subjects is consistent with reports on presymptomatic individual carriers of the ApoE E4 allele, a major susceptibility gene for late-onset AD. Compared with noncarriers, E4 carriers typically have reduced MRglc in the same regions as clinically affected AD patients, with the PCC showing the most prominent reductions (34,35). It has been suggested that the AD-like regional pattern of hypometabolism found in E4 carriers may explain the added genetic risk for AD. Likewise, longitudinal 18F-FDG PET studies show that excess hypometabolism in the PCC and parietotemporal regions in MCI patients predicts future decline to AD (22). In addition, the present data show MRglc reductions in the Hip and EC in presymptomatic FAD subjects. These data underline the importance of MTL evaluations with PET in the early detection of AD and are consistent with previous 18F-FDG PET and MRI studies in sporadic AD showing that excess MTL hypometabolism and atrophy are risk factors for declining from normal aging to MCI (18,36,37).
The larger ES found for PET compared with MRI measures show that 18F-FDG PET may have stronger discrimination capacity than MRI in the preclinical AD stages. The diagnostic advantage of PET MRglc over MRI volume measurements found in this study derives from the higher percentage of MRglc reductions and the smaller intersubject variability obtained with PET. As reduced MRglc reflects synaptic dysfunction, neuronal damage is also likely to be under way, yet not sufficient to result in gross atrophy detectable with MRI.
From a methodologic point of view, we chose to use manually defined MRI-guided ROIs instead of automated voxel-based analysis (VBA) techniques. Several VBA tools have been developed for analysis of brain images to provide examination of statistical effects on a voxel-by-voxel basis (38,39), enabling automated and time-saving assessment of statistical effects. Nonetheless, the MRI-guided ROI data remain the gold standard for PET sampling because of the superior anatomic precision, especially in aging and neurodegenerative diseases, where the brains undergo major structural changes (23). Our primary goal was to compare atrophy with hypometabolism within the same brain region, with the purpose of clarifying whether MRglc reductions can be detected before overt atrophy on MRI. This cannot be done with VBA, where the brain regions showing statistical effects are a posteriori and functionally, instead of anatomically, defined. Moreover, the use of preprocessing procedures (i.e., spatial normalization and smoothing) may obscure the detection of abnormalities in small brain structures such as the Hip and EC (23). On the other hand, VBA techniques have proven to be sensitive to detect subtle structural brain changes (4,36)—particularly longitudinally—and these analyses would be of interest to monitor the transition from a presymptomatic to a symptomatic stage.
Follow-up evaluations of our FAD subjects are necessary to confirm that the observed MRglc abnormalities are forerunning subsequent development of symptoms. However, the observed pattern of hypometabolism is consistent with AD, which makes it reasonable to hypothesize that the observed brain changes relate to a presymptomatic AD stage. Second, findings from FAD subjects may not reflect the natural history of the more common late-onset sporadic AD. Although there is evidence that FAD subjects present with brain pathology similar to that of sporadic AD (2), FAD patients become symptomatic at younger ages than sporadic AD (onset age, usually >70 y), suggesting that brain deterioration may be more aggressive in FAD. Lastly, FAD individuals belonged to different families and, although all expressed mutations in the PS-1 gene, they carried mutations at 3 different codons. Despite genotypic variability, all FAD subjects shared the same pattern of metabolic abnormalities on 18F-FDG PET in the relative absence of structural damage on MRI, revealing a relatively homogeneous brain profile.
CONCLUSION
Presymptomatic FAD individuals show widespread MRglc reductions consistent with the expected AD PET pattern in the absence of severe atrophy on MRI. These results further suggest that PET MRglc measures have a potential as preclinical biomarkers for dementia and for tracking disease progression.
Acknowledgments
This work was supported by National Institutes of Health, National Institute on Aging grants AG12101, AG13613, AG08051, and AG022374 and National Cancer for Research Resources grant MO1RR0096. The authors have reported no conflicts of interest.
References
- Received for publication May 3, 2006.
- Accepted for publication July 28, 2006.


Jump to section
Related Articles
Cited By...
- PTP1B inhibition promotes microglial phagocytosis in Alzheimers disease models by enhancing SYK signaling
- Donor-Specific Transcriptomic Analysis of Alzheimer's Disease-Associated Hypometabolism Highlights a Unique Donor, Ribosomal Proteins and Microglia
- 18F-FDG-PET Hyperactivity in Alzheimers Disease Cerebellum and Primary Olfactory Cortex
- Plasma metabolomics of presymptomatic PSEN1-H163Y mutation carriers: A pilot study
- Donor specific transcriptomic analysis of Alzheimers disease associated hypometabolism highlights a unique donor, microglia, and ribosomal proteins
- Aerobic Glycolysis in the Frontal Cortex Correlates with Memory Performance in Wild-Type Mice But Not the APP/PS1 Mouse Model of Cerebral Amyloidosis
- Cerebral perfusion alterations and cerebral amyloid in autosomal dominant Alzheimer disease
- Regional Neuronal Network Failure and Cognition in Late-Onset Sporadic Alzheimer Disease
- Altered Spontaneous Brain Activity in Type 2 Diabetes: A Resting-State Functional MRI Study
- Whither the Hippocampus? FDG-PET Hippocampal Hypometabolism in Alzheimer Disease Revisited
- Neurovascular Dysfunction and Faulty Amyloid {beta}-Peptide Clearance in Alzheimer Disease
- Progressive regional atrophy in normal adults with a maternal history of Alzheimer disease
- Age-Related Metabolic Profiles in Cognitively Healthy Elders: Results from a Voxel-Based [18F]Fluorodeoxyglucose-Positron-Emission Tomography Study with Partial Volume Effects Correction
- Combining MR Imaging, Positron-Emission Tomography, and CSF Biomarkers in the Diagnosis and Prognosis of Alzheimer Disease
- Reduced gray matter volume in normal adults with a maternal family history of Alzheimer disease
- Declining brain glucose metabolism in normal individuals with a maternal history of Alzheimer disease
- Longitudinal multimodal imaging in mild to moderate Alzheimer disease: a pilot study with memantine
- Altered fMRI activation during mental rotation in those at genetic risk for Alzheimer disease
- Multicenter Standardized 18F-FDG PET Diagnosis of Mild Cognitive Impairment, Alzheimer's Disease, and Other Dementias
- Comparison of 18F-FDG PET and Optimized Voxel-Based Morphometry for Detection of Alzheimer's Disease: Aging Effect on Diagnostic Performance
- Maternal family history of Alzheimer's disease predisposes to reduced brain glucose metabolism
- 18F-FDG PET Database of Longitudinally Confirmed Healthy Elderly Individuals Improves Detection of Mild Cognitive Impairment and Alzheimer's Disease