


Abstract
The normative reference sample is crucial for the diagnosis of Alzheimer's disease (AD) with automated 18F-FDG PET analysis. We tested whether an 18F-FDG PET database of longitudinally confirmed healthy elderly individuals (“normals,” or NLs) would improve diagnosis of AD and mild cognitive impairment (MCI). Methods: Two 18F-FDG PET databases of 55 NLs with 4-y clinical follow-up examinations were created: one of NLs who remained NL, and the other including a fraction of NLs who declined to MCI at follow-up. Each 18F-FDG PET scan of 19 NLs, 37 MCI patients, and 33 AD patients was z scored using automated voxel-based comparison to both databases and examined for AD-related abnormalities. Results: Our database of longitudinally confirmed NLs yielded 1.4- to 2-fold higher z scores than did the mixed database in detecting 18F-FDG PET abnormalities in both the MCI and the AD groups. 18F-FDG PET diagnosis using the longitudinal NL database identified 100% NLs, 100% MCI patients, and 100% AD patients, which was significantly more accurate for MCI patients than with the mixed database (100% NLs, 68% MCI patients, and 94% AD patients identified). Conclusion: Our longitudinally confirmed NL database constitutes reliable 18F-FDG PET normative values for MCI and AD.
Measurement of the cerebral metabolic rate of glucose (CMRglc) with 18F-FDG PET is being increasingly used to support the clinical diagnosis of Alzheimer's disease (AD). Compared with age-matched healthy elderly individuals (“normals,” or NLs), AD patients present with characteristic regional CMRglc reductions in the posterior cingulate and parietotemporal cortices (1). Patients with mild cognitive impairment (MCI) at high risk for developing AD (2) also show a similar pattern of hypometabolism, although the magnitude and extent of CMRglc reductions are milder than in AD (3,4).
Precise detection of hypometabolism in AD and MCI patients may contribute to the clinical diagnosis, particularly in the early stages of AD, when clinical symptoms are not fully expressed. Automated methods of diagnostic image analysis have been developed to facilitate 18F-FDG PET evaluations of single patient's scans with respect to a normative database by producing an observer-independent quantitative mapping of regional CMRglc abnormalities (5–7). Whether regional CMRglc is considered abnormal is therefore directly related to the choice of the appropriate normative reference sample.
Evidence shows that progressive CMRglc reductions and atrophy in AD-affected brain regions are present in elderly individuals years before a decline to MCI or AD occurs (8–12). On 18F-FDG PET, such CMRglc reductions significantly involve the association cortices that are typically inspected to diagnose AD (8,9,12). These results raise concerns about the definition of “normality” and suggest that a database comprising baseline NLs of unknown clinical outcome might include 18F-FDG PET scans with preclinical CMRglc alterations. Such a baseline database would increase variance and decrease the sensitivity for detecting CMRglc abnormalities in clinical patients at mild stages of disease. To our knowledge, none of the currently available 18F-FDG PET databases were created to include subjects who were known to have remained healthy over time.
The present study showed that using a reference 18F-FDG PET database of longitudinally confirmed NLs improves the accuracy in diagnosing mild AD and MCI.
MATERIALS AND METHODS
Subjects
This study included 96 NLs, 37 MCI patients, and 33 AD patients examined at New York University and at the University of Florence. Both centers administer several identical neuropsychological tests; use comparable criteria for the definition of normality, MCI, and AD; follow the recommendations of the National Institute of Neurological and Communicable Disease and Stroke–Alzheimer's Disease and Related Disorders Association (NINCDS-ADRDA) workgroup and the Diagnostic and Statistical Manual of Mental Disorders (DSM)–IV criteria for the diagnosis of AD; and use common standardized imaging acquisition protocols, as previously described (13).
All participants or caregivers provided written informed consent, and the subjects were studied with the approval of the Institutional Review Board. The subjects underwent clinical, medical, neuropsychological, and CT or MRI examinations and routine blood analysis; were 50–83 y old; had no evidence of stroke, clinically uncontrolled diabetes, major head trauma, or depression; and used no cognitively active medications. NLs had no evidence of functional impairment based on extensive clinical interviews, a Clinical Dementia Rating of 0 (14) or Global Deterioration Scale of 1 or 2 (15), and a Mini-Mental State Examination (MMSE) score of at least 28. AD patients fulfilled NINCDS-ADRDA and DSM-IV criteria for probable AD, had significant deficits in activities of daily living, deficits in 2 or more cognitive domains, and a Clinical Dementia Rating of at least 1. AD was classified as mild (Clinical Dementia Rating of 1, n = 15) or as moderate to severe (Clinical Dementia Rating of at least 2, n = 18). Amnesic MCI patients had normal activities of daily living and general intelligence, no dementia, a Clinical Dementia Rating of 0.5 or Global Deterioration Scale of 3, an MMSE score of at least 24, and memory scores 1.5 SDs below norms (2). The neuropsychological testing battery included the MMSE, immediate and delayed recall of a paragraph and paired associates, the designs test, the object-naming test, and the Wechsler Adult Intelligence Scale–Revised (12,13). For all these tests, normative reference values exist (16).
Database Development
Seventy-seven NLs received clinical follow-up examinations and were examined for a change in clinical status after 4 ± 1 y. At the follow-up, 2 groups were identified: 55 NLs that remained NL (NL-NLs), and 22 NLs that declined to MCI (NL-MCI patients). These subjects were reported on previously (8,12) and were now used to develop two 18F-FDG PET normative databases of 55 subjects each: DB+ (a database of baseline scans of only NL-NLs) and DB− (a database of baseline scans of an epidemiologically likely fraction of NL-MCI patients, in keeping with an estimated rate of decline from NL to MCI or AD of ∼10%/y (8–12)). With an aggregate 4-y risk of 10%, DB− comprised 22 (40% of 55) NL-MCI patients and 33 randomly selected NL-NLs. DB+ comprised the 55 NL-NLs. Subjects in both databases had demographic characteristics appropriate for studies on AD (Table 1). The 18F-FDG PET scans of the remaining 19 NLs, 37 MCI patients, and 33 AD patients were used to examine the accuracy of the 2 databases in detecting disease.
Clinical Characteristics of Participants
18F-FDG PET Acquisition
All subjects underwent 18F-FDG PET using standardized procedures within 3 mo of the clinical examinations. The studies were performed in a dimly lit room with minimal background noise after an intravenous injection of 140–370 MBq of 18F-FDG. Scanning began 40 min after injection and continued for 20 min. Images were reconstructed using filtered backprojection, including correction for attenuation and scatter, using standard software as supplied by scanner manufacturers. PET scans at New York University were acquired on a ECAT 931 scanner (Siemens; 6.2-mm in-plane full width at half maximum; 6.75-mm interslice distance). Two 15-slice acquisitions translated by a half-slice thickness (∼3.4 mm) were interleaved for a final slice thickness of 4.25 mm. PET scans at the University of Florence were acquired on an Advance scanner (GE Healthcare; 4.6-mm in-plane full width at half maximum; 4.25-mm slice thickness).
18F-FDG PET Image Analysis
18F-FDG PET scans were processed using Neurologic Statistical Image Analysis software (Neurostat; Washington University) (3,5). Each image was warped to the common stereotactic coordinate system, and the 2 databases were created using the spatially normalized 18F-FDG PET scans of 55 longitudinally confirmed NL-NLs (DB+) and 22 NL-MCI patients and 33 NL-NLs (DB−). Each spatially normalized scan of the remaining NLs, MCI patients, and AD patients was compared with both DB+ and DB− after adjusting for global CMRglc at P ≤ 0.05 (1-sided), corresponding to z ≥ 1.64. z scores (z = xsubject − meandatabase)/SDdatabase) are reported in absolute values. Gray-matter activities were extracted to predefined surface pixels using a 3-dimensional stereotactic surface projection technique (3D-SSP), which minimized residual anatomic variances across subjects and partial-volume effects, yielding robust voxel-based statistical analysis (3,5).
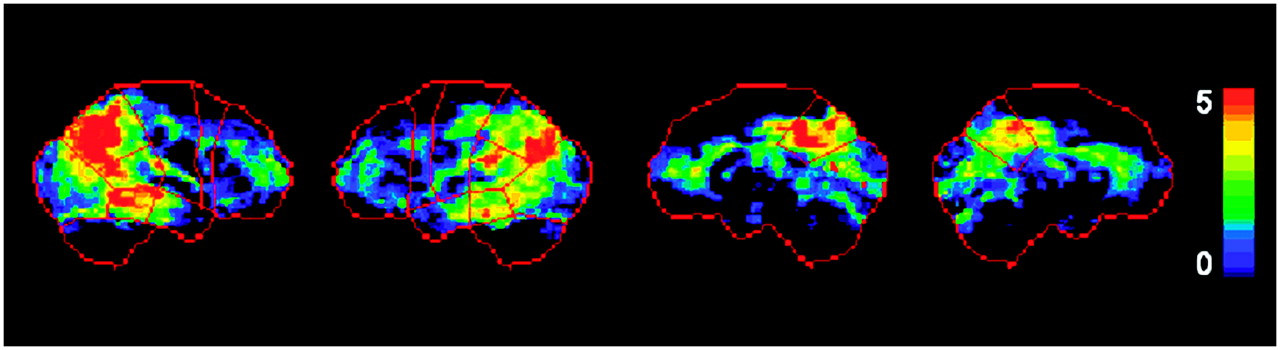
Bilateral standardized regions of interest (ROIs) (inferior parietal lobe, lateral temporal lobe, posterior cingulate cortex, prefrontal cortex, occipital cortex, and sensorimotor cortex; Fig. 1) were applied to 3D-SSP maps to extract mean ROI z scores and generate regional numeric indices representing the degree of CMRglc abnormalities (4). All 3D-SSP maps were inspected by 2 raters and classified as positive or negative for CMRglc abnormalities consistent with AD based on detection of hypometabolism in the posterior cingulate, parietotemporal, or frontal cortex, with sparing of the sensorimotor cortex, occipital cortex, and cerebellum (1,3,4), using published protocols with known intra- and interrater reliabilities (1,13,17). The final diagnosis was made by joint agreement. Classification was facilitated by detection of hypometabolic patterns exceeding the predefined z score threshold within each ROI superimposed on the 3D-SSP maps (Fig. 1) (4).

Standardized ROIs. Predefined anatomic surface ROIs (in red) are superimposed onto (from left to right) right and left lateral and right and left medial views of standardized brain template showing surface projection maps of statistical abnormalities in AD patients as compared with NLs. z scores are represented on color-coded scale ranging from 0 (black) to 5 (red). Typical AD-related CMRglc reductions in parietotemporal and posterior cingulate cortices are evident in ROIs.
Statistical Analysis
The general linear model with post hoc t tests and χ2 tests was used to examine clinical and ROI z score measures between groups and databases. The effects of the 2 databases in distinguishing AD and MCI groups from NLs were compared. Receiver operator characteristic curves and logistic regressions were used to examine z scores and the resulting 18F-FDG PET diagnosis from the 2 databases in distinguishing AD and MCI patients from NLs. The results were examined at P < 0.05. Analyses were done using SPSS, version 12.0 (SPSS Inc.).
RESULTS
The groups did not differ in age or sex (Table 1). Education was lower in the MCI and AD patients than in any NL groups (P < 0.05). MMSE scores were lower in AD patients than in NLs and MCI patients. MMSE scores were lower in patients with moderate-to-severe AD than in patients with mild AD (P ≤ 0.01).
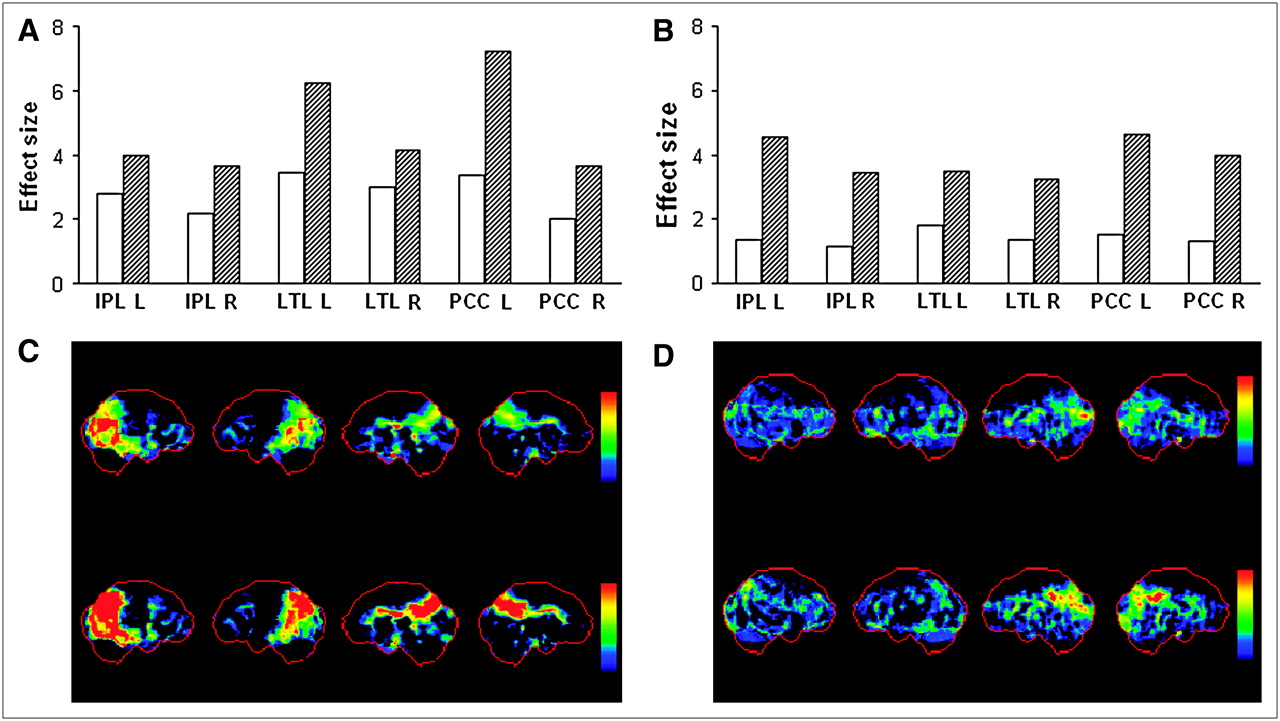
Significant differences between the 2 databases were found in detecting hypometabolism in MCI and AD patients (Table 2). z scores were generally higher (reflecting greater CMRglc reductions) for DB+ than for DB−, reaching statistical significance in both inferior parietal lobes, the posterior cingulate cortex, and the right lateral temporal lobe in MCI patients and in both inferior parietal lobes, the lateral temporal lobe, and the posterior cingulate cortex in AD patients (P ≤ 0.05; Table 2). z scores were significantly higher for DB+ than DB− for both the mild and the moderate-to-severe AD groups (Table 2). The effect in distinguishing disease from lack of disease was larger for DB+ than for DB− in all ROIs (Fig. 2).

Database effects on 18F-FDG PET diagnostic accuracy. (A and B) Effects in AD-affected brain regions discriminating AD patients (A) and MCI patients (B) from NLs using DB− (white bars) and DB+ (hatched bars). (C and D) Effects of using DB− (top row) and DB+ (bottom row) to create 3D-SSP maps are depicted in 2 representative AD (C) and MCI (D) patients. 3D-SSP maps showing CMRglc reductions in AD and MCI patients are displayed on same color-coded z score scale. IPL = inferior parietal lobe; L = left hemisphere; LTL = lateral temporal lobe; PCC = posterior cingulate cortex; R = right hemisphere.
z Scores in Clinical Groups by Reference Database
Within these ROIs, DB+ z scores yielded significantly higher group discrimination accuracies than did DB− z scores (P < 0.05). For NL versus MCI, DB+ z scores yielded accuracies of 91% (right) and 99% (left) for the inferior parietal lobe and 99% (right) and 100% (left) for the posterior cingulate cortex, whereas DB− z scores had accuracies of 78% (right) and 89% (left) for the inferior parietal lobe and 78% (right) and 92% (left) for the posterior cingulate cortex. Although DB+ z scores for the right lateral temporal lobe were higher than DB− z scores, the diagnostic accuracy of the lateral temporal lobe z scores was comparable between databases, at 95%. For NLs versus patients with mild AD, DB+ z scores yielded accuracies of 92% (right) and 99% (left) for the inferior parietal lobe, 98% (right) and 100% (left) for the posterior cingulate cortex, and 95% for both the left and the right lateral temporal lobes, whereas DB− z scores had accuracies of 82% (right) and 87% (left) for the inferior parietal lobe, 78% (right) and 92% (left) for the posterior cingulate cortex, and 90% (right) and 95% (left) for the lateral temporal lobe (P < 0.05). For NLs versus patients with moderate to severe AD, DB+ z scores were more accurate than DB− z scores in only the right hemisphere for the inferior parietal lobe (DB+, 91%; DB−, 84%), the posterior cingulate cortex (DB+, 100%; DB−, 87%), and the lateral temporal lobe (DB+, 98%; DB−, 92%) (P < 0.05).
18F-FDG PET diagnosis identified all 19 NLs (100%) as negative for disease with both databases. Using DB−, a positive PET diagnosis was made in 31 (94%) of 33 AD patients and 25 (68%) of 37 MCI patients (Fig. 3). A negative PET diagnosis was more frequent in MCI patients than in AD patients ( ; P = 0.006). A positive PET diagnosis distinguished AD patients from NLs with 94% sensitivity and 100% specificity (96% accuracy,
  ; P < 0.001) and MCI patients from NLs with 68% sensitivity and 100% specificity (79% accuracy,
  ; P < 0.001). PET accuracy was independent of dementia severity, because 14 (93%) of 15 patients with mild AD and 17 (94%) of 18 patients with moderate to severe AD were correctly identified (
 ; P = 0.89, not statistically significant).

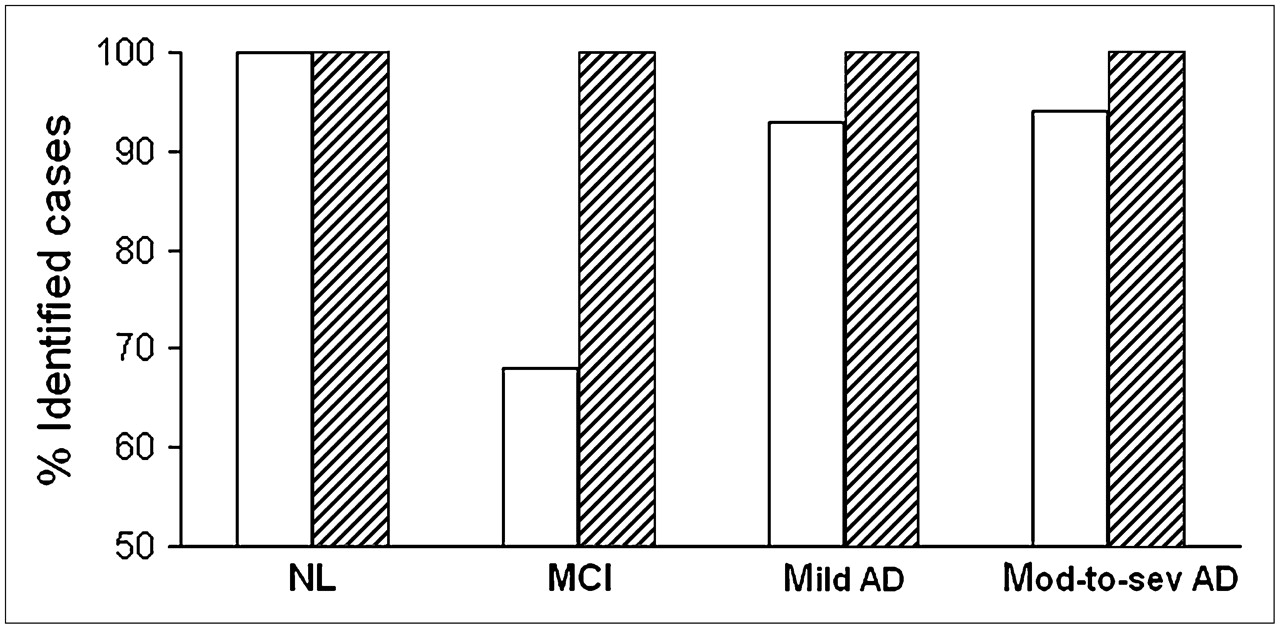
18F-FDG PET diagnostic accuracy. Percentage of NLs (n = 19), MCI patients (n = 37), patients with mild AD (n = 15), and patients with moderate to severe (mod-to-sev) AD (n = 18) correctly identified using DB− (white bars) and DB+ (hatched bars).
Using DB+, all AD and MCI patients received a positive PET diagnosis, and both groups were distinguished from NLs with 100% accuracy (Fig. 3), which was significantly higher than with DB− ( ; P = 0.001). Using DB+ resulted in classification of more regions as hypometabolic than when DB− was used. Specifically, the posterior cingulate cortex appeared consistently hypometabolic in all MCI and AD subjects, and the parietotemporal CMRglc reductions were more extended and easily identifiable in patients with mild AD (Fig. 2).
DISCUSSION
The clinical utility of 18F-FDG PET for the assessment of AD depends on selection of adequate reference subjects to determine with confidence whether regional CMRglc is abnormal on a single-patient basis, particularly in the early stages of disease. The present study demonstrated that the diagnostic accuracy of automated 18F-FDG PET examinations in AD and MCI patients can be improved by using a reference database derived from longitudinally confirmed NLs.
Using our PET database of longitudinally stable NLs reduced the number of false-negatives without increasing the number of false-positives in diagnosing MCI and AD, as compared with a mixed database including an epidemiologically likely percentage of future MCI patients. The diagnostic sensitivity achieved with our longitudinal database was 100% for AD and MCI, whereas that of the mixed database was 94% for AD and 68% for MCI, indicating that normative values from longitudinally confirmed NLs might be particularly useful in early AD. This effect resulted from 1.4- to 2-fold increased z scores within AD-vulnerable regions, such as the posterior cingulate and parietotemporal cortices, as compared with those derived from the mixed database.
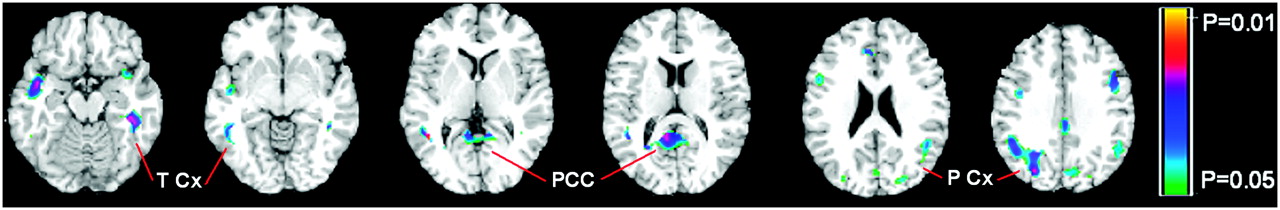
To clarify the origin of such effects, we compared the baseline 18F-FDG PET scans of the 22 NL-MCI patients with 22 age-matched NL-NLs. This analysis showed CMRglc reductions in the posterior cingulate cortex and parietotemporal regions in the declining NLs, as compared with the nondeclining NLs (Fig. 4). However, these CMRglc reductions were subtle and could be detected only at an exploratory probability threshold of 0.05 ≤ P < 0.01, uncorrected for multiple comparisons (Fig. 4).

Comparison between NL-MCI patients and NL-NLs. Brain regions showing baseline CMRglc reductions in 22 NL-MCI patients and 22 age-matched NL-NLs are displayed on standardized T1-weighted MRI template in axial view (from left to right: z = 29 to z = 64 mm, every 5 mm, relative to anterior commissure–posterior commissure line). Voxelwise group comparison of spatially normalized 18F-FDG PET scans was performed with t test for independent samples accounting for global CMRglc (3,5). CMRglc reductions in NL-MCI patients compared with NL-NLs were evident mainly in temporal, posterior cingulate, and parietal cortices. Color scale indicate P values corresponding to significance of CMRglc reductions, ranging from P = 0.05 to P = 0.01, uncorrected for multiple comparisons. PCC = posterior cingulate cortex; P Cx = parietal cortex; T Cx = temporal cortex.
The accuracy in distinguishing MCI patients from NLs using ROI z scores was higher than the 68% accuracy of visual inspection, reaching a high of 95% for the lateral temporal lobe. This effect was likely due to the use of continuous z score variables, and thus flexible cutoff levels, as compared with routine diagnostic procedures that necessarily result in categoric variables (normal or abnormal). The present data suggest that probabilistic estimates may be a useful complement to standard diagnostic procedures.
The MCI group in our study fulfilled the criteria for amnesic MCI. Patients with amnesic MCI are a diagnostic group at elevated risk for progressing to AD (2) and typically present with an AD-like PET pattern, although the hypometabolism is milder than in AD (4,18). These MCI patients were accurately distinguished from NLs using automated 18F-FDG PET examinations with the NL-NL database. It remains to be established whether this procedure would improve diagnosis of other MCI subtypes.
The mixed database was created so as to include 40% of future decliners to MCI over 4 y, according to an estimated decline rate of 10%/y (8–12). These estimates are derived from typical research settings, which may include enriched samples at high risk for decline. Nonetheless, databases for image analysis are typically developed in such research settings, and our study underlines the importance of carefully selecting representative NLs to create such databases.
In the present study, the PET images of NLs used in both databases were acquired on the same scanner at New York University, and the scans of the testing group were acquired on a different scanner at the University of Florence. Therefore, differences in scanner resolution would have affected the detection of CMRglc abnormalities in a similar fashion in NLs, MCI patients, and AD patients from the testing group, without affecting comparison of data between databases. Previous studies have shown that multicenter 18F-FDG PET discrimination of AD patients from NLs is reliable using automated procedures such as in our study (i.e., spatial normalization, image rescaling to a common voxel size, and restriction of analysis to gray-matter voxels) (19). Examination of data from different scanners is nonetheless necessary before we make our database available to other PET centers.
There is evidence that hippocampal CMRglc adds to the cortical regions in distinguishing NLs, MCI patients, AD patients (17,20), and patients with preclinical AD (8,12). Currently, Neurostat does not provide for direct examination of the hippocampus. Automated procedures to examine hippocampal CMRglc exist (20), and studies are needed to assess whether the combination of the 2 methodologies would further improve diagnostic accuracy.
CONCLUSION
Our database of longitudinally confirmed NLs constitutes a reliable 18F-FDG PET normative reference for detecting MCI and early AD, by combining qualitative with quantitative estimation of CMRglc abnormalities. These results indicate a potential direct clinical value for the procedure as a diagnostic tool to facilitate clinical decision making in early AD.
Acknowledgments
This study was supported by NIH-NIA AG12101, AG13616, AG08051, and AG022374; NIH NCRR MO1RR0096; and the Alzheimer's Association.
Footnotes
-
COPYRIGHT © 2007 by the Society of Nuclear Medicine, Inc.
References
- Received for publication February 13, 2007.
- Accepted for publication April 5, 2007.


Jump to section
Related Articles
Cited By...
- Modeling the Effects of Age and Sex on Normal Pediatric Brain Metabolism Using 18F-FDG PET/CT
- Effectiveness and Safety of 18F-FDG PET in the Evaluation of Dementia: A Review of the Recent Literature
- Molecular imaging in the diagnosis of Alzheimer's disease: visual assessment of [11C]PIB and [18F]FDDNP PET images
- Declining brain glucose metabolism in normal individuals with a maternal history of Alzheimer disease
- Multicenter Standardized 18F-FDG PET Diagnosis of Mild Cognitive Impairment, Alzheimer's Disease, and Other Dementias