


Abstract
In myocardial perfusion SPECT (MPS), ischemia is typically quantified as the difference between stress and rest defect sizes obtained by separate comparisons with stress and rest normal limits. Such an approach is not optimal because images are not compared directly with each other and a complex set of stress and rest normal limits is required. Methods: We developed a fully automatic technique to quantify stress–rest change. We applied it to 204 patients whose SPECT images were acquired using a same-day dual-isotope 99mTc/201Tl protocol and on whom coronary angiography had been performed. A 10-parameter registration of rest and stress images was performed by an iterative search of best translational, rotational, scaling, and optimal stress–rest count normalization parameters. Identical stress–rest 3-dimensional left ventricle (LV) contours were automatically derived from stress images. Integrated deficit counts (normalized rest–stress) within the LV volume were derived from registered image pairs. A global measure of ischemia (ISCH) was calculated as the ratio of the total deficit stress LV counts to the total rest LV counts. Results: Registration and derivation of quantitative measures were fully automatic. The average processing time was <40 s on a 2-GHz processor. When compared for prediction of stenosis, the area under the receiver operating characteristic curve (0.88 ± 0.03) was significantly better for ISCH than that obtained by existing quantitative approaches, which use reference databases (0.80–0.82 ± 0.03). The normalized stress–rest change could be visualized and localized directly on raw patient images using overlay display. Conclusion: Automatic stress–rest MPS image registration allows a direct estimation of ischemia from SPECT that does not require comparisons with normal limits.
Myocardial perfusion SPECT (MPS) is typically performed at stress and rest in the assessment of ischemia. In current MPS analysis protocols, separate comparisons with reference stress and rest databases have been used to estimate ischemia without using direct alignment of stress and rest images (1,2). In typical quantification protocols, the stress and rest data are fitted separately to a geometric polar map model. Subsequently, polar map samples of stress and rest patient data are compared with the respective normal-limit polar map samples. In addition to pixel-based quantitative measurements, a semiquantitative visual segmental scoring system is used to assess the extent and severity of ischemia by the summed difference score (SDS), derived as the difference between summed stress score (SSS) and summed rest score (SRS) (3). One limitation of these current quantitative or semiquantitative approaches is that the unique shape of each individual heart is lost in that process, even though this shape is similar for the rest and stress scans of a given patient. Furthermore, differences in orientation and position between stress and rest images can occur since no direct alignment is performed. Such misalignment can further confound the assessment of ischemia when analyzed by separate comparisons with stress and rest normal limits. Even when stress and rest scans are perfectly aligned, the normal limits are based on inter-patient comparisons; therefore, these do not truly represent the significant intra-patient changes. Thus, using a standard database approach, a change on stress might not be significant in comparison with the stress scans of a healthy population, but there still may be a detectable stress–rest count change for a given patient.
In addition, separate stress and rest count normalization factors are estimated for paired scans when these scans are compared with their respective stress and rest databases; incorrect estimation of one of these normalization factors is a potential source of an erroneous estimate of ischemia. Significant errors in standard normalization techniques have recently been reported (4).
To simplify and optimize the estimate of ischemia derived from paired stress–rest scans, we propose a novel computer technique based on image coregistration of rest and stress images and voxel-by-voxel estimation of differences without using reference databases. In this article, we describe the software implementation and compare the results of our new method with standard quantification techniques and with semiquantitative visual analysis. In these comparisons, we use coronary angiography as the reference standard.
MATERIALS AND METHODS
Patient Population
The study population consisted of 204 patients who had rest 201Tl/exercise or adenosine stress 99mTc-sestamibi gated MPS between January 1999 and June 2002. Table 1 describes the patient characteristics.
Characteristics, Nuclear Variables, and Angiographic Data for 204 Patients
Inclusion criteria included coronary angiography within 3 mo of MPS, availability of both supine and prone acquisitions (the latter used only for visual analysis) (5), and acceptable technical quality of the MPS. Acceptable technical quality was defined as absence of moderate or greater patient motion on projection images and no adjacent hot spots on filtered backprojection images that might have affected contouring of the left ventricle (LV). The total number of excluded patients due to inadequate technical quality was 90.
Clinical exclusion criteria were prior myocardial infarction, prior coronary revascularization, nonischemic cardiomyopathy, or valvular heart disease.
Acquisition Protocols
MPS was performed as previously described, with a circular or ellipsoidal 180° acquisition for 64 projections at 25 s/projection for 99mTc or 35 s/projection for 201Tl (6). All images were subject to quality control measures. No attenuation or scatter correction was used. After filtered backprojection reconstruction, the short-axis tomograms were generated through automated reorientation (7).
Two scans were obtained for each patient: a rest 201Tl scan and a stress 99mTc scan. Patients were requested to have discontinued and be free of the effects of nitrates, calcium blockers, and β-blockers at the time of MPS. A dose of 201Tl (111–166 MBq) was injected intravenously at rest, and the MPS acquisition was started 10 min later (6). Stress scans were acquired with exercise or pharmacologic stress (adenosine) after rest 201Tl imaging.
Patients undergoing the exercise-protocol scan underwent a symptom-limited exercise treadmill test with the standard Bruce protocol. At near-maximal exercise, 99mTc-sestamibi (925–1,480 MBq) was injected intravenously. Exercise was continued at maximal workload for 1 min and at 1 stage lower for 2 additional minutes when possible. The 99mTc-sestamibi SPECT acquisition was started 15–30 min after radiopharmaceutical injection.
In patients for whom exercise was not suitable, adenosine MPS was performed as previously described (8). All patients were instructed not to consume caffeine-containing products for 24 h before testing. Adenosine was infused at 140 μg/kg/min for 5–6 min. At the end of the second or third minute of infusion (of the 5- and 6-min protocols, respectively), 99mTc-sestamibi (925–1,480 MBq) was injected and the MPS acquisition was started approximately 60 min later.
Coronary Angiography
Coronary angiography was performed with the standard Judkins approach, and all coronary angiograms were interpreted visually by 2 experienced physicians who were unaware of the MPS results. No patients had cardiac events in the interval between dual-isotope SPECT and coronary angiography. Two arbitrary cutoff points were used for the definition of coronary artery disease: ≥50% and ≥70% narrowing of maximal lumen diameter.
Visual Scoring
Semiquantitative visual interpretation of MPS images used short-axis and vertical long-axis tomograms divided into 20 segments for each patient (9). Each segment was scored by a consensus of 2 expert observers using a 5-point scoring system (0 = normal and 4 = absence of radioisotope uptake). Three global perfusion indices previously defined by our group were used to combine assessments of defect extent and severity (10). By addition of the 20 segment scores, SSS and SRS were calculated. The sum of the differences between the SSS and SRS was defined as the SDS to assess defect reversibility.
Standard Quantification
The scores were derived automatically by the software as described in a previous publication (1). Briefly, LV extraction and fitting to the ellipsoidal model was performed to derive polar map representation. Perfusion information was extracted as the average count profiles normal to the ellipsoidal surface. Normal limits from the low-likelihood patient data and the criteria for abnormality were as described previously (9,10). The quantitative stress extent of the defect was defined as the global percentage of abnormal pixels in the polar map. Quantitative (computer-derived) summed stress score (QSSS), quantitative summed rest score (QSRS), and quantitative summed difference score (QSDS) were obtained by software automatically as previously described (1). These parameters were derived using batch mode processing without human intervention.
Quantification of Change
All patient data were analyzed separately using the new ischemia quantification method. The software has been implemented in C++ language on a Windows (Microsoft) platform. Processing was performed in batch mode without human intervention, similar to standard quantification processing.
Initial Data Processing.
To improve the results of the registration, Quantitative Gated SPECT (Cedars-Sinai Medical Center) contours (11) derived from the short-axis stress images were used to mask the original images with an additional 3-dimensional margin around the contours. The margins were applied so both right ventricle and LV as well as the counts adjacent to the contours could be considered by the image registration. The margin was set to 2 pixels or 1.2 cm (6-mm pixel size) and was increased to 5 pixels (3 cm) around the base and in the direction of the right ventricle to avoid errors in base definition and to include the right ventricular counts in the image registration.
Registration Algorithm.
The image registration algorithm is based on minimization of the sum of absolute differences between the masked stress and rest images. Rest images were considered as “floating images” and were iteratively reoriented, resized, and normalized to provide the best fit with the stress scans. We used a downhill simplex algorithm for the search of such an optimal solution (12), similar to our previous work in fitting cardiac images to the templates (13,14). To allow adjustment for transient ischemic dilation (15), which can occur during stress scanning, we used 3 independent scaling parameters in addition to the rotational and translational rigid body parameters. Convergence is established if the cost function decreased below a predefined threshold (0.1%) for each simplex iteration.
The registration algorithm was designed to incorporate an optimized normalization factor and used a novel 2-pass method to avoid the influence of perfusion defects on the registration results. Because stress and rest images are acquired with different doses at different times and with different isotopes, a count normalization factor between these images needed to be established. We therefore included the count normalization factor as an additional search parameter, based on a modification of a previously proposed approach for sum-of-absolute-differences (SAD) registration of PET images (16). In contrast to that previous method, we used an additional 3 independent scaling factors in the image registration process to allow anisotropic changes in the ventricular size.
In cardiac SPECT, however, we may expect stress and rest images to show large differences, which could cause overestimation of the normalization factor. To avoid such overcompensation by the registration algorithm seeking to minimize image differences, we adopted the following strategy. We designed our SAD function to be asymmetric, with separate weighting factors for positive and negative stress–rest differences (ratio, 2:1). In addition, we performed a 2-pass registration. In the first pass, we calculated the 80th percentile of the maximum in the patient image and subsequently multiplied all the counts in the image by the ratio of the 80th percentile to the arbitrary count level of 1,000. The percentile method instead of the maximum was suggested to eliminate errors due to maxima located in small hot spots (1). Subsequently, image registration was performed without searching for the normalization factor but only adjusting translational, scaling, and orientation parameters. The initial search range for these parameters was set to 10 pixels for translations, 10% for scaling, and 20° for rotations. Subsequently, we used the normalization factor based on the percentile of the maximum as the initial normalization factor in the second-pass iterative search. We also used the translation, scaling, and orientation parameters found in the first pass as a starting estimate for the second pass of the registration, during which we reduced the search range (half of the initial search range) and excluded regions highly likely to be abnormal (uptake below 60% of the maximum threshold on stress images) from the calculation of the cost function. This approximate assessment of the abnormalities did not need to be accurate, since it was used only to eliminate certain parts of the image during the second pass of the registration algorithm. In the second pass, the normalization factor was included in search parameters in addition to 9 spatial transform parameters. The range for the search of the normalization factor was set to 50% of the value found in the first pass. Thus, a full 10-parameter search was performed.
Because this is a new method for the derivation of the normalization factor in MPS quantification, we also implemented the standard method of normalization (80th percentile of the maximum) and evaluated the results using both approaches.
Ischemia Quantification.
After image registration and normalization, the stress–rest count difference was derived from the voxels contained within only the stress contour volume, since rest scans were spatially aligned to stress scans. Sestamibi images were chosen for contour definition, since performance for the contour definition is well validated for this isotope even in the presence of the significant defects. The quality of rest 201Tl images is worse than that of 99mTc-sestamibi because of lower resolution, lower counts, higher attenuation, and possible increased abdominal activity. In addition, 201Tl contours would be too thick for the sestamibi images, because of apparent lower resolution. In addition, the important aspect of the image quantification is that the same contours are used for stress and rest, reducing possible differences in the definition of the valve plane.
The integrated count differences were then divided by the total rest counts, resulting in a relative count change measure, which we defined as the measure of ischemia (ISCH). Because such a measure may integrate both noise and significant changes, we evaluated the effect of the threshold for the differences in individual voxels, above which the differences would be included in the global “change measure.” We calculated ISCH for various minimum change thresholds and derived corresponding receiver operating characteristic (ROC) areas for each threshold value. This experiment was performed to test whether ISCH is sensitive to the selection of the minimum change threshold. Such sensitivity would indicate the need for establishment of normal stress–rest change limits. To compare voxel sampling with polar map sampling, we also derived the raw polar maps from coregistered stress and rest images and similarly integrated the differences of the polar map samples.
Display of Changes.
A display module was designed and implemented to facilitate visual evaluation of the detection of changes by the new method. Normalized and coregistered stress and rest images could be displayed in a synchronized manner with or without overlaid stress contours. Count changes could be overlaid on raw stress slices and were rendered using a separate continuous color table and transparency function similar to the techniques used in image fusion, highlighting the stress–rest changes. A “roving window” technique allowed interactive switching of the rest and stress image data in a selected movable display subarea to verify visually the image alignment and the extent of changes. Stress contours could be shown overlaid on both stress and rest images to assess registration.
The results of the fitting and stress contour detection for all patients were evaluated by an experienced nuclear cardiologist and were reported on a scale of 1–3 (1 = excellent fit, 2 = satisfactory fit, and 3 = failure of the fit). Stress contour quality was also evaluated using a similar scale.
Statistical Analysis
All continuous variables are expressed as mean ± SD. A threshold P value of <0.05 was considered significant. ROC curves were analyzed to compare the value of visual scoring, existing quantitative analysis, and the new method for predicting 50% and 70% stenoses of coronary arteries. Differences between ROC curve areas (area ± SE) were compared using GraphROC software (University of Turku) (17) and a paired comparison method for ROC curves (18).
RESULTS
The fitting was judged to be excellent in 177 of 204 patients, satisfactory in 25 of 204 patients, and poor in 2 of 204 patients. The contour detection was judged excellent in 190 of 204 patients and satisfactory in 14 of 204 patients. All contour detections or fittings that were not judged as excellent by the human observer were for patients who had stress perfusion abnormalities by both visual and standard quantification and moderate to large values of ISCH (>5%) using the automatic measurement. Therefore, manual adjustment would not affect the performance of the program for predicting coronary artery stenosis, compared with visual or standard quantitative analysis, and no manual intervention was performed in deriving the results. The average total processing time for the image fitting and quantification of ISCH was 39 ± 5 s on a 2-GHz Pentium (Intel Corp.).
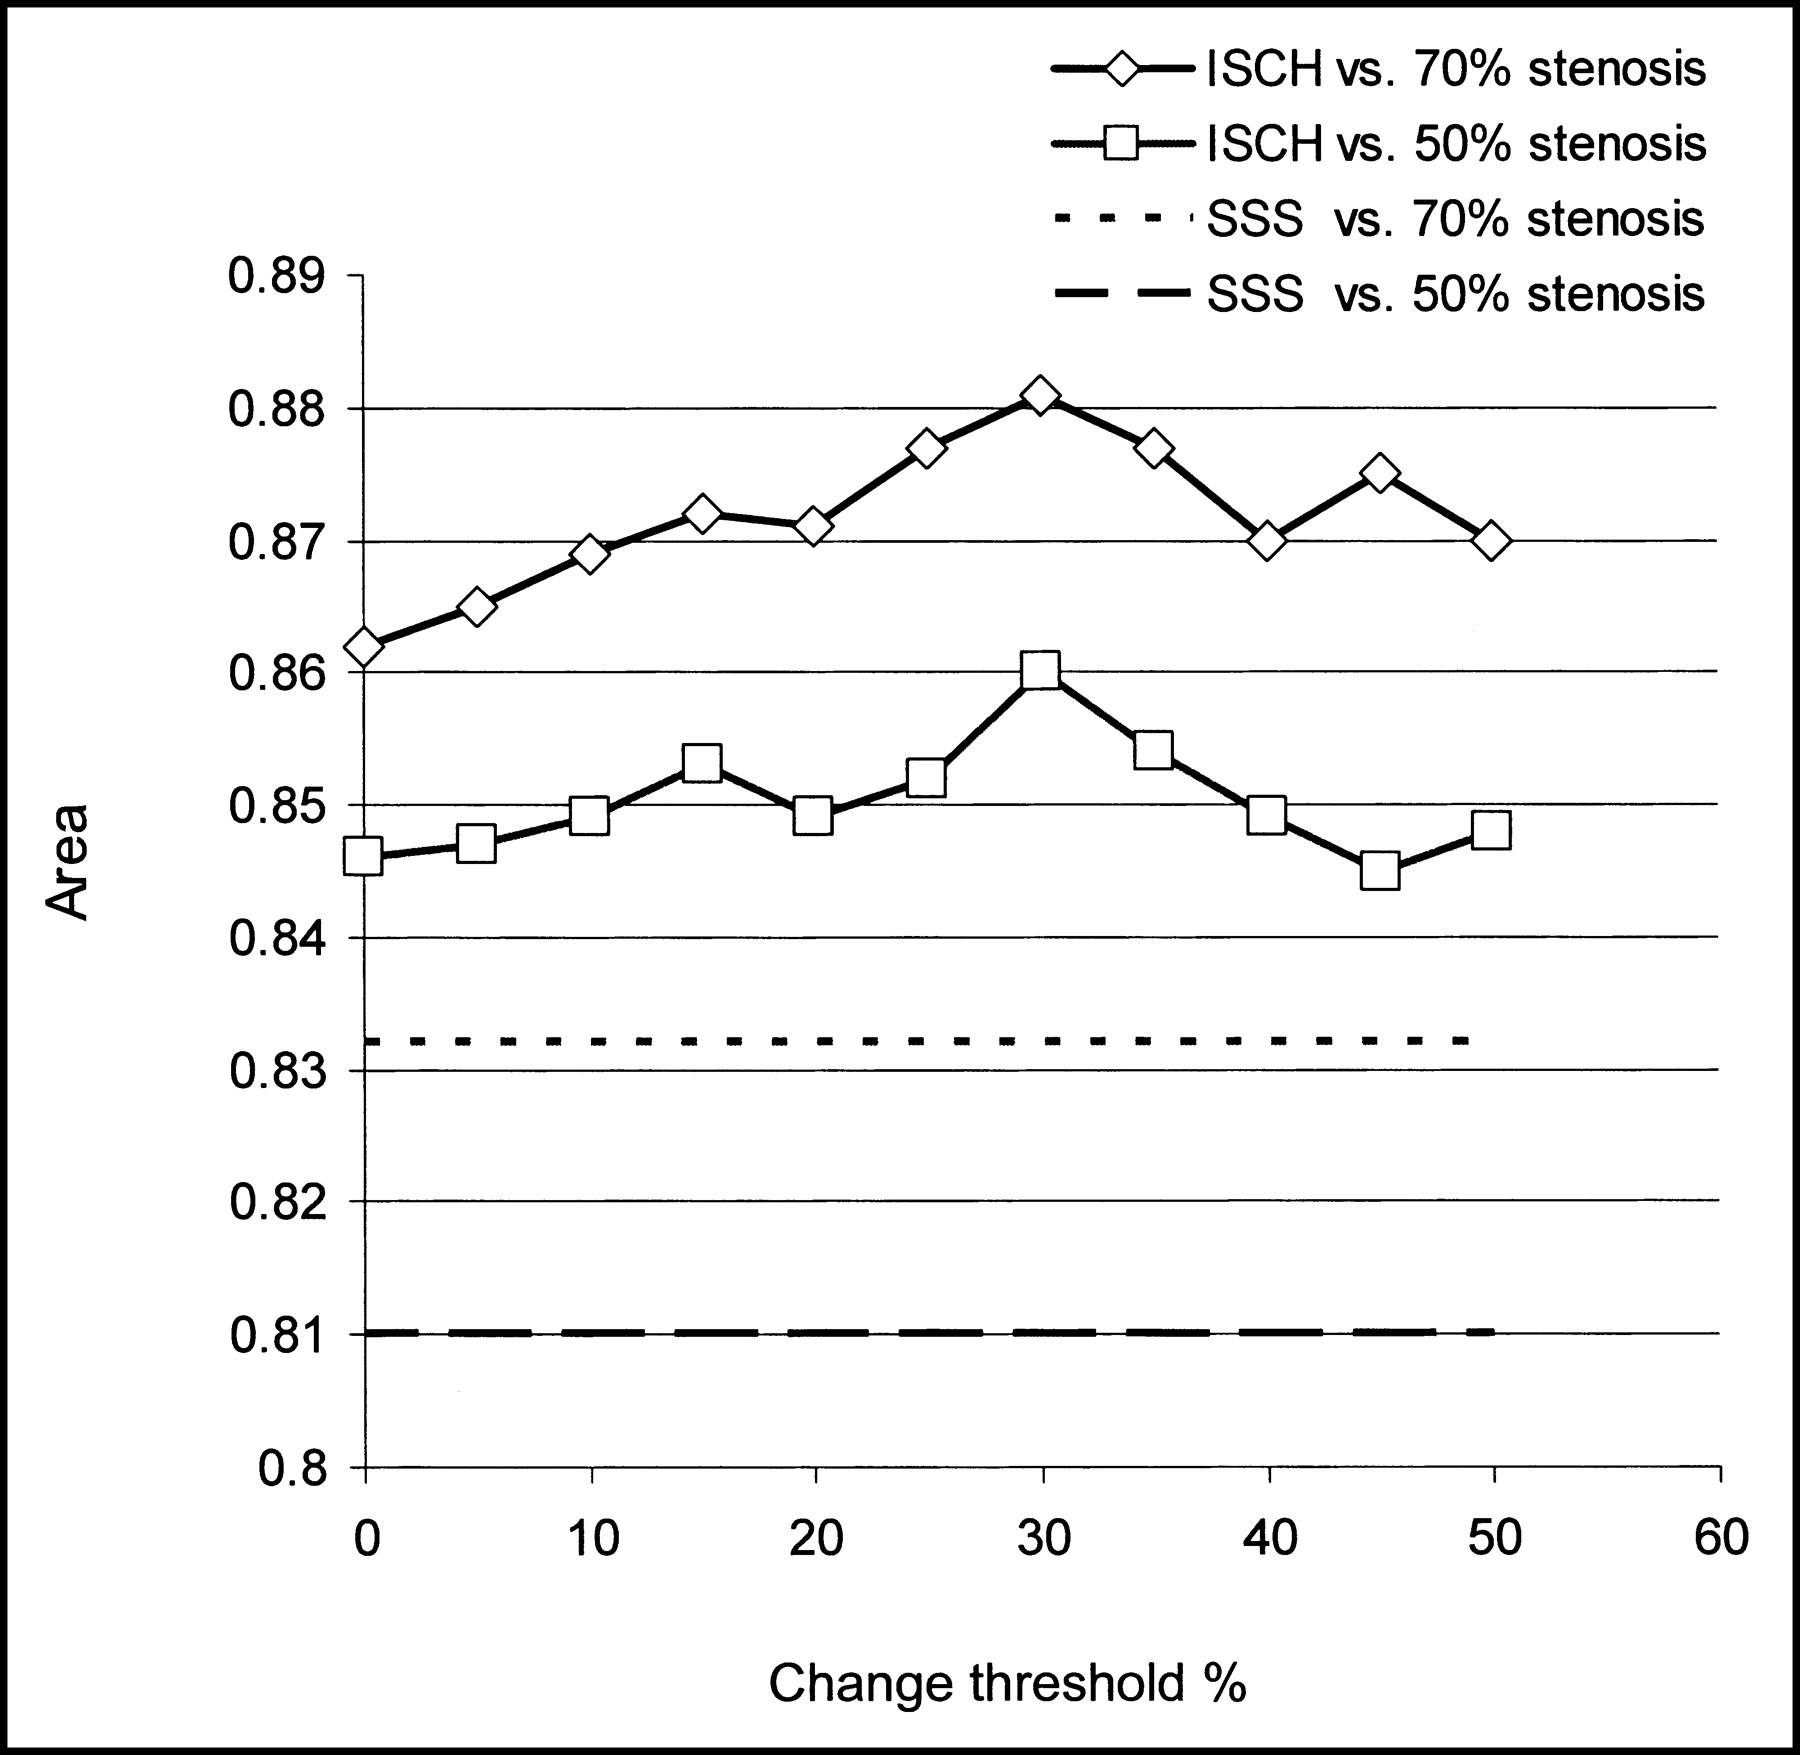
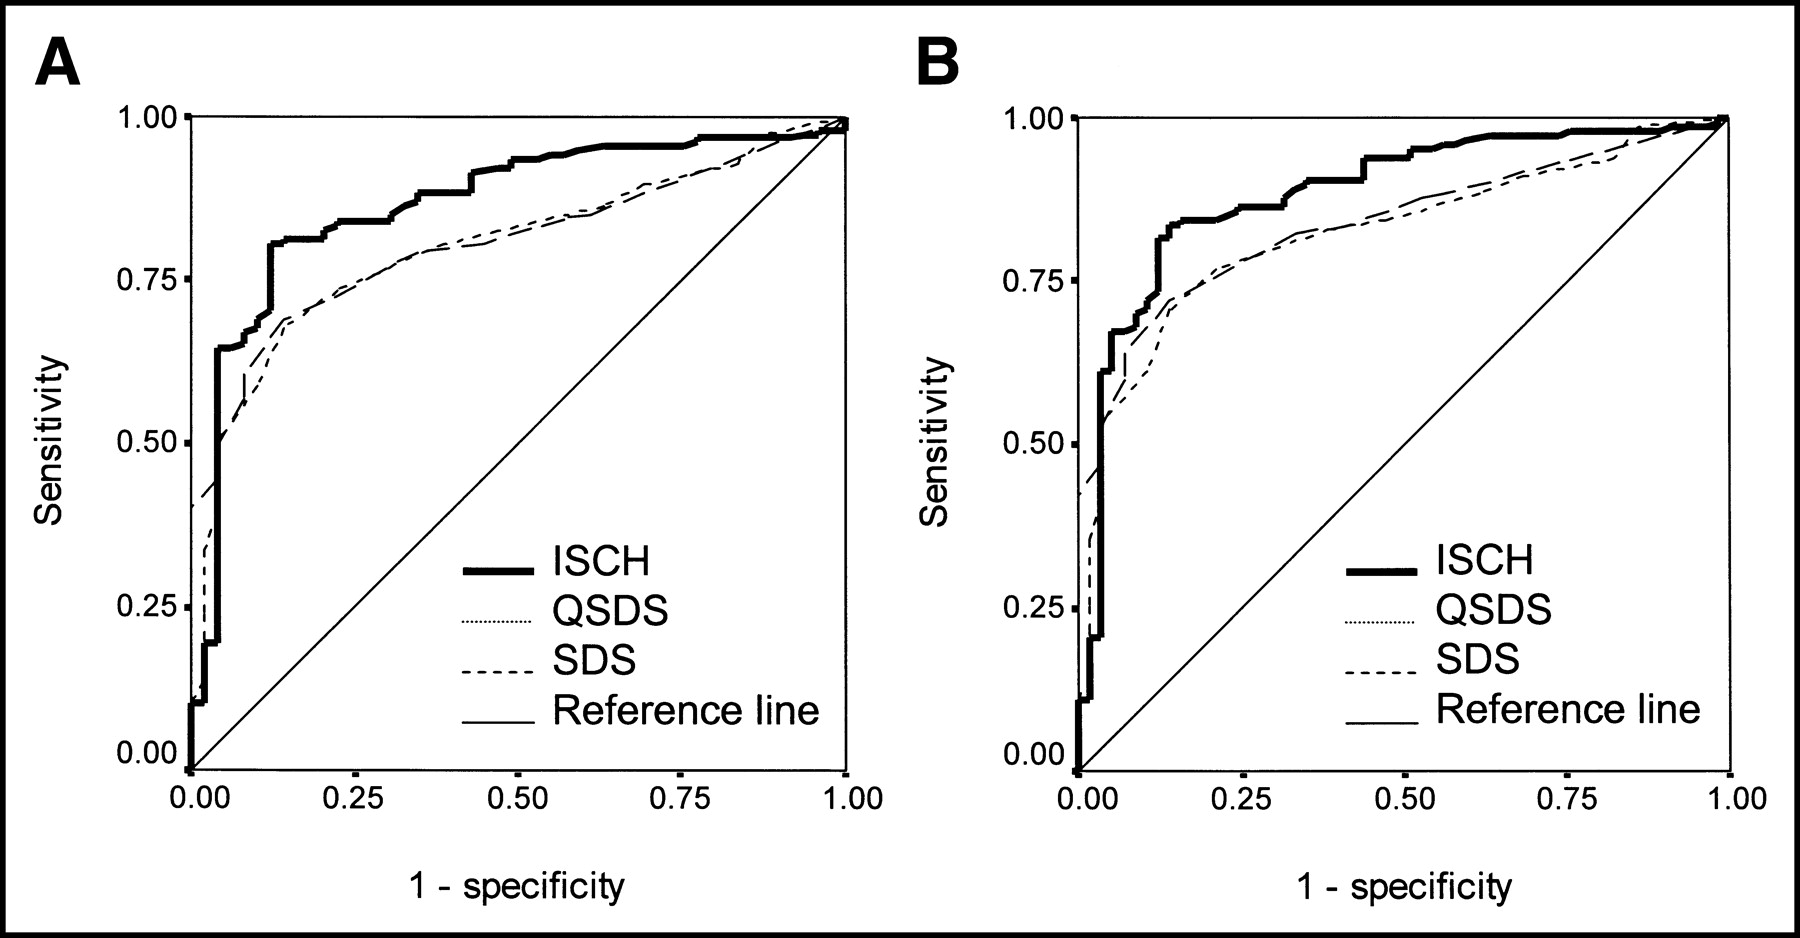
The areas under the ISCH ROC curves derived with various minimum change thresholds for the integration of counts were similar. Figure 1 illustrates the area under the ROC curve as a function of the threshold used for count integration, as compared with the baseline ROC of the SSS and QSSS techniques. The prediction of the stenosis by ISCH regardless of the change threshold applied was better than that obtained by any of the automatic quantitative methods. Figure 2 compares ISCH ROC curves with visual and QSSS measures in the prediction of coronary artery stenosis. Similarly, Figure 3 compares ROC ISCH curves with visual and QSDS measures in the prediction of CA stenosis. Table 2 summarizes the areas under the ROC curves presented in Figures 2 and 3 indicating statistical significance. When compared with the visual analysis methods (SSS and SDS), the sensitivities, although not significantly higher, were generally higher for most specificities. In the subsequent analysis and comparisons, we used a 30% change threshold for the quantification of ISCH. In addition, when compared with the quantitative scoring system (QSDS and QSSS), ISCH analyzed separately for women had a significantly better area under the ROC curve (0.84 ± 0.05 vs. 0.68 ± 0.07 for QSSS and 0.69 ± 0.07 for QSDS, P < 0.05 for both), despite the relatively small number of patients in that group (n = 62). The value of ISCH was 0.7% ± 1.1% for patients with stenosis < 70% and 3.4% ± 3.0% for patients with stenosis ≥ 70%.

ISCH area under the ROC curve expressed as a function of the change threshold used in the calculation of ISCH. For reference, areas under the ROC curves obtained by visual analysis are shown as straight lines.

Comparison of the ROC curves for ISCH with SSS, QSSS, and stress extent measures for the prediction of 50% (A) and 70% (B) coronary artery stenosis.

Comparison of the ROC curves for ISCH with SDS and QSDS measures for the prediction of 50% (A) and 70% (B) coronary artery stenosis.
Areas Under ROC Curves for Prediction of Coronary Artery Stenosis Compared with Previous Database Techniques
If a 0.8% threshold for prediction of stenosis by ISCH had been chosen, the method would have had a sensitivity of 84% and a specificity of 74% for coronary stenosis ≥ 50% and a sensitivity of 86% and a specificity of 72% for stenosis ≥ 70%. For comparison, when an established cutoff (SSS ≥ 4) was used (6), the sensitivity of the visual analysis in the patient group with stenosis ≥ 70% was 84% and the specificity was 67%. Assuming the 0.8% threshold, ISCH was false negative in 8 patients, despite a visual finding of abnormality (SSS ≥ 4) and the presence of stenosis. In that group, the average weight was 89 ± 18 kg (198 ± 40 lb) and 5 of 8 patients had inferior reversible defects by visual analysis. On the other hand, there were 12 patients with false-negative visual scoring and positive ISCH. All 12 of these patients demonstrated subtle reversible defects as assessed visually, but with SSS < 4. In this group, 6 patients had single-vessel disease and 6 patients had multivessel disease, all with stenosis ≥ 70% by coronary angiography.
We also evaluated modified approaches for the calculation of ISCH, using the standard normalization factor method without optimal search and using the 80th percentile of the maximum. We also integrated changes using polar map sampling instead of voxel-based sampling. Any such modification of the technique resulted in a decreased area under the ROC curve, with the normalization factor having the strongest effect. Table 3 shows results for the following methods: raw polar map–based calculation with normalization factor based on percentile of maximum counts, raw polar map–based calculation with search for optimal normalization factor, voxel map–based calculation with normalization factor based on percentile of maximum counts, and voxel map–based calculation with search for optimal normalization factor. The methods that did not use the search method for the normalization factor had an area under the ROC curve significantly lower than did the methods that used this approach. Also, the methods that did not use the iterative search for the normalization factor were not significantly different from previous quantitative methods presented in Table 2. This finding indicates that the method of calculating the normalization factor is important in the overall quantification scheme.
Areas Under ROC Curves for Prediction of Coronary Artery Stenosis for Various Measures of Direct Stress–Rest Change
Short-axis and vertical long-axis slices of a typical patient with ischemia and confirmed 70% stenosis of the left circumflex coronary artery and left anterior descending coronary artery are shown in Figure 4. Figure 5 illustrates the registration of these images by displaying stress contours on both stress and rest images. It also shows a visual representation of the change (coregistered, subtracted, and normalized) images displayed in a continuous color scale superimposed on the gray-scale stress image or contours.
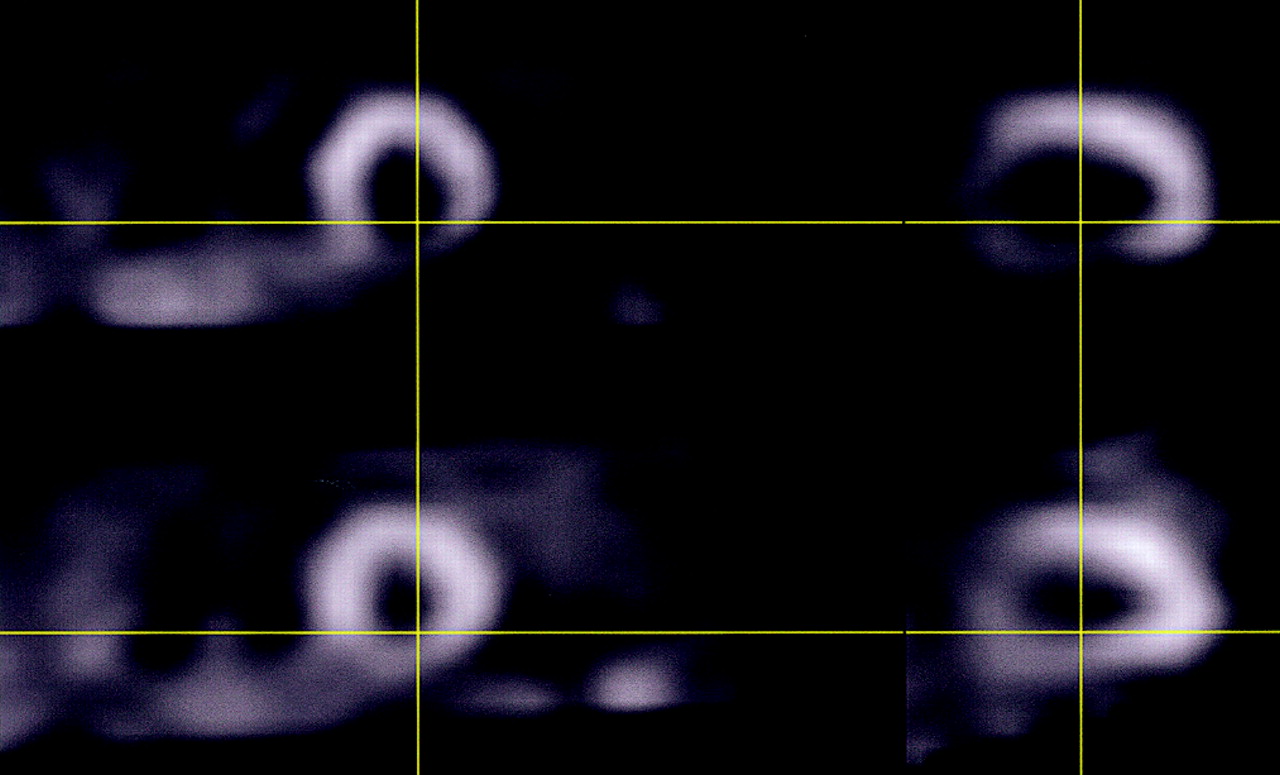
Short-axis (left) and vertical long-axis (right) slices in a typical patient with stress-induced ischemia and no infarct.
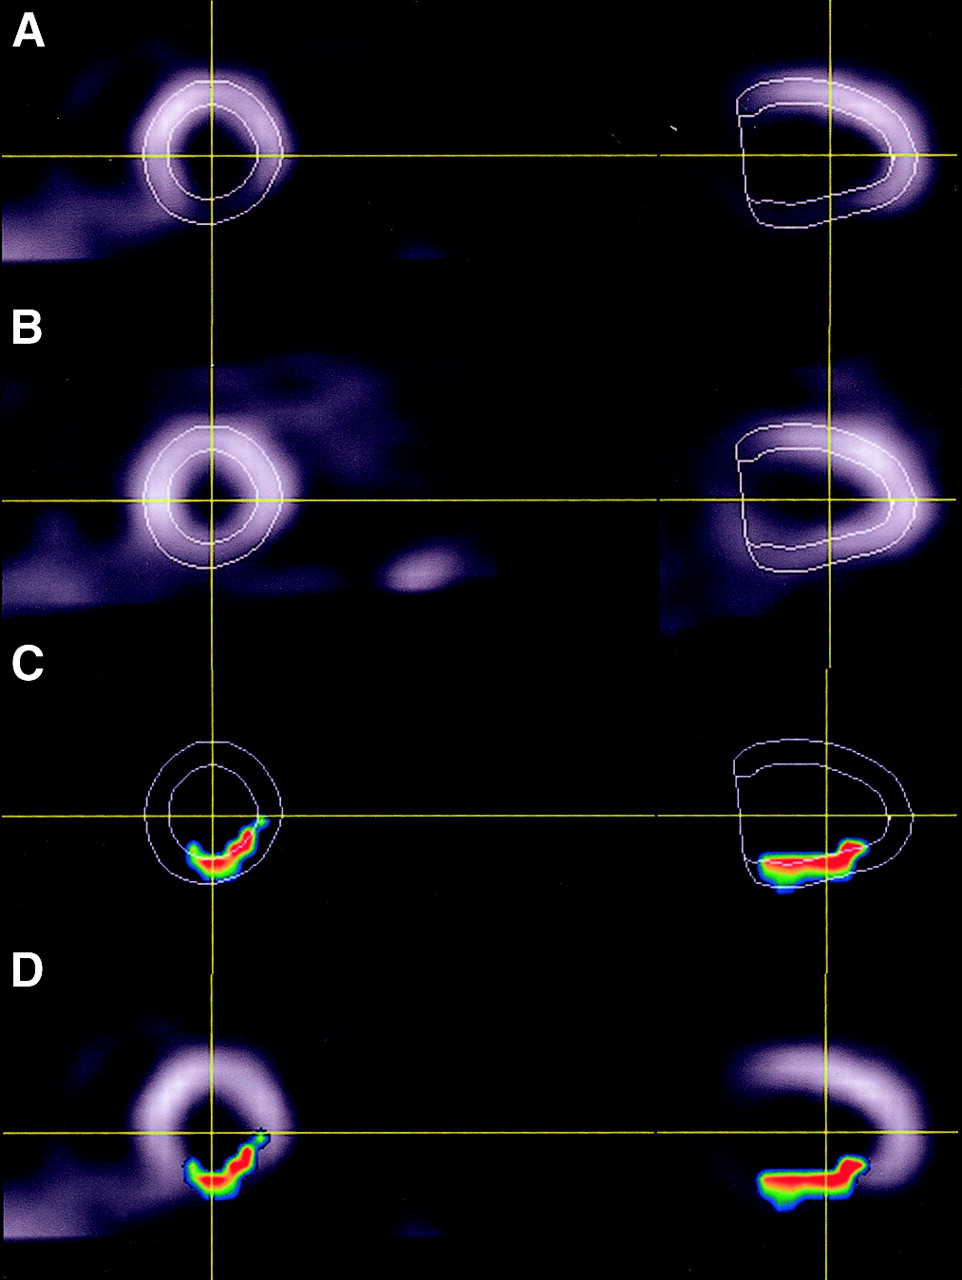
Visualization of the stress–rest change estimated to be 4.5% by ISCH: (A) 99mTc stress images with stress contours, (B) coregistered 201Tl REST images with stress contours, (C) change counts displayed within the contour (partial-volume effect causes some voxels to be partially outside the contour), and (D) fused display of normalized change counts with stress images.
DISCUSSION
In this study, we sought to revisit some of the conventional wisdom regarding MPS quantification. We developed and evaluated a direct method for detecting changes between stress and rest images, without the use of polar maps or databases. To ensure tight spatial alignment between stress and rest images, we applied an automated iterative image registration technique. The image registration technique also incorporated a new way for deriving the optimal count normalization factor between stress and rest scans. The potential advantages of this new technique include no need for protocol-specific databases, full automation and simplicity, immediate applicability to a variety of protocols, and potentially improved performance due to direct voxel-based image comparison. We found that this method outperforms standard quantitative analysis for detection of significant coronary stenoses and is at least equal to expert visual analysis in this regard.
One of the important implications of this work is that the results suggest the possibility of achieving high-performance quantification of ischemia, as demonstrated by the obtained ROC curves, without using complicated procedures for the protocol-specific derivation of normal limits. Instead, the change between stress and rest images is directly estimated by coregistration. A global cutoff for such a change could be derived to predict coronary artery stenosis. In practical terms, these findings suggest that the quantification of ischemia could potentially be simplified for laboratories that do not have the capabilities or resources to derive their own reference databases and, because of their use of an unsupported protocol or equipment, are not able to use the standard sets of normal limits typically available with the quantification software. In the case of a stress-only protocol, ISCH could not be used; however, one could derive a stress-only database for this purpose. In this way, the complexity of creating and maintaining appropriate databases would be significantly reduced. For example, the same stress 99mTc database could be used for both rest 99mTc/stress 99mTc and rest 201Tl/stress 99mTc protocols.
For a clear-cut validation of the ischemia measure, the test group was deliberately chosen not to include patients with infarcts. Although the ISCH technique could not be used to estimate infarct size in these patients, it could potentially be used to detect ischemic tissue surrounding the infarct. Although we have not yet verified that this technique will work well to estimate the amount of ischemia in patients with infarcts, we know that the contour detection works well on 99mTc-sestamibi images (11). We also know that the image registration is reliable even for large stress and rest defects when registering to reference templates (19) and that the appearance of stress and rest images, both with infarcts, will be similar. We therefore anticipate that our technique will be applicable to patients with infarcts; however, this needs to be confirmed in a further study.
The proposed method appears to be better than all current quantitative measures in predicting 70% coronary artery stenosis, measured as the area under the ROC curve. The ROC curves also suggest that ISCH could be better than visual SSS and SDS scores for predicting both 50% and 70% stenosis, although these results did not reach statistical significance. A larger group of patients would be required to confirm such claims. However, the ISCH technique consistently outperformed the traditional measures for most points on the ROC curves for both normal-limits–based and visual analysis. In addition, visual scores were derived with additional information available to the reader, such as prone stress images and the clinical history of the patient. Especially of interest was the ability of the technique to detect borderline-abnormal findings on 12 scans that were read visually and quantitatively as showing normal findings but were of patients who had coronary stenosis confirmed by coronary angiography (8% of patients with coronary stenosis). At the same time, the specificity of the technique remained high. In addition, our preliminary results indicated that the technique might be of particular benefit in women. Despite the small number of women (n = 62) included in the current data collection, ISCH could be shown to be significantly better than existing techniques in predicting 50% coronary stenosis. The underperformance of MPS and quantitative analysis in women is well known, and any improvement in the results obtained for women would be of significant value.
The detection of serial changes without the use of the database has been shown successful and was previously validated for 82Rb PET using paired comparisons of polar maps and normal limits of change derived from the dynamic data (20). Such an approach could not be directly applied to the problem presented in this study because of the lack of serial dynamic data. More recently, preliminary methods have been presented extending the serial quantification approach to serial gated SPECT (21). However, in the case of stress and rest comparisons, gated rest data may not always be available, and estimation of the normalization factor between stress and rest also presents additional complications. There was also a report of stress–rest changes being detected directly without the database using an artificial neural network method (22). In our approach, instead of determining the significance of changes on a pixel basis or using neural networks, we calculated a global integrated sum of differences without using pixel-specific thresholds and showed that such a measure can be used as a predictor of coronary stenosis.
Our algorithm has some practical advantages in comparison with the currently available methods. The algorithm uses automatic segmentation of higher-quality stress images without attempting to derive 201Tl contours, using instead a robust volume-based registration technique. The 201Tl images are typically more often of lower quality (23), and we therefore expect that using stress-only contours would enhance the reliability of the algorithm. In addition, the use of the same contour shape for both scans is more appropriate for comparing changes. For example, in the basal area of the LV, contour detection may not be precise because of the low counts in that region. In standard methods, the boundaries and valve planes are estimated independently on rest and stress images and there is a potential of introducing false-positive results by comparing basal areas, which are not at exactly the same location. In our approach, we do not use polar map sampling in the calculation of the ischemia measure, bypassing potential limitations introduced with fixed geometric sampling schemes. The ischemia measures derived by the polar sampling after image registration have decreased the area under the ROC curve, when compared with the voxel-based method (Table 3). The use of the true individual shape of the LV and volume data in the quantification processes could be of particular value in hearts with atypical shapes, or in the case of apical defects that are not correctly sampled by the polar map schemes. In addition, the created change maps have 3-dimensional character and can be visualized directly on the image slices (Fig. 5), creating a visually appealing technique and making this method potentially useful in image fusion and comparison with other modalities such as MRI and CT, which do not use polar map sampling.
Linear and nonlinear registration techniques have been applied previously for the registration of cardiac SPECT images to reference models or templates (13,24–27) and serial cardiac PET images (16,28) and for the registration of SPECT to PET images (29). Image registration of cardiac 201Tl exercise and redistribution/reinsertion studies has been evaluated in 13 patients, without quantification of change (30). To our knowledge, however, image registration had not until now been proposed for the quantitative estimation of ischemia from paired stress–rest SPECT images. In this work, we developed a practical standalone system that uses direct rest-to-stress image registration and quantifies change using coregistered images. We incorporated the search for the optimal normalization factor into the registration procedure using a novel 2-pass approach, which eliminates the influence of abnormalities. The obtained ROC curves indicate that such derivation of the normalization factor better predicts coronary stenosis than do the standard methods based on image maxima. These results confirm recent findings by Williams et al., who demonstrated improved performance by interactive normalization of scans (4).
The main limitation of the proposed technique is that it could not be used when the rest scan was not available or was of unacceptable quality. Nor could the technique be used to estimate the size of nonreversible defects. However, as explained above, the change technique could be combined with stress-only normal limits to allow this function. Our technique also does not address the fundamental limitation of SPECT imaging—its showing relative perfusion changes only and being known to underestimate the change between stress and rest (31). Therefore, PET-based coronary flow reserve techniques might ultimately be better for detection of ischemia (32,33). The proposed technique also may not be able to detect changes masked by the effect of hibernating or stunned myocardium (34). In addition, assessment of the severity of the stenosis on angiograms has its own limitations in determining the physiologically significant lesions (35).
In this study, we have provided only a preliminary validation based on the coronary angiography results using coronary stenosis as a gold standard. Therefore, we validated only the performance of the technique in the prediction of coronary artery stenosis; we did not validate the accuracy of the magnitude of ISCH or compare it with other techniques. Proving the accuracy of ISCH would require an independent estimate of ischemia. Such validation of the accuracy of ISCH could conceivably be performed using phantom and simulation studies and other imaging modalities such as MRI or PET. We will also require additional validation of the ISCH threshold for detecting the abnormality and establishing the optimal sensitivity and specificity of the technique, because in the present study we primarily analyzed the ROC curves, which are independent of the threshold used.
CONCLUSION
We have developed a practical and fully automatic algorithm for quantification of stress-induced changes from paired rest 201Tl/stress 99mTc scans. The proposed method is fully automatic and does not use protocol-specific databases. The analysis of its performance in comparison with that of coronary angiography indicates that this new approach may outperform current automatic and semiautomatic methods for detecting ischemia, especially in women, while simplifying the quantification process. Further validation of this method for quantifying the extent of ischemia would appear to be warranted.
Acknowledgments
The authors thank Heidi Gransar for the statistical analysis. This study was supported in part by Medical Research Council operating grant MOP-38043.
Footnotes
Received May 12, 2003; revision accepted Oct. 9, 2003.
For correspondence or reprints contact: Piotr J. Slomka, PhD, Department of Imaging, Cedars-Sinai Medical Center, A047 8700 Beverly Blvd., Los Angeles, CA 90048.
E-mail: Piotr.Slomka{at}cshs.org
REFERENCES
In this issue


Jump to section
Related Articles
Cited By...
- Deep Learning-Based Attenuation Correction Improves Diagnostic Accuracy of Cardiac SPECT
- Quantitative clinical nuclear cardiology, part 2: Evolving/emerging applications
- Arterial CO2 as a Potent Coronary Vasodilator: A Preclinical PET/MR Validation Study with Implications for Cardiac Stress Testing
- Serial Myocardial Perfusion Imaging: Defining a Significant Change and Targeting Management Decisions
- Improved Accuracy of Myocardial Perfusion SPECT for the Detection of Coronary Artery Disease Using a Support Vector Machine Algorithm
- Direct Quantification of Left Ventricular Motion and Thickening Changes Using Rest-Stress Myocardial Perfusion SPECT
- Multicenter Trial of High-Speed Versus Conventional Single-Photon Emission Computed Tomography Imaging: Quantitative Results of Myocardial Perfusion and Left Ventricular Function
- Improved Quantification and Normal Limits for Myocardial Perfusion Stress-Rest Change
- Comparison of Myocardial Perfusion 82Rb PET Performed with CT- and Transmission CT-Based Attenuation Correction
- Imaging of Gene Expression in Live Pancreatic Islet Cell Lines Using Dual-Isotope SPECT
- Combined Supine and Prone Quantitative Myocardial Perfusion SPECT: Method Development and Clinical Validation in Patients with No Known Coronary Artery Disease
- Assessment of Myocardial Reperfusion After Myocardial Infarction Using Automatic 3-Dimensional Quantification and Template Matching
- Quantification of Serial Changes in Myocardial Perfusion
- "Motion-Frozen" Display and Quantification of Myocardial Perfusion