


Abstract
We aimed to improve the quantification of myocardial perfusion stress–rest changes in myocardial perfusion SPECT (MPS) studies for the optimal automatic detection of ischemia and coronary artery disease (CAD). Methods: Rest–stress 99mTc MPS studies (997 cases; 651 consecutive cases with correlating angiography and 346 cases with less than 5% likelihood (low likelihood [LLK]) of CAD) were analyzed. Normal limits for stress–rest changes were derived from additional LLK patients (40 women, 40 men). We computed the global stress–rest change (C-SR) by integrating direct stress–rest changes for each polar map pixel. Additionally, stress–rest change and total perfusion deficit (TPD) at stress were combined in 1 variable (C-TPD) for the optimal detection of CAD. Results: The area under the receiver-operating-characteristic curve (AUC) for C-SR (0.92) was larger than that for stress TPD–rest TPD (0.88) for the identification of stenosis of 70% or more (P < 0.0001). AUC (0.94) and sensitivity (90%) for C-TPD were higher than those for stress TPD (0.91 and 83%, respectively) (P < 0.0001), whereas specificity remained the same (81%). Conclusion: C-SR and C-TPD provide higher diagnostic performance than difference between stress and rest TPD or stress hypoperfusion analysis.
The presence of perfusion abnormalities on the stress myocardial perfusion SPECT (MPS) scan that become smaller or disappear on the rest scan is a hallmark of ischemia. Hence, assessment of myocardial perfusion at stress and rest is essential for the diagnosis of coronary artery disease (CAD) and risk stratification of patients with ischemic heart disease (1). In current quantification protocols, the stress and rest data are fitted separately to a geometric polar map model. Subsequently, polar map samples of stress and rest patient data are compared with the respective normal-limit polar map samples (2), and measures of hypoperfusion such as total perfusion deficit (TPD) are derived separately at stress and rest. Subsequently, to estimate ischemia, stress and rest TPD can be subtracted (2). A limitation of such separate comparisons is that the unique shape of each individual heart is lost in that process, even though this shape is similar for the rest and stress scans of a given patient. Furthermore, differences in orientation and position between stress and rest images can occur because no direct alignment is performed. In short, when change is computed from the individual TPDs, it is in fact a derived quantity that suffers from propagation-of-error issues.
Another potential source of error could occur because of the relative nature of MPS quantification, when separate stress and rest count normalization factors are estimated for paired scans when comparing them with respective stress and rest databases. Significant errors in standard normalization techniques have been reported (3). To optimize the estimate of ischemia derived from paired stress–rest scans, in 2004 a general computer technique based on image coregistration of rest and stress images and voxel-by-voxel estimation of differences was proposed by our group (4). In this study, we aimed to improve the quantitative measure of myocardial perfusion stress–rest change using normal limits of polar map pixel changes between stress and rest combined with registration and direct normalization of stress and rest as previously proposed. We describe the software implementation and compare the results of our new method with currently accepted methods of evaluating ischemia (difference between stress and rest TPDs or difference in summed scores). In these comparisons, we use coronary angiography or likelihood of coronary artery disease as the reference standard. We show that using a database of individual stress–rest changes improves the measure of ischemia and can be combined with stress TPD measure (2) for superior detection of CAD.
MATERIALS AND METHODS
Population
The study was retrospective, and Institutional Review Board approval was obtained for anonymous review of the data. The total study population consisted of 997 patients who underwent exercise or adenosine stress 99mTc-sestamibi MPS. The total referral population included 9,709 patients. To obtain normalcy rates, 346 consecutive patients (Table 1) with a low likelihood (LLK) of CAD were analyzed. For angiographic validation, 651 consecutive patients (369 men, 282 women) who had coronary angiography within 3 mo of MPS were used. Exclusion criteria were as follows: prior myocardial infarction or coronary revascularization, nonischemic cardiomyopathy or vascular heart disease, and change in symptoms between MPS and coronary angiography. We evaluated normal limits from a separate group of 80 patients (40 women, 40 men) with an LLK of CAD (<5%) who were selected consecutively on the basis of age, sex, pretest symptoms, and electrocardiogram response to adequate treadmill stress testing. Additionally, the distribution of diseased vessels for our dataset is illustrated in Table 2. The number of diseased left anterior descending (LAD) coronary artery, left circumflex (LCX) coronary artery, and right coronary artery (RCA) vessels (≥70% lesion) were 280, 169, and 247, respectively. The number of diseased LAD and LCX, LAD and RCA, and LCX and RCA vessels (≥70% lesion) were 101, 138 and 98, respectively. Seventy cases of triple-vessel disease were present in our dataset when using ≥70% stenosis as a criterion.
Characteristics of Patients
Distribution of Diseased Vessels in Angiographic Population (n = 651)
Acquisition and Reconstruction Protocols
Studies were performed using 99mTc rest and 99mTc stress protocols. A same-day rest–stress protocol was used for women who weighed less than 90 kg (200 lb) or whose body mass index (BMI) was less than 35 kg/m2 and for men who weighed less than 112.5 kg (250 lb) or whose BMI was less than 40 kg/m2. A 2-d rest–stress or stress–rest protocol was used for those individuals whose weight or BMI levels were above these levels. The weight- or BMI-related 99mTc-sestamibi dose ranged from 315 MBq (8.5 mCi) to 429 MBq (11.6 mCi) for rest MPS and from 1,092 MBq (29.5 mCi) to 1,554 MBq (42 mCi) for stress MPS. For 2-d protocols, the stress dose was used for both the rest and the stress portions of the study. The details of image acquisition and tomographic reconstruction for this study have been described in a previous study (5). In brief, all subjects were first imaged at 60 min either after the administration of 99mTc-sestamibi at rest or during adenosine infusion with the patient at rest and then additionally at 15–45 min after either radiopharmaceutical injection during treadmill testing or adenosine infusion with low-level exercise. MPS of each patient was performed using dual-detector scintillation cameras with low-energy high-resolution collimators (Vertex; Philips). For this analysis, we did not use attenuation-corrected data. All images were acquired with a noncircular 180° orbit, from 45° right anterior oblique to left posterior oblique, with a 64 × 64 matrix (pixel size, 0.64 cm). At each of the 64 projection angles, the image data were recorded in 8 equal electrocardiogram-gated time bins. The time per projection used in this study was 45–50 s for rest MPS and 30–40 s for stress MPS. Rest and stress doses were administered using a weight-related scale and ranged from 296 to 444 MBq (8–12 mCi) for rest and from 1,110 to 1,554 MBq (30–42 mCi) for stress. Tomographic reconstruction was performed using the AutoSPECT and Vantage Pro programs (Philips).
Coronary Angiography
Coronary angiography was performed with the standard Judkins approach, and all coronary angiograms were interpreted visually by a physician with more than 30 y of experience. The arbitrary cutoff point used for the definition of CAD is ≥70% narrowing of maximal lumen diameter.
LLK estimation
An LLK of CAD (<5%) was defined using age, sex, pretest symptoms, and electrocardiogram response to treadmill stress testing (6). Accordingly, patients who underwent treadmill stress testing and who had an adequate level of treadmill stress (≥85% of predicted maximum heart rate) were chosen. These patients had no history of CAD (a previous myocardial infarction or coronary revascularization) or other confounding cardiac conditions, including congestive heart failure, cardiomyopathy, significant vascular or congenital heart disease, left-bundle branch block, or paced rhythm. These patients did not undergo coronary angiography. Furthermore, these subjects had MPS studies of good to excellent quality, normal ventricular volumes (7), normal wall motion, normal global systolic function, and no evidence of transient ischemic dilation, as judged by the director of the MPS laboratory where the data were acquired.
Standard Perfusion Quantification
Left ventricle extraction and fitting to the ellipsoidal model using the quantitative gated SPECT algorithm were performed to derive polar map representation as previously described (8). Count normalization was implemented using an iterative scheme, as previously done for stress–rest image normalization (4). All results were derived using batch-mode processing without human intervention of the algorithms described in this work. The algorithms were applied to the already reconstructed short-axis data, of which 124 cases (93 stress and 31 rest cases) had contours corrected. All further processing was fully automated. The stress and rest TPD measure combines defect severity and extent in 1 parameter and was previously described (3). The standard measure of change was defined as the difference between stress and rest TPD as currently used (9). In addition to pixel-based quantitative measurements, for comparison, we also computed the 17-segment summed stress score (SSS) and summed difference score (SDS) as previously described (2).
Direct Quantification of Change
Pairs of stress and rest images were coregistered and normalized to each other as previously described (4). Change polar maps were then generated for each case in the normal database. The normal database thus contained change values for each radial coordinate (a, p) of the polar map corresponding to each patient. Upper normal limits of change defined by 2 SDs above the mean were then established for each (a, p). Subsequently, global stress–rest perfusion change (C-SR) was calculated by integrating individual changes for each polar map pixel after scaling each change pixel to a standard 0–4 scale as previously described for TPD calculations (2).
Additionally, for optimal detection of CAD, we implemented a combined variable (C-TPD) that used an empiric rule to combine C-SR with TPD at stress for each polar map pixel into the quantification process. In a given polar map pixel, when stress perfusion abnormality falls below a certain threshold, as compared with stress normal limits, we replace the stress hypoperfusion value (as used for the TPD calculation) with the corresponding change value also in the scale from 0 to 4. The rationale for this approach is that subtle hypoperfusion defects are better detected by change analysis than by comparison to stress normal limits. Thresholds within the 0–4 range, with 0.5 steps for switching from stress perfusion to stress–rest perfusion values, were tested in our quantitation system, with a threshold of 2.0 resulting in the highest area under the receiver-operating-characteristic curve (AUC) for the detection of CAD from MPS.
Statistical Analysis
All continuous variables are expressed as mean ± SD. Paired t tests were used to compare differences in paired continuous data, and McNemar tests were used to compare differences in paired discrete data. A P value of less than 0.05 was considered significant. The AUC analysis was performed to evaluate the ability of the quantification to predict ≥70% stenosis of coronary arteries. In all analyses, the absence of CAD was defined as LLK of disease or less than 70% stenosis in angiography cases. Both of these groups were combined and considered as normal, providing a balanced set of data with approximately 50% of cases abnormal for subsequent analysis (5).
RESULTS
In Figure 1, the average and SD of the stress–rest changes obtained from the normal database (40 men and 40 women) are displayed using a 17-segment American Heart Association model. The average and SD changes were similar across the 3 populations (men, women, and sex-combined) and were not significantly different for any of the segments. This is in contrast to separate stress and rest normal limits, which are different for men and women, as was previously established (2). The change is not uniform across segments, indicating the value of applying the normal limits for change analysis. On the basis of these results, we have used sex-combined normal limits in subsequent analysis.
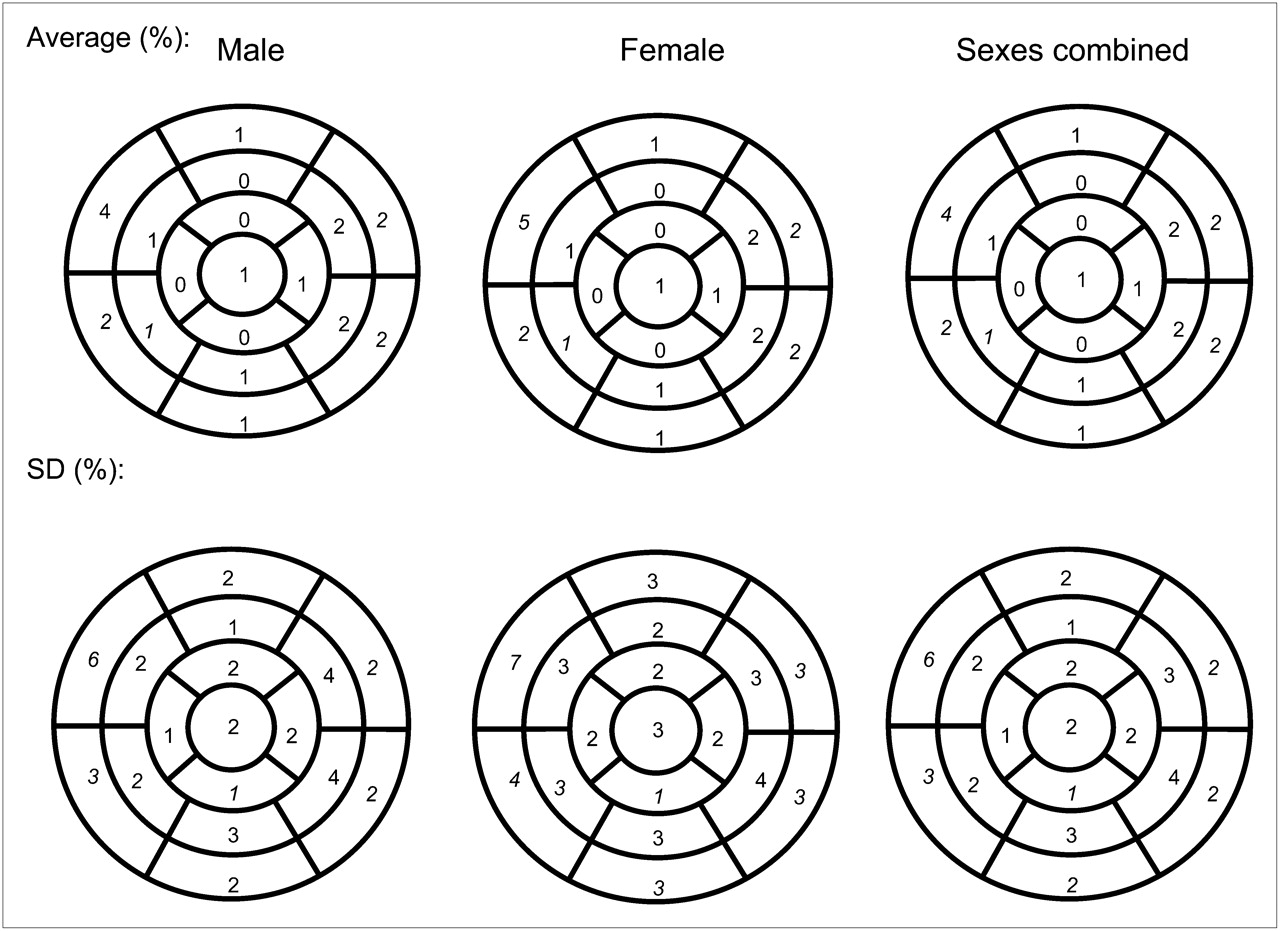
Seventeen-segment American Heart Association representation of normal limits of change derived from data for healthy men, women, and sexes combined. Average change (top) and SD of change (bottom) are shown for all segments.
The receiver-operating-characteristic curves for the detection of CAD using C-SR, stress–rest TPD change, and SDS are shown in Figure 2A. The AUCs for C-SR, standard change, and SDS were 0.92, 0.88, and 0.81, respectively (P < 0.0001). In Figure 2B, the curves for the detection of CAD using C-TPD, stress TPD, and SSS are displayed. AUC for C-TPD (0.94) was significantly higher than that for stress TPD (0.91) and SSS (0.89), as shown in Table 3. AUC for C-TPD (0.88) was significantly higher than that for TPD using stress (0.85) (P < 0.0001).
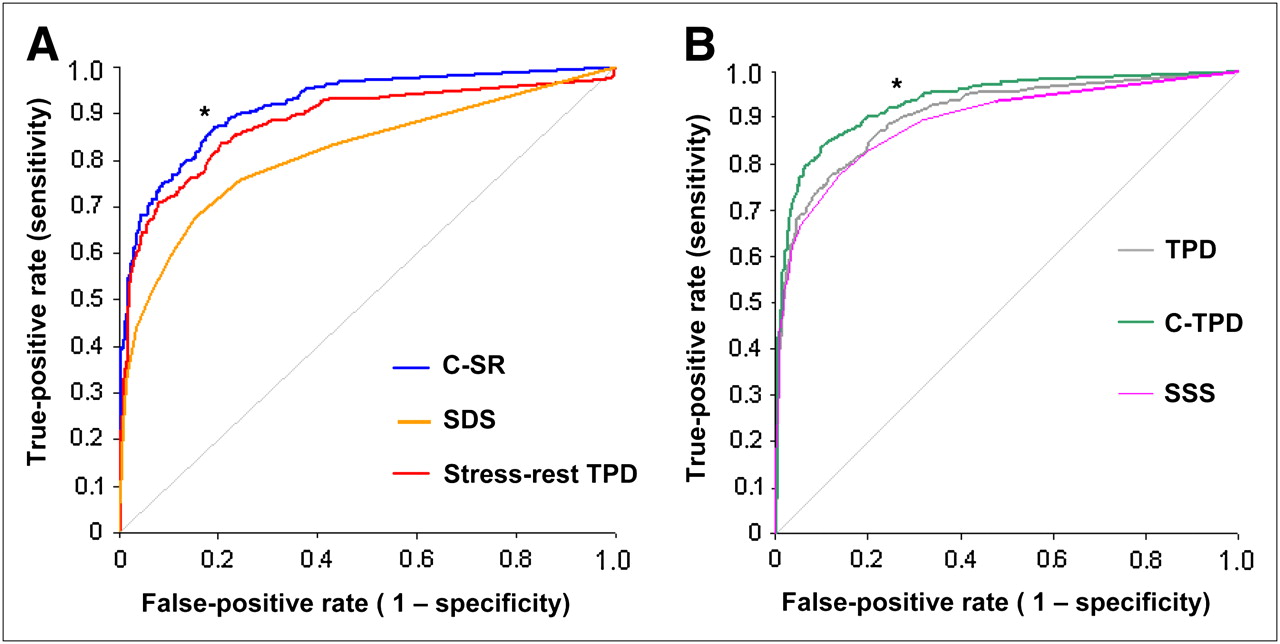
(A) AUCs for detection of CAD defined as ≥70% stenosis by change measure of C-SR (0.92), compared with SDS (0.81) and difference between stress and rest TPD (0.88) (n = 997). (B) AUCs for detection of CAD by combined measure C-TPD (0.94), compared with SSS (0.89) and stress TPD (0.91) (n = 997). *P < 0.0001.
AUCs for Different Quantitative Variables Used in Our Study
For the comparison of sensitivity, specificity, accuracy, and normalcy rates, we used a cutoff of 3.0% for TPD variables SSS ≥ 3 and SDS ≥ 2 for automatic scores as previously established (2). In general, the sensitivity and accuracy of C-TPD and C-SR for the detection of CAD was higher than standard measures of hypoperfusion. C-SR had higher specificity and accuracy than did stress–rest TPD change (P < 0.0001) or SDS (P < 0.0001), as can be seen in Figure 3A. The sensitivity of C-SR was the same as stress–rest TPD change and SDS. The specificity, however, remained constant at 81% for C-TPD and TPD as displayed in Figure 3B. Accuracy for C-TPD was significantly higher than for TPD (P = 0.0045) and SSS (P < 0.0001). When the angiographic group was considered separately, higher sensitivity and accuracy were also achieved using C-TPD than TPD and SSS (P < 0.0001). Using the same cutoff, we found a higher sensitivity and accuracy with C-TPD than with TPD (P ≤ 0.0005). Specificity, however, was slightly lower for C-TPD (61%) than for TPD (65%) (P = 0.023). The normalcy rate for C-TPD (92%) was similar to TPD (90%) (P = not significant [NS]) and higher than for SSS (85%). C-SR resulted in a normalcy rate of 92%, the same as that of stress–rest TPD (92%) (P = NS) but higher than that of SDS (80%) (P < 0.0001).
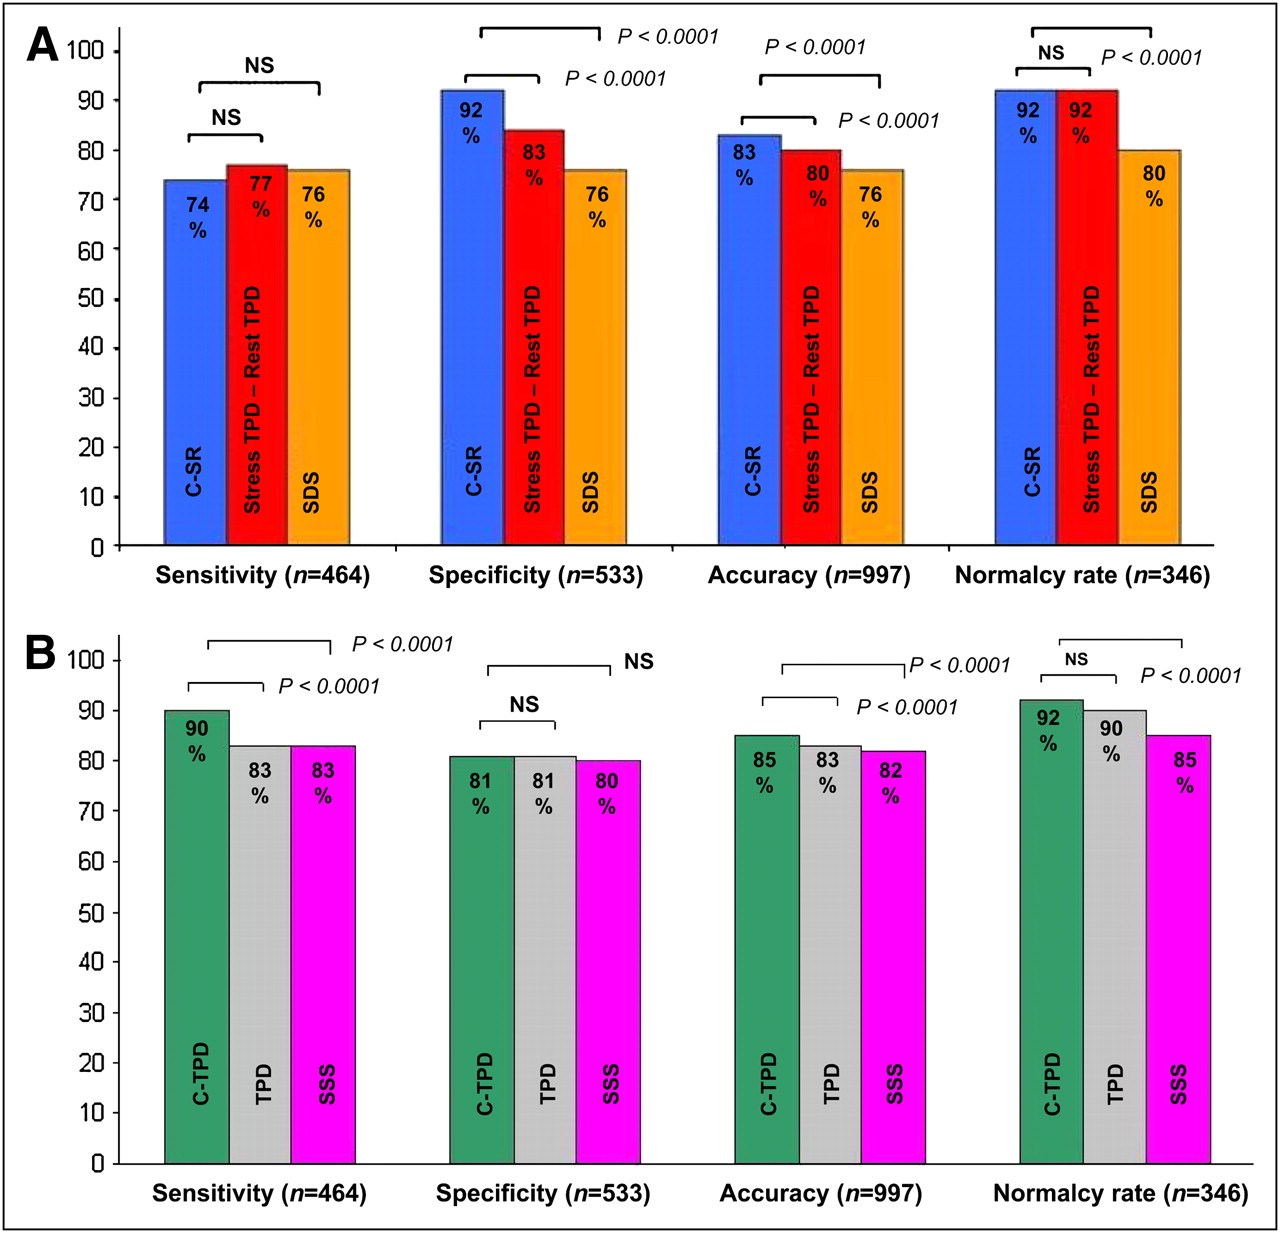
Sensitivities, specificities, accuracies, and normalcy rates for the different techniques: change measures (A) and combined measures (B). NS = not statistically significant.
For the angiographic group, the ejection fraction using stress and rest was 59.4% ± 12.3% and 61.6% ± 12.2%, respectively. SSS and SDS for the angiographic group was 7.9 ± 7.5 and 4.6 ± 5.0, respectively. The range for SSS and SDS using the angiographic group was 0–34 and 0–33, respectively. For the LLK group, the ejection fraction using stress and rest was 67.6% ± 8.2% and 62.7% ± 11.4%, respectively. SSS and SDS for the LLK group was 1.0 ± 1.8 and 0.87 ± 1.5, respectively. The range for SSS and SDS using the LLK group was 0–10 and 0–12, respectively. There were no significant differences between AUCs determined for ≥50% and ≥70% stenosis. We also noticed that for vessels with ≥50% lesions, the AUCs were higher (but not significantly) than for vessels with ≥70% lesions, as displayed in Table 4. In addition, we have performed analysis using ≥50% narrowing of maximal lumen diameter. Our analysis revealed an AUC of 0.94 using C-TPD for both ≥70% and ≥50% narrowing of maximal lumen diameter. AUCs of 0.92 and 0.91 were obtained using C-SR for ≥70% and ≥50% narrowing of maximal lumen diameter, respectively.
AUCs for Specific Vessel Territories
DISCUSSION
In this study, we developed and validated new quantitative MPS measures based on stress–rest changes that integrate normal limits of change for the purpose of CAD detection and combined it with traditional stress and rest quantification methods. The new measures can be derived in a fully automated manner and provide higher performance for detection of ≥70% stenosis than any currently used quantitative measures such as TPD, SSS, or SDS.
Initially, separate sex-specific normal limits for change analysis were derived from 40 men and 40 women to mirror the separate stress and rest normal limits. Female and male limits were found to be the same for the stress–rest change. We have tested the sex-combined normal limits and found that the 2 different approaches (separate sex-specific and combined sexes) resulted in the same AUC (0.94). Therefore, in this study, the analyses were performed on the combined dataset (40 men and 40 women).
Additionally, we developed a new measure, C-TPD, that combined stress–rest changes and stress hypoperfusion measures on a pixel basis. C-TPD appears to be significantly better than standard change, C-SR, TPD, SSS, or SDS in predicting ≥70% coronary artery stenosis. C-TPD yielded significant gains in the sensitivity, accuracy, and AUC over the other measures, without compromising specificity. In addition, it improved the normalcy rate in patients with LLK of CAD.
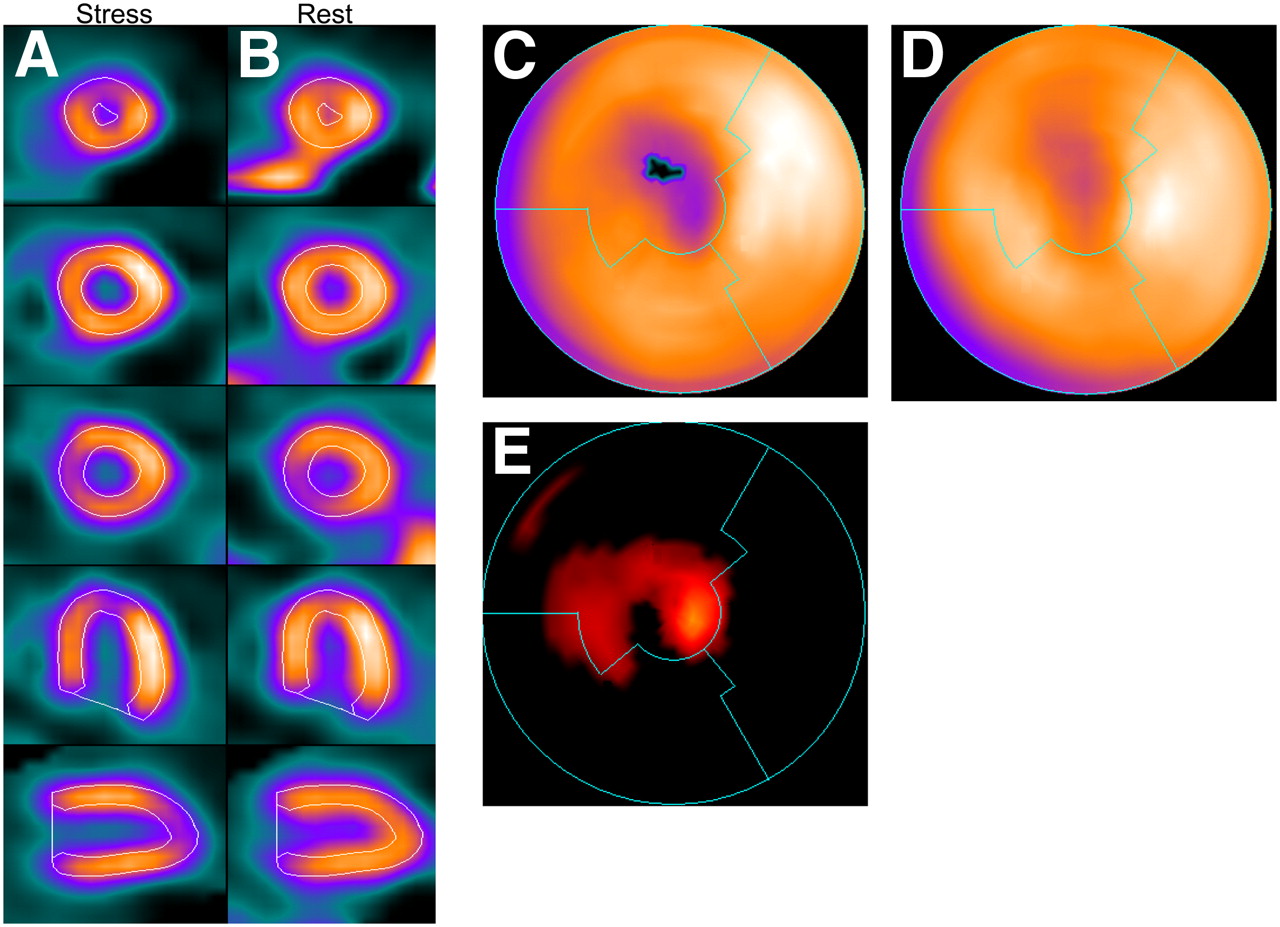
The C-TPD method uses change derived from normal limits when the stress hypoperfusion is less apparent. We gain an improvement in accuracy when replacing the subtle stress hypoperfusion value with change values (Fig. 4). Change values alone may not be sufficient for predicting ≥70% coronary artery stenosis in general because of the possibility of resting defects, for example, in the case of resting ischemia or prior myocardial infarction. As a result, we developed a combined measure using TPD together with change analysis that provides optimal results for the detection of CAD. We found that stress–rest changes are similar in normal male and female studies. Artifacts will usually be present on both stress and rest tomograms, and therefore, in principle, our approach can provide accurate estimation of ischemia, even in the presence of attenuation artifacts and without the use of attenuation-correction hardware (10).

Stress (A) and coregistered rest (B) images with stress contour overlaid on MPS image of 49-y-old woman with single-vessel disease detected by coronary angiography (80% LAD coronary artery stenosis). Polar maps for stress perfusion (C), rest perfusion (D), and normal-limit–based change analysis (E). In this case, TPD was 2.4% (computed within black pixels on stress polar map denoting defect extent), whereas change analysis resulted in value of C-SR of 10%. C-TPD value was 11%.
Excluding patients with a coronary artery bypass graft and prior myocardial infarction allows for the most stringent means of evaluating the accuracy of the detection of CAD by MPS. Because the task is to detect CAD, we selected a group without known CAD. This procedure has been a standard approach in similar studies (5,11). The presence of a severe perfusion defect associated with a myocardial infarct might artificially elevate the sensitivity for detection of CAD in a population in which the question of disease detection is not relevant. In addition, comparisons of different methods within a given institution or between institutions are more valid with these exclusions because the patient populations that include known CAD often vary in their number and their severity.
This study has some limitations. A potentially limiting factor of our proposed technique is that it could not be used when the rest scan was not available or was of unacceptable quality. In addition, the assessment of the severity of the stenosis on angiograms has its own limitations in determining the physiologically significant lesions (12). We have applied established cutoff values to compare a clinically realistic operating point based on balancing the sensitivity with specificity (11). In clinical practice, a specific threshold will need to be applied to classify the patient, and we tried to compare the performance of the new software in that role.
CONCLUSION
We have developed a novel and improved measure for the quantification of ischemia by MPS that uses normal limits of stress–rest change for the detection of CAD. The analysis of the performance of this new measure, compared with standard methods and current quantitative approaches, indicates that this new approach provides improved CAD detection as studied in a large group of patients.
Acknowledgments
This research was supported in part by grant R0HL089765-01 from the National Heart, Lung, and Blood Institute/National Institutes of Health (NHLBI/NIH). PI: Piotr Slomka. Its contents are solely the responsibility of the authors and do not necessarily represent the official views of the NHLBI.
Footnotes
-
COPYRIGHT © 2010 by the Society of Nuclear Medicine, Inc.
References
- Received for publication June 26, 2009.
- Accepted for publication October 26, 2009.


