


Abstract
Assessment of perfusion defect extent is essential for determining prognosis after a myocardial infarction (MI), but quantification methods usually rely on segmental analysis, which may lack accuracy. We present an automated voxel-based and template-based approach for precise quantification of perfusion defect extent and reperfusion evolution. Methods: Coronary angiography and stress/reinjection 201Tl tomography were performed prospectively on 49 patients with recent MI (45 men; mean age ± SD, 54 ± 10 y), before and 3 mo after revascularization (40 angioplasties and 9 bypasses). Perfusion defect extent was quantified using expert 16-segment visual scoring of the slices and a 3-dimensional (3D) method with spatial normalization between times 1 and 2. Briefly, the latter automatically extracted myocardial edges, matched them to a reference template, and compared the perfusion intensity in each voxel with the intensity of the corresponding voxel in a control population of 100 healthy subjects. Results: Reocclusion occurred in 12 patients within 3 mo of surgery (all had undergone angioplasty). The perfusion gain between times 1 and 2, assessed by visual analysis, was significantly higher in permeable patients than in reoccluded patients: 12.4% ± 13.3% and 2.3% ± 8.2% of the initial stress defect, respectively (P = 0.02). Proportional gains, measured with the quantitative 3D method, were 4.5% ± 3.6% and 1.9% ± 2.7%, respectively (P = 0.02). Furthermore, the 3D method allowed measurement within the initial ischemic defect (reversible part of the stress defect at time 1), the extent of myocardium whose perfusion improved at time 2 (reperfusion), and the extent of myocardium whose perfusion remained unchanged (residual ischemia). A voxel-by-voxel analysis of these regions revealed that the proportion of reperfusion was significantly higher in permeable patients than in reoccluded patients: 60.0% ± 21.3% versus 40.0% ± 22.5%, respectively (P = 0.008). This was cumbersome to quantify using visual analysis and did not reach statistical significance, likely because of segmental division (partial-volume effect) and absence of spatial normalization. Conclusion: The 3D voxel-based quantification allows satisfying assessment of reperfusion 3 mo after MI. Moreover, the automated analysis using spatial normalization should facilitate a reproducible assessment of large populations over time.
Myocardial perfusion scintigraphy with 201Tl remains the preferred routine method for the assessment of residual viability after a myocardial infarction (MI) (1). Incremental prognostic information given by this technique is essential because the annual rate of cardiac events is directly proportional to the extent of hypoperfused myocardium (2). Detection of viable myocardium usually leads to a revascularization procedure, which eventually improves the outcome of such patients (3). Furthermore, follow-up of myocardial reperfusion 3–6 mo after revascularization is critical in this setting to detect early restenosis, a complication that may occur in up to 60% of patients (4).
Accurate quantification of perfusion defects is needed to standardize analysis and improve the reproducibility of interpretation. Such quantification has historically been performed by segmental analysis of a 2-dimensional polar map (bull’s-eye map), either visually or by image-processing software (5–7). However, a common limitation of this approach is that it is subject to the partial-volume effect of nontransmural defects: On the one hand, segmental division leads to averaging of voxel intensities, and on the other hand, polar maps obtained from circumferential profiles of myocardial counts lead to overestimation of defect size and underestimation of defect severity (8). In addition, transformation of a 3-dimensional (3D) object into a planar geometry leads to spatial distortions and subsequent reduction of the data, making it difficult to compare perfusion over time; therefore, a suggested approach consists of analyzing individual voxel intensities in a standard reference space (9,10).
In this study, we present an automated template-based software program using geometric and intensity normalization, which ensures that a voxel-by-voxel comparison to a normal database can be used to precisely quantify perfusion defect extent and reperfusion evolution. The automated method is compared with a conventional visual quantification approach before and after revascularization in a population of patients presenting with a first MI.
MATERIALS AND METHODS
Patient Selection
We studied prospectively 49 patients (45 men; mean age ± SD, 54 ± 10 y) who presented with a first MI initially treated by thrombolytic drugs and underwent delayed revascularization between 3 and 4 wk after the acute phase. At onset of symptoms, all participants showed characteristic changes of the ST segment, elevation of creatine kinase-MB isoenzyme, occlusion of the infarct-related artery (left anterior descending artery [n = 29]; right coronary artery [n = 16]; circumflex artery [n = 4]), and left ventricular dysfunction in the infarct site. Patients were followed up for at least 4 mo.
Study Protocol
All patients underwent coronary angiography during the first week of MI (time 0), immediately before delayed revascularization (time 1), and 3–5 mo later for follow-up (time 2). The revascularization procedure consisted of a standard balloon angioplasty of the infarct-related artery (n = 40) or coronary bypass surgery of all accessible arteries showing occlusion or significant stenosis (n = 9). At follow-up, restenosis was defined as the recurrence of a ≥50% luminal narrowing in a coronary segment previously revascularized, whereas a <50% narrowing defined a permeable artery. Patients also underwent stress/reinjection 201Tl perfusion SPECT before the second and third angiographies, that is, immediately before revascularization (time 1) and 3–5 mo after revascularization (time 2). Medical treatment (aspirin, β-blockers, and, when needed, angiotensin-converting enzyme inhibitors) was provided within the first week after infarction and maintained at the same dosage during the entire study. The study protocol was approved by our Institutional Review Board, and all participants gave informed consent.
SPECT Procedure
After 48-h interruption of β-blockers, a stress test was performed either by bicycle exercise using a modified Bruce protocol (n = 32) or by intravenous infusion of 0.56 mg of dipyridamole per kilogram of body weight (n = 17). An activity of 111 MBq of 201Tl per 60 kg of body weight was injected at peak exercise, and 4 h later patients were reinjected at rest with 37 MBq of 201Tl per 60 kg. Tomograms were acquired 10 min later using a single-head SP6 γ-camera (ELGEMS) equipped with a low-energy, all-purpose collimator. Thirty 30-s projections were recorded in 64 × 64 matrices at stress and at reinjection. Raw data were reconstructed by filtered backprojection (Hamming/Hann filter; cutoff, 0.35 cycles/pixel).
Visual Analysis of Tomograms
After reorientation of the reconstructed volumes in the 3 usual planes, perfusion defect extent was measured by a consensus of 2 observers using a 16-segment model (Fig. 1) and 4-point scoring (0 = no uptake, 1 = severe defect, 2 = moderate defect, and 3 = normal uptake). Expressing the perfusion scores P within each segment k, a global hypoperfusion index was calculated at stress and at rest, at time 1 and at time 2, using the following formula (percentage of maximal normal perfusion):


Schematics of 16-segment model used for visual scoring and segmental division of 3D myocardial template. HLA = horizontal long axis; VLA = vertical long axis.
Perfusion gains and losses over time were defined simply as the difference between the hypoperfusion indices calculated at time 1 and at time 2. These measures gave a global estimate of sequential perfusion evolution at stress and at rest. In addition, a reperfusion index was calculated to assess, more specifically, the efficacy of the revascularization procedure. An ischemic area was isolated on the first SPECT scan, which gathered all segments in which the rest score was at least 1 point superior to the stress score (number of reversible segments, kISCH). Perfusion improvement in these particular segments was measured on the second SPECT scan as the number of segments in which the stress score (Pstress2) was at least 1 point higher than the initial stress score at time 1 (Pstress1), using the following formula (percentage of the ischemic area on the first SPECT scan):

Quantitative 3D Analysis of Tomograms
A recently developed automatic software program, MPS-Quant (Quantificare S.A.), was used to quantify perfusion defect extent and its temporal evolution between times 1 and 2. The following image-processing steps were necessary to obtain a global hypoperfusion index and a reperfusion index comparable to those calculated by visual analysis:
Automatic Reorientation.
Reconstructed volumes were reoriented into a standard short-axis set of slices using the following automated algorithm: Anatomic prior knowledge incorporating average heart position and orientation was used to obtain a preliminary short-axis set. An estimated long-axis centerline was then approximated using a 2-dimensional difference-of-gaussians matched filter on each short-axis slice. Next, an ellipsoidal model that incorporated a priori constraints for heart size and wall thickness was fit to the image data and estimated long-axis centerline. In a few cases, brief manual intervention was required to initialize the software to a correct approximate location of the left ventricle.
Template Matching.
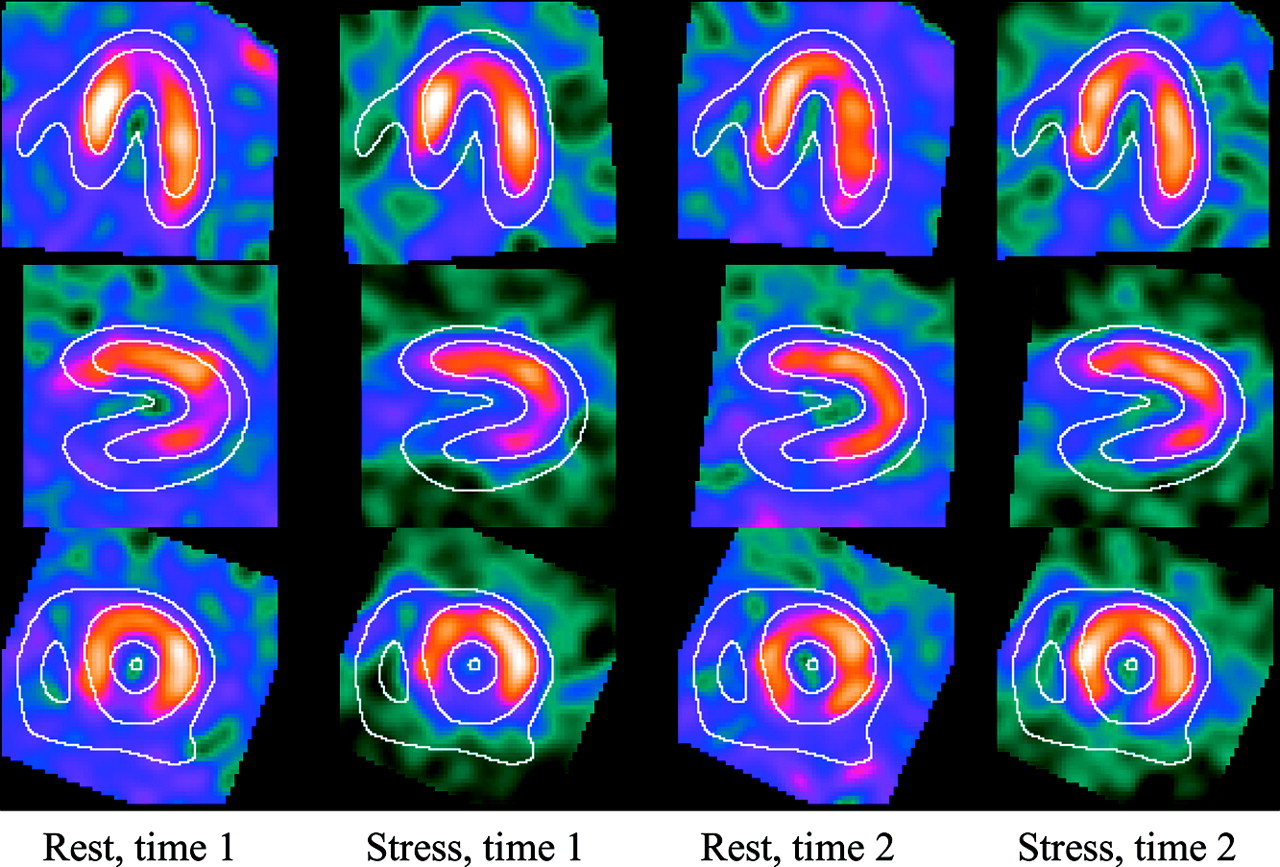
Myocardial volumes were spatially normalized to a 3D template. Edge detection using a Canny-Deriche recursive filter (11) and a 3D polar sampling geometry was applied along with an iterated closed-point algorithm to optimize the coregistration parameters (9,10). The algorithm was constrained to 7 degrees of freedom: 3 translations and 3 rotations allowing a rigid-body transformation plus a single global scaling factor to best match the size of each heart to the template (Figs. 2 and 3A).

Example of image display allowing visual quality control of automated registration of serial image volumes under MPS-Quant (Quantificare S.A.).

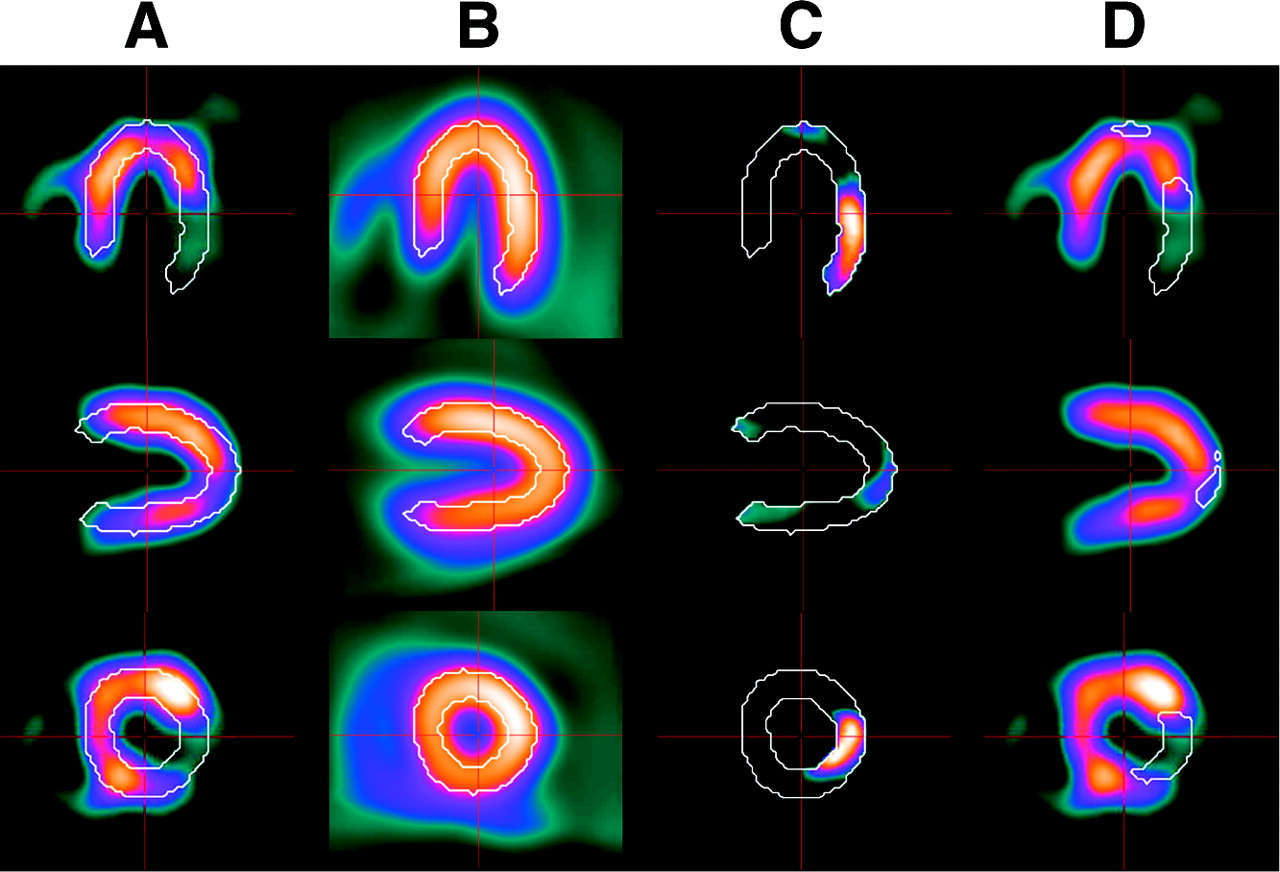
Representation of the key steps needed for calculation of deficit load. (A) Patient’s image volume (stress 1) is matched to reference template (white overlay). All voxels with an intensity ≤ 1.8 SDs of the corresponding value from the normal population model (B) are considered hypoperfused (C) and allow the determination of an SDR mask (D, white overlay), within which all further calculations will be performed.
Normal Model.
The template was derived from a population model obtained using a mixed dataset of 201Tl and 99mTc-sestamibi scans of 100 healthy volunteers of both sexes (Fig. 3B). A bootstrap approach was used to build the template. First, a single image volume from the 100-control set was manually aligned into a standard short-axis orientation and used as a reference for automated alignment of all other volumes. Then, all coregistered volumes were summed to form an averaged volume. The automated process was performed once again, this time using the averaged volume as the reference. Finally, the resulting set of coregistered images was summed to produce an image volume representing the mean normalized left ventricular perfusion intensity as well as an image volume representing the SD for the population model. Template size was 64 × 64 × 64 voxels with 2.6 × 2.6 × 2.6 mm voxels.
Intensity Normalization.
Once registered to the template, myocardial volumes were segmented so that all voxels outside the template outlines were set to a zero value. This process limited subsequent calculations to image voxels representing the left myocardium and reduced the effect of hot-spot artifacts. Within this template mask, it was assumed that the subset of voxels with the 20% highest intensity represented normal myocardial tissue. Linear regression between the registered-voxel-value pairs from this subset in the image volume being normalized and from the normal model was used to define an affine intensity transformation that was applied to normalize image voxel intensity.
Perfusion Defect Analysis.
A significant defect region (SDR mask) (Figs. 3C and 3D) was first defined as a region in which the intensity of all voxels was at least 1.8 SDs lower than the corresponding mean value from the healthy population. This threshold of 1.8 SDs was determined empirically and used with success in a previous work (12). A minimal size for the SDR mask could also be specified, but in the present study, this constraint was not used. Expressing ni and pi as, respectively, the number of voxels in the healthy population and the number of voxels in the patient being evaluated, the hypoperfusion index was calculated at stress and at rest, at time 1 and at time 2, using the following formula (percentage of the total template perfusion):

This measure expresses the summed difference between the mean population model for voxels within the SDR mask at stress 1, normalized by the sum of all template voxels. Note that this approach differs from traditional calculations of global measures, such as the visual semiquantitative technique described here or the summed stress score described by Hachamovitch (13), which compute values over the entire myocardium. To emphasize the difference between the global and SDR mask-based approaches, the hypoperfusion index computed via computer calculations over the SDR mask is termed the deficit load.
Another approach was therefore investigated to obtain quantified segmental values similar to those of the visual analysis. A 16-segment volume of interest (VOI) was defined over the 3D template to match the same segments used in the visual analysis (Fig. 1). Calculation of the mean voxel intensity within each VOI in the template therefore gave the segmental scores of normality in the population model. To obtain automated standardized segmental scores for the 4 datasets from each patient, mean segmental values were computed using same VOIs after the images had been spatially registered and intensity normalized to the template. Expressing the mean voxel intensity for segment k in the normal population model as Nk and the mean voxel intensity for segment k in the patient image as Pk, the global hypoperfusion index could then be defined as (percentage of maximal normal perfusion):

Perfusion gains and losses over time were assessed at stress and at rest, as for the visual analysis. For the automated segmental approach, they were defined simply as the difference between the hypoperfusion indices calculated at times 1 and 2. For the deficit-load measure, a slightly different approach was taken because all calculations were performed within the same SDR mask computed from the stress image at time 1 (Figs. 3C and 3D), that is, before revascularization, when the MI perfusion defect was supposed to be the largest. This mask was used as a reference VOI in the deficit load calculation for all 4 sets of data for each subject, to obtain higher reproducibility (12). The difference between these deficit loads was defined as the perfusion gain. Ultimately, a reperfusion index was calculated as the fraction of the reversible area at time 1 (ischemic area, ISCH) that was reperfused at time 2. Reversible area at time 1 was defined as the sum of voxels within the SDR mask at stress 1, where the normalized intensity in the rest image was >0.5 SD different from the value obtained at stress. This threshold of 0.5 SD was determined empirically and used with success in a previous work (12). The reperfusion index was then defined as all reversible voxels that achieved a difference between the stress and rest values at time 2 (stress2 and rest2, respectively) that was less than half the difference between the stress and rest values at time 1 (stress1 and rest1) (percentage of the ischemic area on the first SPECT scan):

Statistical Analysis
Hypoperfusion indices obtained from the 3D quantitative method were compared with the visual reference method using a paired Student t test, linear regression, and Bland-Altman analysis (14) for the 4 sets of data (stress and rest, at times 1 and 2). Angiographically documented patient groups (permeable group and reoccluded group) were compared using an unpaired Student t test, and receiver-operating characteristic (ROC) curves were produced to determine the best reperfusion index threshold for separating groups. Analyses were performed with StatView 5.0 (SAS Institute Inc.), and a P value < 0.05 expressed significance.
RESULTS
Comparison Between Voxel-Based and Segment-Based Hypoperfusion Indices
Hypoperfusion indices calculated at stress and at rest, at time 1 and at time 2, are given in Table 1. Compared with the visual segmental analysis (reference), voxel-based deficit loads correlated fairly well (r ≥ 0.80) for all 4 sets of data, although the absolute values were lower. As seen in the regression plot of Figure 4A, the deficit loads were approximately 40% the values of the visual segmental index. Moreover, a Bland-Altman analysis (Fig. 4B) showed that more than a simple scaling existed between visual scoring and deficit load: As perfusion severity increased, the visual grade tended to be higher than the corresponding computed deficit load, and mild perfusion defects appeared to be somewhat compressed using the visual scale. Use of an automated segmental approach resulted in slightly higher hypoperfusion indices, compared with deficit load, but at the cost of lower regression coefficients.
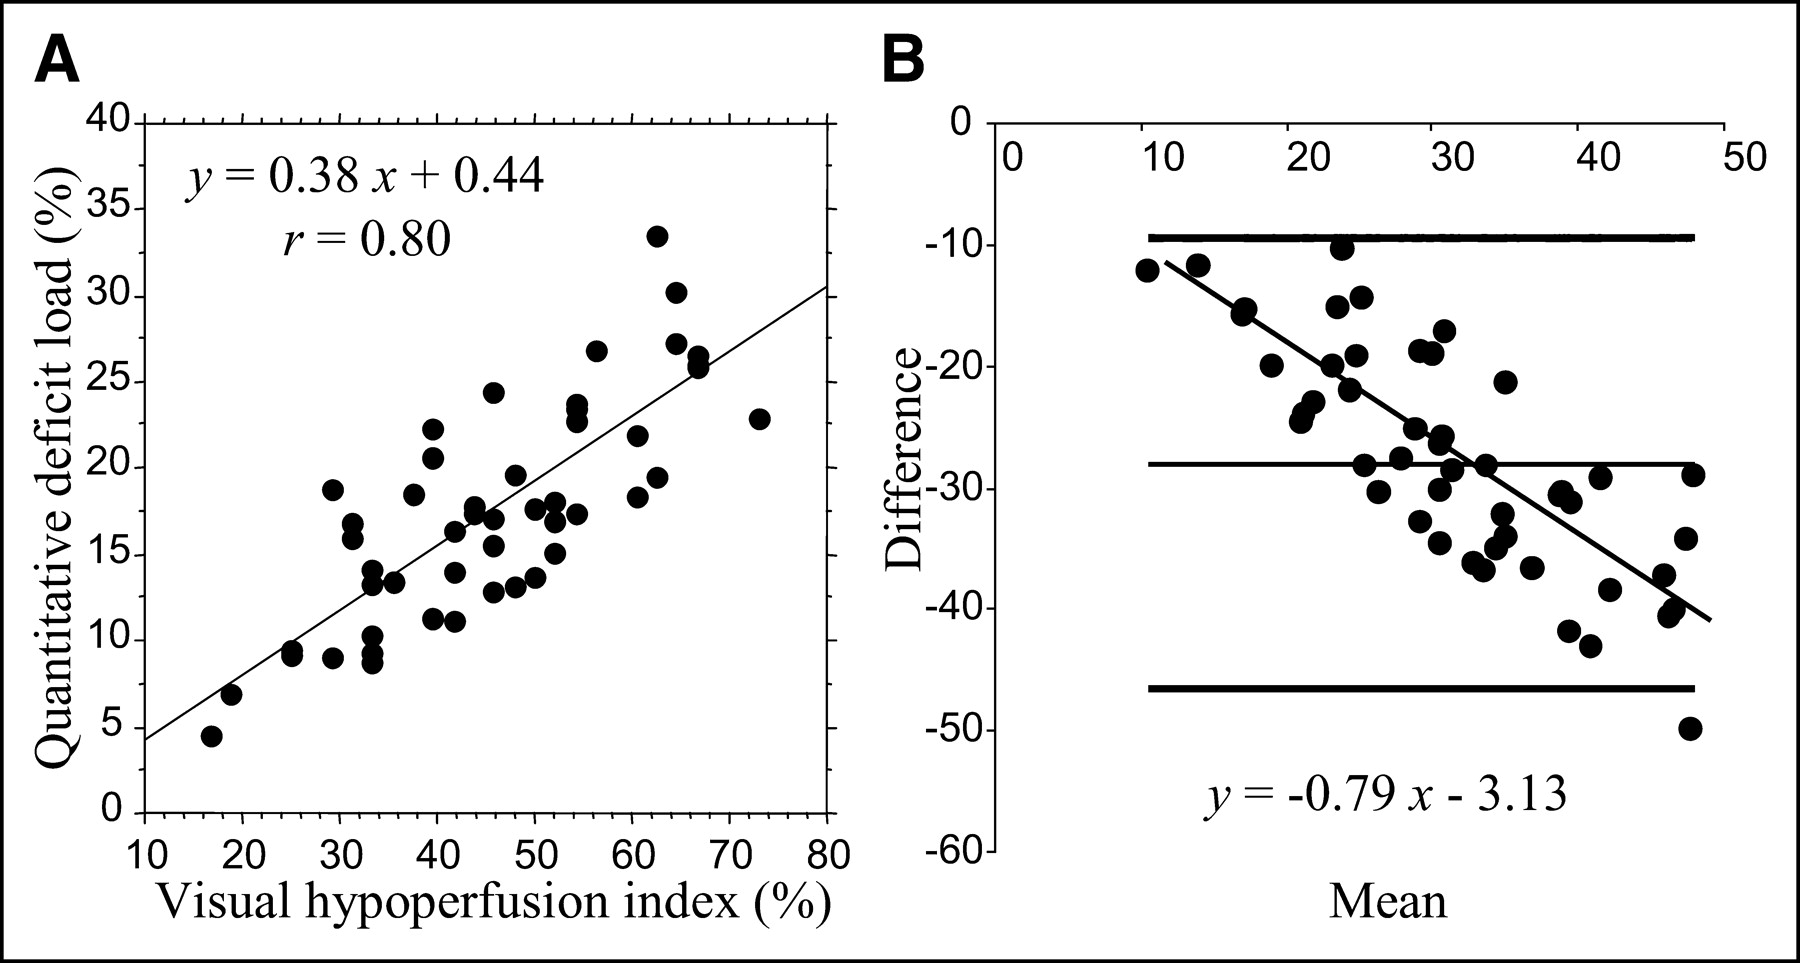
Comparison between hypoperfusion indices calculated by visual segmental scoring and 3D quantitative approach, for stress acquisition at time 1: linear regression (A) and Bland-Altman analysis (B).
Comparison of Hypoperfusion Indices Between Stress and Rest and Between Time 1 and Time 2 for 3 Methods of Measure
Comparison Between Voxel-Based and Segment-Based Perfusion Gains After Revascularization
Reocclusion occurred in 12 patients within 3 mo of surgery (all were patients who had undergone angioplasty). Table 2 shows that voxel-based and visual segmental measures can distinguish the permeable from the reoccluded patient groups with similar levels of significance in the stress data. Differences between the patient groups were harder to detect in the rest data, where the perfusion gains were smaller. A trend indicating that the permeable group showed higher rest perfusion gains was seen using the visual method (P = 0.10), but only the voxel-based measure was able to reach statistical significance (P = 0.03). Use of the automated segmental approach did not improve separation of groups at rest.
Perfusion Gains for Permeable and Reoccluded Patient Groups Calculated Using Visual Analysis, Deficit Load, and Automated Segmental Analysis
Comparison Between Voxel-Based and Segment-Based Reperfusion Indices
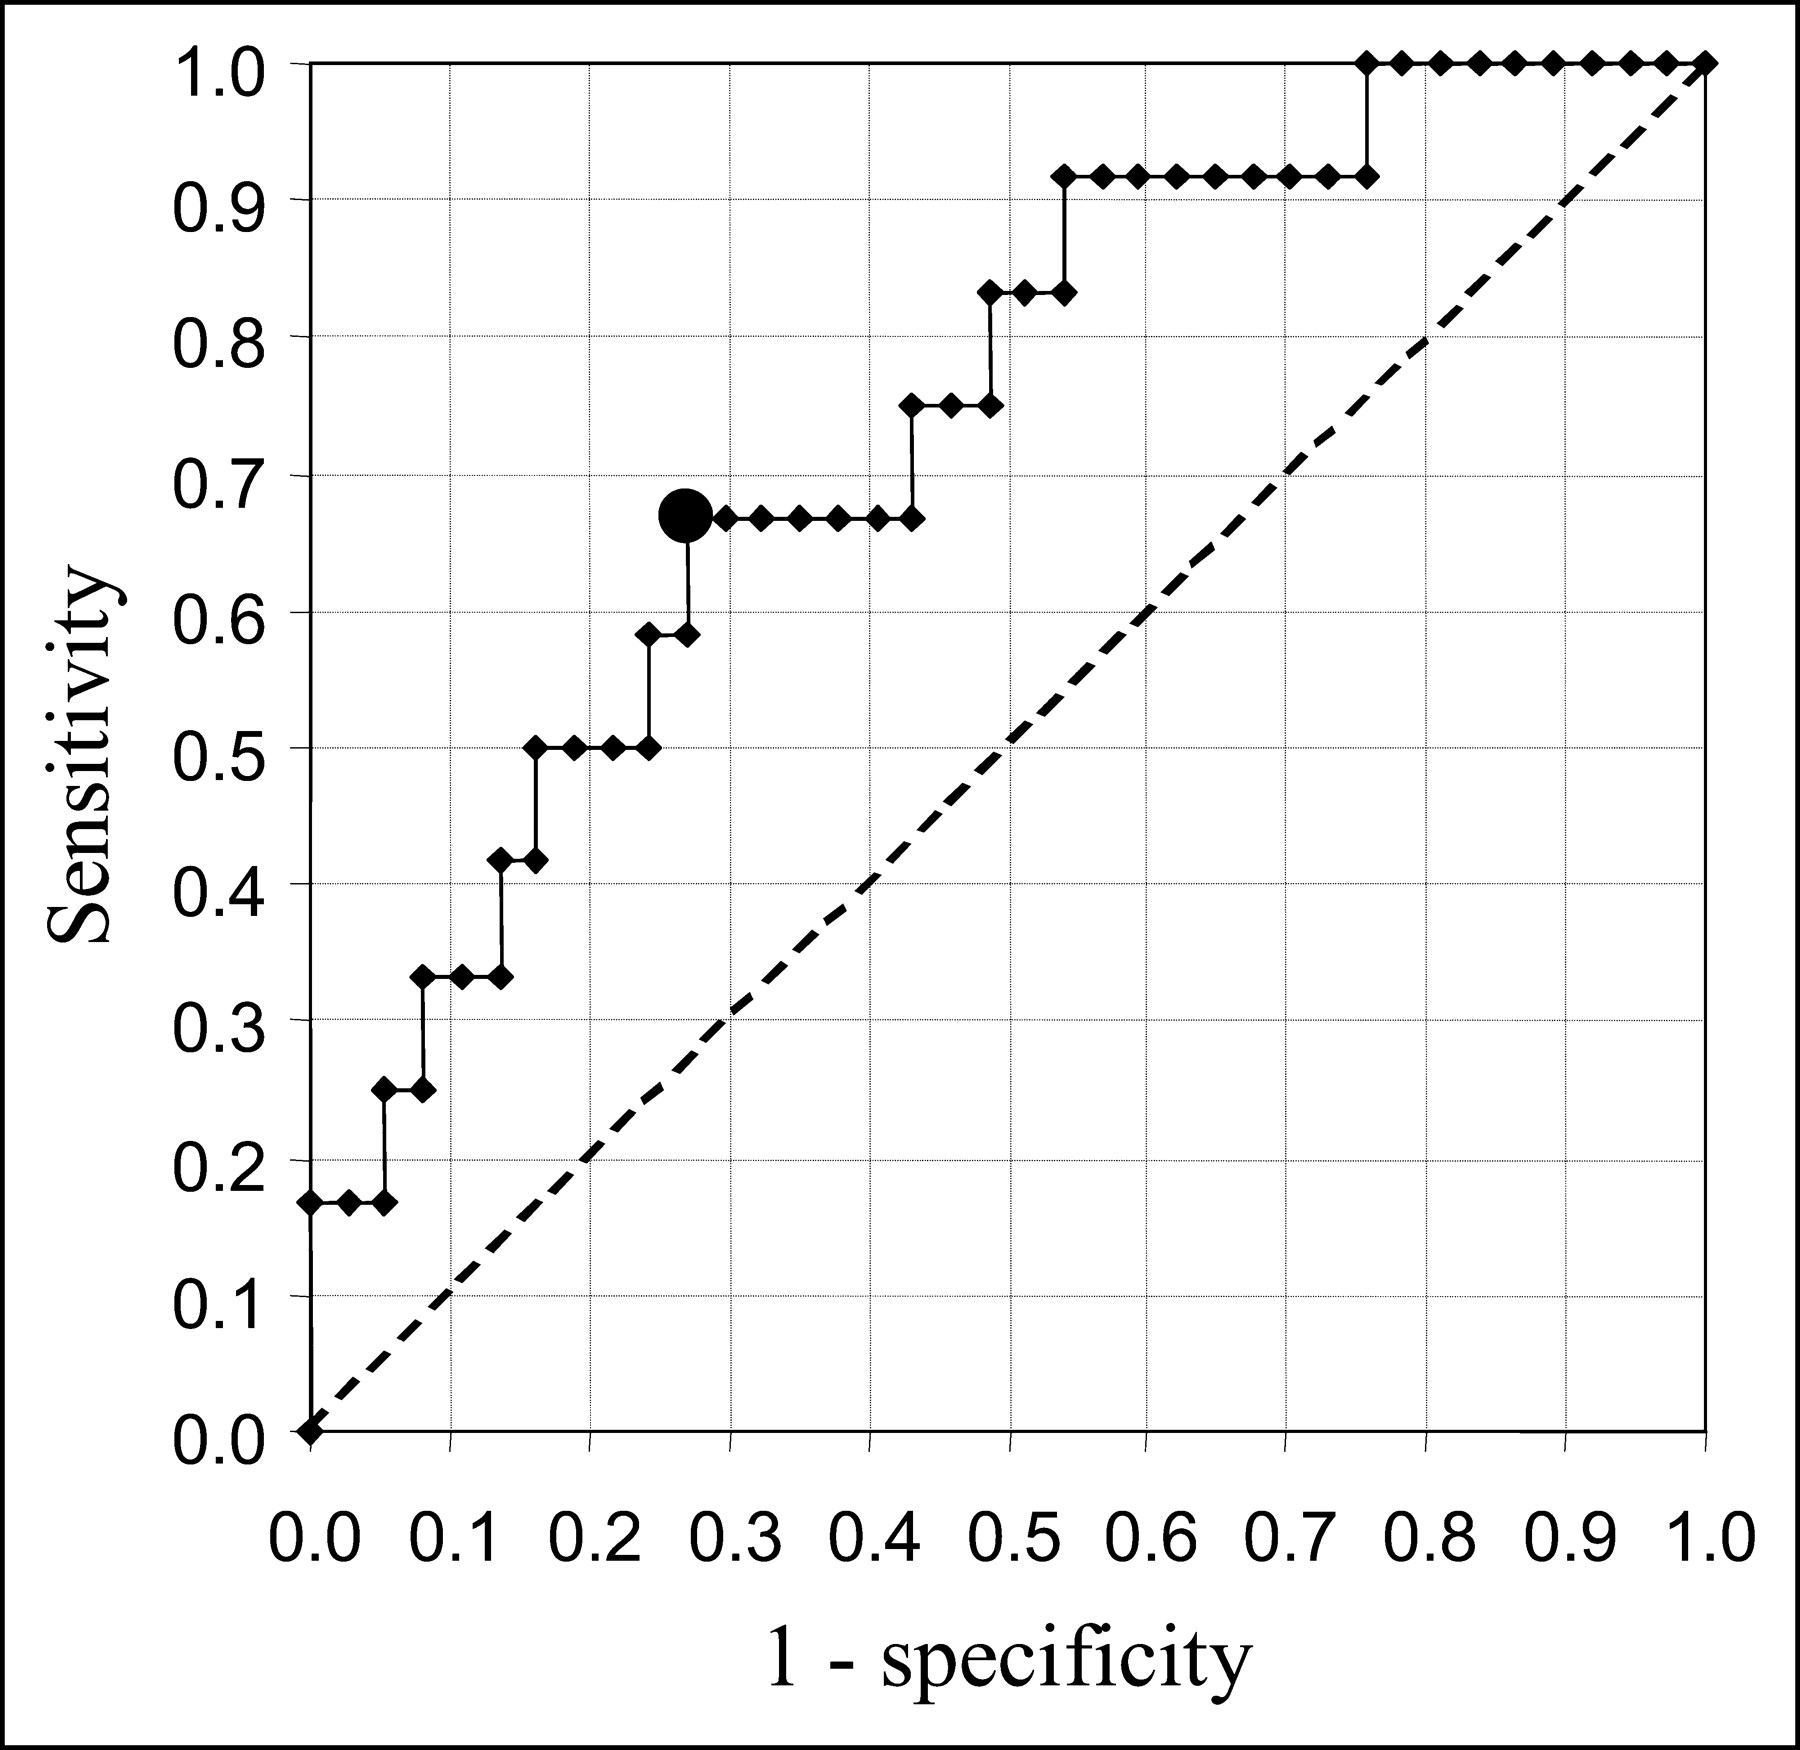
Interestingly, the voxel-based method was also the only technique able to separate the 2 patient groups when assessing precise reperfusion within the initial ischemic defect (extent of myocardium whose perfusion improved at time 2 within the reversible part of the stress defect at time 1; Table 3). Indeed, voxel-by-voxel analysis of these small regions showed that the proportion of reversible tissue that was reperfused was significantly higher in the permeable patients than in the reoccluded patients (60.0% ± 21.3% vs. 40.0% ± 22.5%, respectively, P = 0.008). In addition, an ROC curve analysis revealed that a reperfusion index threshold of 51.7% was able to distinguish permeable from reoccluded patients with a sensitivity of 67% and a specificity of 73% (Fig. 5). When visual segmental analysis was used, a similar trend was seen, but it did not come close to reaching statistical significance. Apparently, the effect of grouping image data into large spatial segments and discrete scoring levels during visual analysis made it difficult to accurately assess small changes such as these.

ROC curve obtained by varying the voxelized reperfusion index threshold to separate permeable from reoccluded patients. The best sensitivity/specificity compromise, shown at the heavy point, corresponds to a reperfusion index of 51.7%.
Reperfusion Indices for Permeable and Reoccluded Patient Groups Calculated Using Visual Analysis and Quantitative 3D Method
Automated Registration to 3D Template
The success rate for automated short-axis reorientation and subsequent registration of each image volume to the template was evaluated visually. A user interface presented a template edge map overlaying 3 standard views of each of the 4 image volumes and allowed rapid visual assessment of registration accuracy (Fig. 2). For these data, 169 (86%) of 196 image volumes were registered successfully without any manual intervention. For the remaining cases, brief manual intervention was required to initialize the starting search position used by the software. Most generally, automated registration failure could be attributed to large myocardial defects combined with areas of high hepatic or intestinal uptake. This accuracy was somewhat lower than the success rate reported by Germano et al., 95%–98%, for 201Tl images (15,16). However, because the patients in this work represented a population with greater perfusion defects, the registration accuracy is likely comparable.
DISCUSSION
The present study evaluated a new approach for the quantification of MI perfusion defect extent and reperfusion evolution after revascularization. We found that the automated 3D template-based approach of MPS-Quant, which relies on direct voxel-by-voxel comparison of counts in patients with counts in a healthy population, produced a measure of hypoperfusion that correlated fairly well with conventional segmental visual analysis. However, values obtained with this quantitative method differed from those obtained using the visual reference. More important, from the standpoint of the ability to assess perfusion changes over time, the 3D quantitative method was able to demonstrate performance superior to that of visual grading for assessing response to therapy.
Most likely, the differing of hypoperfusion indices calculated with the 3D quantitative approach stems from 3 effects. This method first computes intensity differences in only a subset of the myocardial volume (the SDR mask) and then normalizes by the entire template volume, whereas the visual method computes these differences over the entire myocardium. Second, the relationship between the hypoperfusion indices and the perfusion intensity differences is linear using the 3D method, whereas a visual grader appears to rely on an internal nonlinear criterion for assessing severity grades, as noted by Verberne et al. (17), who worked on a similar 3D matching technique (18). Indeed, for small perfusion defects, image segments are more likely to be graded as normal, whereas for proportionally larger deficits, the grader is more likely to assign a very severe score. Third, the 3D method takes into account the background noise present outside the myocardium (estimated 20%–30% of the maximum in our experience with 201Tl), whereas the visual grader will assign a score of 0 to a segment showing uptake similar to the background noise. To our knowledge, background correction is proposed in only one commercial software program, developed by Benoit et al. (8). In the present study, we did not subtract the background noise because it would have been eliminated anyway when the differences between time 1 and time 2 (reperfusion indices) were computed. In addition, no consensus exists on the optimal method for background determination: A midcavity region would be variably affected by scatter, depending on cavity size, and a paraventricular region would be variably affected by pulmonary or intestinal 201Tl uptake.
The use of a segmental approach with the quantitative 3D method did solve the problem partially, by giving slightly higher values of hypoperfusion indices, but at the cost of lower regression coefficients. Another solution would be to calibrate the quantitative results to the visual grading, as proposed in other commercial packages such as MyoQuant (General Electric) (8) and QPS (Quantitative Perfusion SPECT; Cedars-Sinai Medical Center) (16). Indeed, both methods use a segmental division of the myocardium and calibrate the automatically generated scores to visual semiquantitative results obtained in their laboratories in order to best replicate human visual scoring. We have already seen that this approach is questionable since the linear properties inherent in quantitative software are not directly proportional to the nonlinear process used in human visual grading (17). In addition, for following and quantifying myocardial disease evolution with the highest sensitivity via perfusion imaging, exact matching to human visual grading is not necessarily the most important criterion. Indeed, as was seen in the ability to distinguish permeable from reoccluded rest data, it may be preferable to use a method with a slightly different mechanism from that used by a human visual grader.
By contrast, comparisons of the deficit load and the automated 16-segment model showed that a voxel-by-voxel analysis better assesses perfusion gains in the rest data than does segmental analysis (Table 2). Both methods relied on the same set of spatially registered, intensity-normalized images and were compared with the same mean and SD volumes from the population model. However, only the deficit load measure was able to detect significant differences between patient groups in the rest data, suggesting that the partial-volume effect in a segmental analysis, as well as the use of a global rather than local region of evaluation, can reduce the available image information indicating a true difference.
The 3D template-based method using the deficit load measure offers several important differences from conventional visual grading and automated grading using a segmental model. First, since the method is completely automated except for a small fraction of cases in which the heart must be manually located, reproducibility is improved and requirements for user training are significantly reduced. Second, comparisons based on voxels rather than large segments allow detection and characterization of relatively small changes over time. Likewise, the use of a 256-level gray scale instead of a 4-level grading scheme reduces the coarseness of grading and, when used with proper intensity normalization and spatial registration, can lead to increased sensitivity. Finally, defining the same area of interest (the SDR mask at stress 1) for all time points rather than summing all measures into a global quantity ensures that comparative measurements are based on the same myocardial region.
This study used restenosis evaluation via coronary angiography data to distinguish permeable from reoccluded patient groups and compared the current interpretive reference for SPECT with a new automated technique based on a 3D population model and a voxel-based analysis. One might consider the use of visual scoring as the reference to be a study limitation: In fact, visual scoring is appropriate because it represents the mental process of SPECT interpretation, which includes the interpreter’s experience that the significance of a perfusion defect depends on its location (low yield if inferior) and the implicit reference to normal perfusion distribution. This process is not captured in the mean and SDs of a 3D template produced from a healthy population.
Other factors limit the 3D template-based sensitivity and accuracy. The current population model was not sex matched, was defined using various cameras and a mixture of 201Tl and 99mTc-sestamibi scans, and consisted of Americans whereas the patients included in this study were European. The reason for using such a mixture was essentially to allow application of MPS-Quant in the setting of dual-isotope protocols. In a recent study, Slomka et al. proposed using the patient as his or her own reference to calculate stress-rest changes (19). This approach has demonstrated high accuracy in detecting coronary stenosis, but the authors admit that it might not be suitable for assessment of fixed MI perfusion defects. In fact, our template is used mostly to ensure standard reorientation and shape (spatial normalization), but stress-rest changes could easily be calculated by simple subtraction within the SDR mask, without referring to the perfusion mean and SD of the healthy model. Furthermore, to provide robust 3D registration to the template model for all subjects, the matching was limited to rigid-body motion and a single global scaling parameter. Because the ratio of ventricular long-axis length to width is known to vary considerably in a diseased patient population, small registration errors that smeared definition of SDR masks were likely present.
Given these limitations, it is noteworthy that the quantitative 3D method was able to perform as well as or better than visual reading in distinguishing changes of myocardial perfusion indicators. Perhaps one reason is that during the evaluation of deficit load, the exact definition of defect is not nearly as important as is the change over time within this area at risk. By using a reasonable criterion to identify an interesting region over which to evaluate perfusion change, and by using the same region over registered datasets at different times, the automated method gains its greatest advantage over traditional segment-based approaches.
CONCLUSION
Voxel-based and template-based quantification allows satisfying assessment of reperfusion 3 mo after an MI. The highly significant difference found between permeable and reoccluded patient groups using the criteria of perfusion gain and voxel-based reperfusion index indicate that incremental measures such as these may be more prone to detecting small differences than are global measures of perfusion. Such evaluation of the degree of reperfusion within a previously defined defect region on serial scans could be an extremely useful measure of the efficacy of various surgical or drug therapies. Furthermore, the template-based approach could be useful for evaluating large series of patients and building customized patient models to assess specific pathologies.
Footnotes
Received Mar. 18, 2004; revision accepted Jul. 15, 2004.
For correspondence or reprints contact: Emmanuel Itti, MD, Service de Médecine Nucléaire, CHU Henri Mondor, 51 Avenue du Maréchal de Lattre de Tassigny, 94010 Créteil, France.
E-mail: eitti{at}wanadoo.fr


