


Abstract
Changes in myocardial wall motion and thickening during myocardial perfusion SPECT are typically assessed separately from gated studies for the presence of stress-induced functional abnormalities. We sought to develop and validate a novel approach for automatic quantification of rest–stress myocardial motion and thickening changes (MTCs). Methods: Endocardial surfaces at the end-diastolic and end-systolic frames for rest–stress studies were registered automatically to each other by matching ventricular surfaces. Myocardial MTCs were computed, and normal limits of change were determined as the mean and SD for each polar sample. Normal limits were used to quantify the MTCs for each map, and the accumulated sample values were used for abnormality assessments in segmental regions. A hybrid method was devised by combining the total perfusion deficit (TPD) and MTC for each vessel territory. Normal limits were obtained from 100 subjects with low likelihood of coronary artery disease. For validation, 623 subjects with correlating invasive angiography were studied. All subjects underwent a rest–stress 99mTc-sestamibi exercise or adenosine test and coronary angiography within 3 months of myocardial perfusion SPECT. All MTC and TPD measurements were derived automatically. The diagnostic accuracy for detection of coronary artery disease for MTC plus TPD was compared with TPD alone. Results: Segmental normal values were between −1.3 and −4.1 mm for motion change and between −30.1% and −9.8% for thickening change. MTC combined with TPD achieved 61% sensitivity for 3-vessel-disease (3VD), 63% for 2-vessel-disease (2VD), and 90% for 1-vessel-disease (1VD) detection, compared with 32% for 3VD (P < 0.0001), 53% for 2VD (P < 0.001), and 90% for 1VD (P = 1.0) detection using the TPD-alone method. The specificity for the combined method was 71% for 3VD, 72% for 2VD, and 47% for 1VD detection versus 90% for 3VD (P < 0.0001), 80% for 2VD (P < 0.001), and 50% for 1VD detection (P = 0.0625) for the TPD-alone method. The accuracy of 3VD detection by MTC plus TPD was higher (69%) than the accuracy of TPD plus change in ejection fraction (63%) (P < 0.004). Conclusion: We established normal limits and a novel method for computation of regional functional changes between the rest and poststress studies. Compared with TPD alone, the combination of TPD with MTC improved the sensitivity for the detection of 3VD and 2VD.
Myocardial perfusion SPECT (MPS) is the most widely used diagnostic test for the detection of coronary artery disease (CAD) (1,2). Abnormalities in myocardial perfusion and function during stress, which were not present during rest study, often signify impaired perfusion reserve and are strong markers for the existence of high-grade stenosis and ischemia. Traditionally, global perfusion measures such as summed stress scores and summed rest scores (3), total perfusion deficit (TPD) (4), or summed rest–stress perfusion changes (5) have been used for the detection of CAD. However, certain conditions such as severe CAD in patients with 3-vessel disease (3VD) pose technical and diagnostic challenges (5,6). Additional functional data, such as measurements of ejection fraction (EF) and its changes between the rest and poststress studies, can be used to improve the detection of CAD (7).
It has previously been shown that reversible regional wall motion abnormality (RWMA) after stress, which was not present during rest, is a strong predictor of angiographic severity and adds incremental value to the perfusion data in the assessment of severity (8,9). The standard method of analysis for motion and thickening, however, may suffer from variability in contour placements when subtle changes in motion and thickening are being evaluated. We aimed to evaluate quantitatively regional myocardial motion and thickening changes (MTC) between the rest and poststress studies using a novel myocardial surface registration method. Furthermore, we investigated whether these derived functional measurements provide any incremental improvement for diagnosis of multivessel coronary disease, as compared with information provided by perfusion data alone.
MATERIALS AND METHODS
Patient Population
This was a retrospective cohort study, and all the cases were selected consecutively. Approval from the Institutional Review Board was obtained for anonymous review of the data. The total study population consisted of 723 patients who underwent exercise or adenosine stress 99mTc-sestamibi MPS. The studies were performed using standard 99mTc-sestamibi rest–stress protocols. We established normal limits from a group of 100 patients (70 women, 30 men) with a low likelihood (LLK) of CAD (<5%) (training group) who were selected consecutively on the basis of age, sex, pretest symptoms, and electrocardiogram response to adequate treadmill stress testing. The selection of these healthy subjects was based on the Diamond and Forrester criteria (10). Angiographic validation was obtained using 623 consecutive patients (353 men, 270 women) who had coronary angiography within 3 months of MPS. Exclusion criteria were as follows: prior myocardial infarction or coronary revascularization, nonischemic cardiomyopathy or vascular heart disease, and change in symptoms between MPS and coronary angiography. The angiographic population consisted of 176 cases of 0-vessel, 197 cases of 1-vessel (1VD), 141 cases of 2-vessel (2VD), and 109 cases of 3VD CAD (CAD group). All 623 patients in this group underwent coronary angiography tests within 3 months of their SPECT scans, and none of the patients had any cardiac events during this period. The results of angiography were treated as the gold standard for validation of other methods. Most of the training group underwent 8-bin gated SPECT studies (98 of 100 patients). The SPECT data constituting the CAD group were a mixture of 8- and 16-bin gated SPECT. For the stress studies, the patients underwent only exercise SPECT in the LLK groups; however, 417 of 623 patients in the CAD group underwent adenosine SPECT. The detailed baseline characteristics for the LLK and CAD groups are summarized in Table 1.
Study Group Populations and Data Acquisition Characteristics
Statistical Analysis
Continuous variables were expressed as the mean ± SD, and categoric variables were expressed as percentages. Comparisons of sensitivity and specificity between groups were made using the McNemar's test. For all analyses, P values less than 0.05 were considered statistically significant.
Image Acquisition and Reconstruction and Left Ventricular Segmentation
The details of image acquisition and tomographic reconstruction have been previously described (11–13). In brief, studies were performed using standard 99mTc-sestamibi rest–stress protocols. All subjects were imaged at 60 min after the administration of 99mTc-sestamibi at rest, followed by stress images taken at 15–45 min after either radiopharmaceutical injection during treadmill testing or adenosine infusion with low-level exercise. Data were acquired on a Vertex dual-detector scintillation camera with low-energy high-resolution collimators (Philips). Vantage Pro attenuation-correction (Philips) transmission images were also collected but were not used for the reconstruction of the gated data or any analysis in this study. The system SPECT resolution for this type of camera with high-resolution collimators and filtered backprojection reconstruction is approximately 10 mm.
Tomographic reconstruction was performed using AutoSPECT (Philips) for both gated and ungated studies. Projection data were aligned to the reconstruction matrix to determine the mechanical center of rotation. Butterworth filters were applied to obtain the noncorrected MPS with an order of 10 and cutoff of 0.50 for rest MPS and an order of 5 and cutoff of 0.66 for stress MPS. The short-axis reconstruction angles were automatically determined by the software.
Quality control was performed on all gated images, including the review of the electrocardiogram rhythm strip to exclude any significant arrhythmia; visual review of the cine gated images, with special emphasis placed on end-diastolic (ED) images; and review of the time–volume curve. Contours were automatically extracted with a quantitative gated SPECT (QGS) algorithm, as previously described (14), separately for rest and poststress gated short-axis images and also for rest and poststress perfusion images for the calculation of TPD. The automatically extracted contours were verified by an expert technologist, with manual adjustment needed in approximately 25% of the angiographic cases and 12% of LLK cases. All further image processing tasks, including quantification of perfusion and TPD, were performed automatically and were incorporated into the software tool for cardiac quantification developed at our institution (15)
Conventional Coronary Angiography
Conventional coronary angiography was performed according to standard clinical protocols within 3 months of the myocardial perfusion examination. All coronary angiograms were visually interpreted by an experienced cardiologist. A stenosis of 50% or greater narrowing of luminal diameter of the left main or 70% or greater narrowing of the other vessels was considered significant and was used as the gold standard for the detection of CAD.
Myocardial Surface Registration
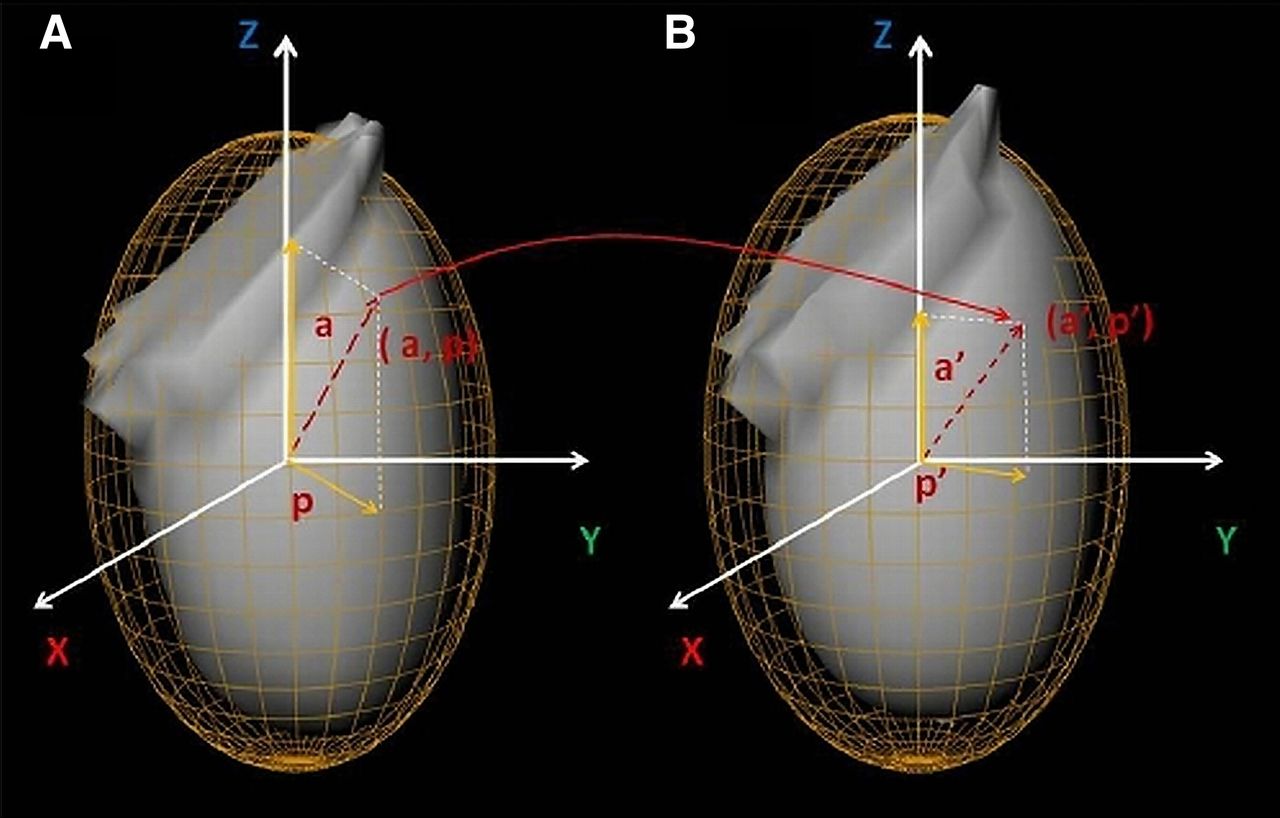
For representation of myocardial surface points, the best ellipsoid fit was used for left ventricle segmentation (Fig. 1) (14). Segmentations of myocardium by best ellipsoid fits are performed independently at ED and end-systolic (ES) frames (possibly leading to a disparity between the actual physical locations) on the 2 surfaces. Therefore, a point represented by (a, p) coordinates on the ED ellipsoid may actually map onto different (a′, p′) coordinates on the ES ellipsoid, as shown in Figure 1. Attempts at resolving this registration problem involve several practical challenges. Myocardium appears brighter on the ES image than on the ED image because of myocardial wall thickening at ES and the partial-volume effect. To address this problem, we normalized each image data to its 85% maximal count percentile, bringing all data samples to the similar intensity range. We then defined the sum of absolute intensity differences (SAD) to measure the global degree of disparity between the indexing systems at different phases:
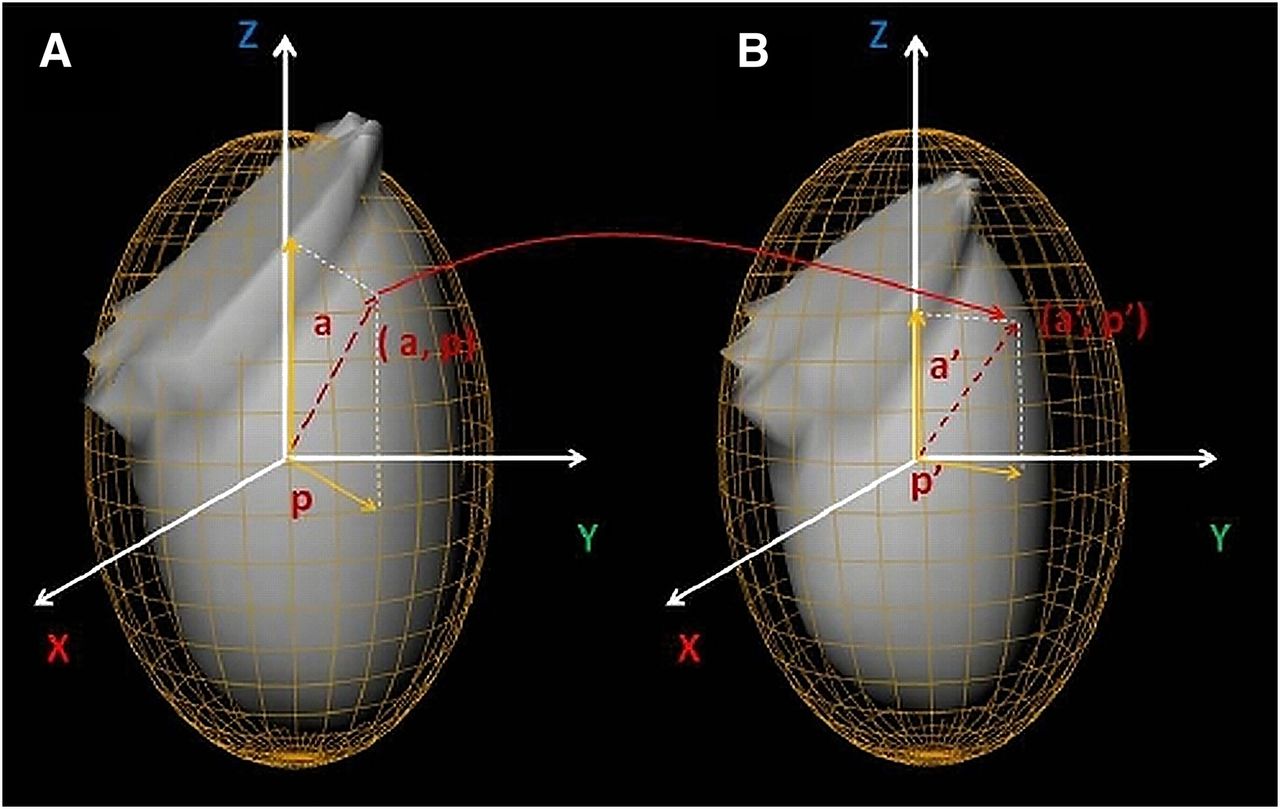
Segmented endocardial surfaces and their corresponding best ellipsoid fits for poststress ED (A) and poststress ES (B). As a result of independent segmentations of myocardium at ED and ES times, point indexed by (a, p) at time ED may actually be represented by (a′, p′) indices at ES time. This is a potential source of error for myocardial motion and thickening computations if not compensated by our proposed registration method.
The minimal SADED,ES is achieved when there is an exact 1-to-1 mapping between the 2 indexing systems (i.e., a = a′ and b = b′) and the 2 surfaces are perfectly registered. The disparities between indexed points of 2 ellipsoids can be alleviated by minimizing SADED,ES by 3-dimensional rotation of 1 of the ellipsoids (while the included left ventricle is stationary). Therefore, minimizing SADED,ES is equivalent to finding the best indexing set, which registers the 2 myocardial surfaces. The optimal rotation around each axis was achieved by performing a search in 3° steps.
An analogous approach was also used for mapping myocardial surfaces between the rest and poststress studies for MTC computation (Fig. 2). Registration is achieved by finding the optimal rotation that results in the minimal SAD function value between the rest and poststress studies, which is defined as:

Endocardial surface segmentation at ED for poststress (A) and rest (B) studies.
Rest–Stress Motion and Thickening Changes
For any point on a myocardial surface, the motion was defined as the absolute displacement of the point during the ED-to-ES interval, and thickness was defined as the absolute distance between epicardial and endocardial walls. The rest–stress motion change for a polar map sample was defined as the difference between motion values of the sample in rest–stress studies, whereas myocardial wall thickening was defined as the percentage of wall thickness increase between the ED and the ES time frames. After registering the endocardial surfaces, the rest–stress motion changes were computed for every polar map sample. In addition, rest–stress thickening changes were defined as the differences in wall thickening between the rest and poststress studies, which was defined for every polar map sample. These values were regionally averaged on the basis of the 17-segment model.
Normal Limits and Automatic Abnormality Detection
From the training population, 2 sets of normal limits were estimated for rest–stress motion and thickening changes. For each set, we calculated the normal limits for every polar map sample by estimating the sample mean and SD derived from the training set.
To quantify these abnormalities in MTC, we considered values within 2 SDs below the mean as the normal (nonischemic) range for each polar map MTC signature. To measure the degree of abnormality, an abnormality severity measure was defined. For each polar map, an MTC measure received a severity measure of 0 if it was within the 2-SD reference range. Similarly, the MTC measures between 2 and 3, 3 and 4, and beyond 4 SDs of the mean were assigned severity measures of 1, 2, and 3, respectively.
Detection of CAD in Individual Vessels
For each functional signature (motion and thickening), the severity measures were computed at each polar map site and then were averaged over each vessel territory region, therefore establishing the regional MTC severity. The polar map was segmented into vessel territories (i.e., left anterior descending, left circumflex, and right coronary artery) automatically by Cedars–Sinai quantitative perfusion SPECT (QPS)/QGS software (15). Normal limits for a functional signature for regional MTCs were derived by the calculation of the mean and SD over the training set. Two separate sets of regional normal limits were calculated for motion changes and for thickening changes.
MTC was added to the baseline TPD (16) and ischemic TPD (4) to evaluate its incremental effects on the diagnosis of 1VD, 2VD, and 3VD. For each vascular territory, we ran 2 parallel diagnostic tests (motion change and thickening test) using the corresponding regional normal limits. The outcomes of the 2 tests for each vessel territory were then combined by disjunction operator (logical “or” operator) to comprise the regional MTC test. The results of regional MTC tests were used to complement the traditional regional stress TPD measure and the regional ischemic TPD, establishing our proposed hybrid diagnostic method. Figure 3 illustrates this high-level schematic for our proposed system for the detection of 3VD.
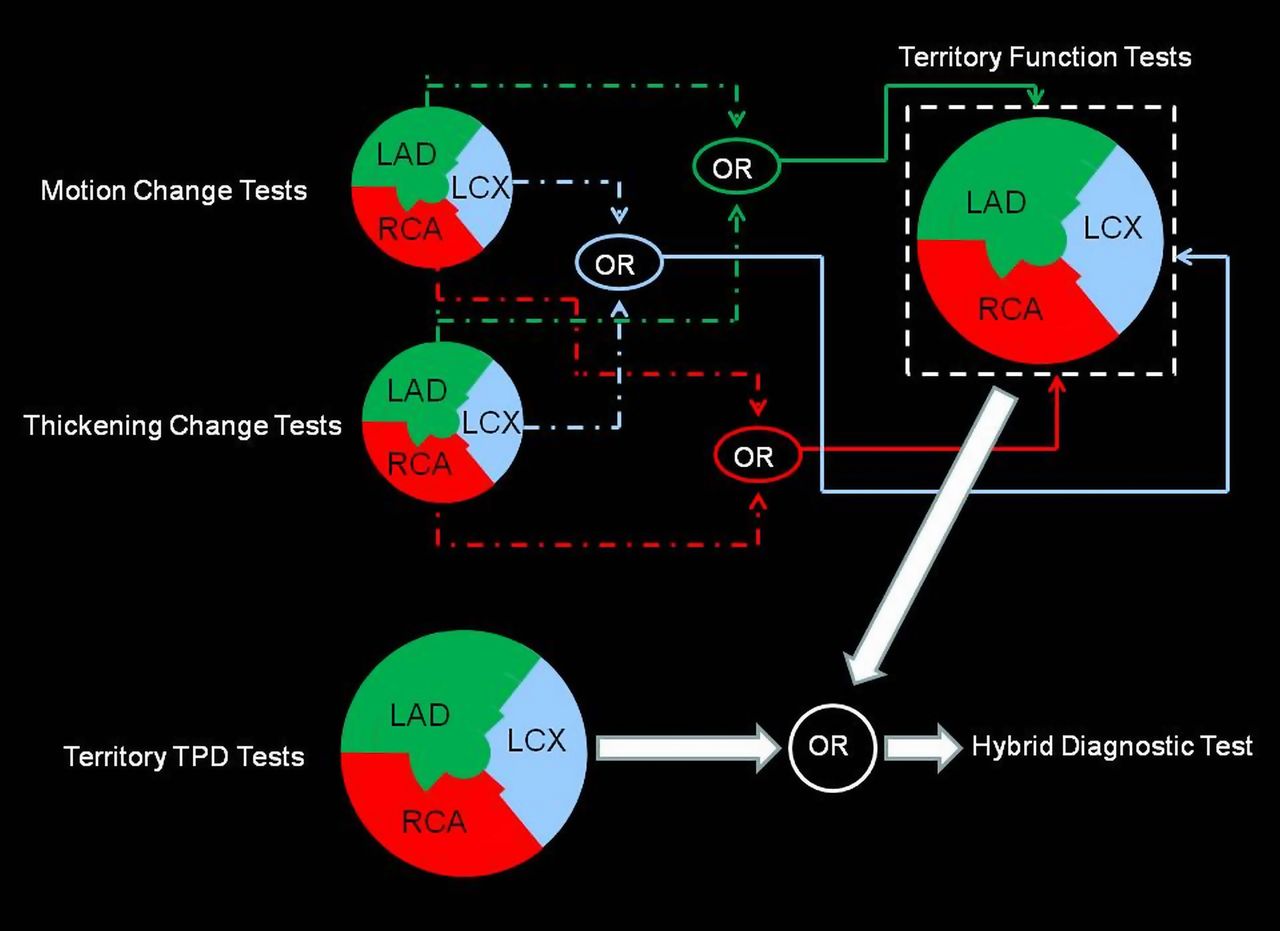
Schematic of proposed hybrid system for diagnosis of 3VD condition. LAD = left anterior descending; LCX = left circumflex; OR = logical “or” operator; RCA = right coronary artery.
The hybrid rule was devised to combine the outcomes of regional TPD and MTC with the intention of improving the sensitivity of TPD-only measures. A regional TPD of 2% or greater in each coronary territory was considered abnormal for per-vessel analysis (12,17,18). For the hybrid method to be considered positive in a given vessel territory, either the TPD or the MTC result was required to be positive in this territory.
RESULTS
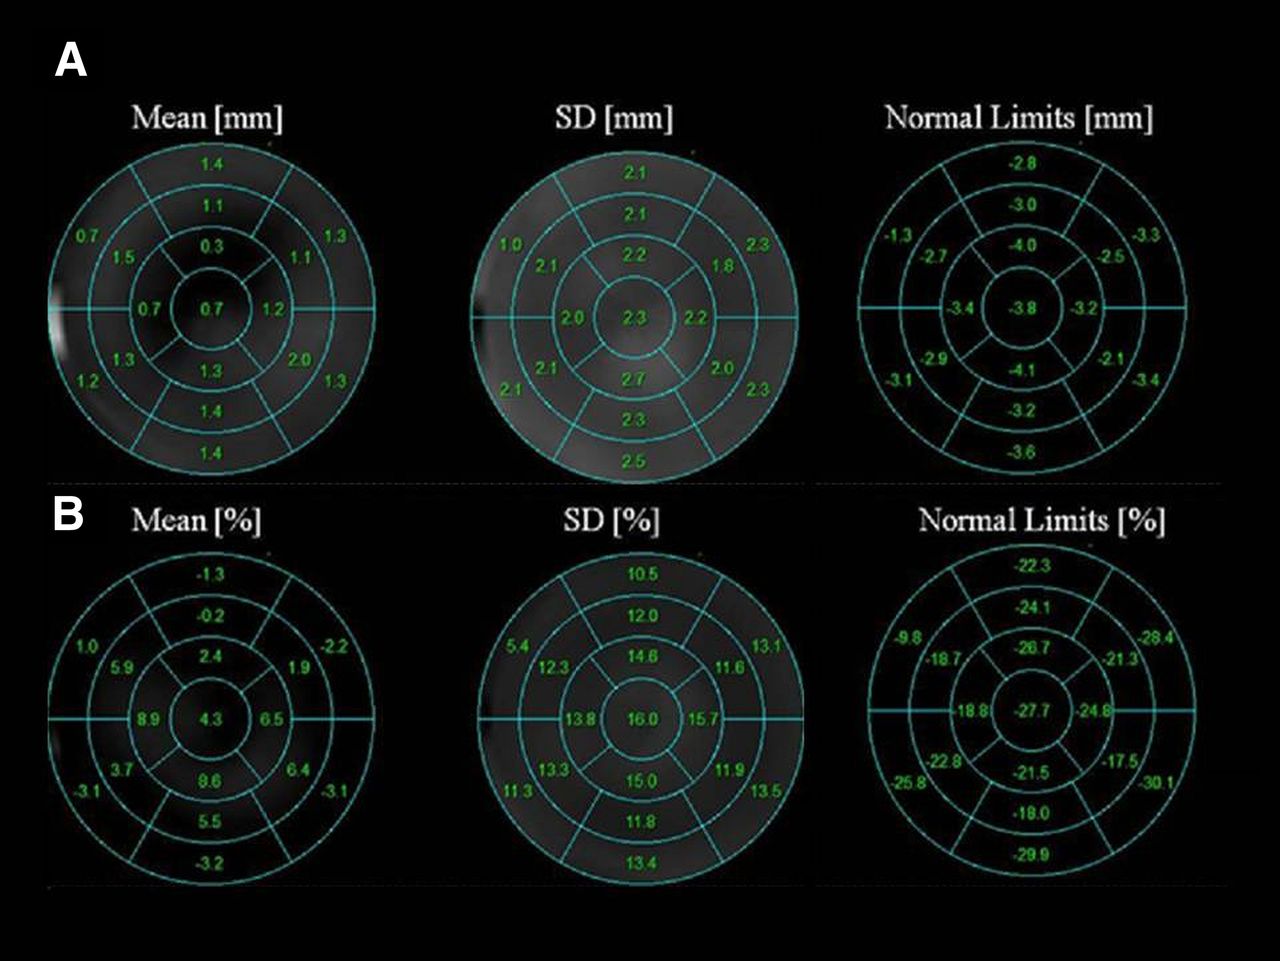
The normal values for rest–stress motion change ranged between −1.3 and −4.1 mm, with the most significant motion change occurring in the apical region (−3.2 to −4.1 mm). The normal values for rest–stress thickening changes ranged between −30.1% and −9.8%, with the most substantial thickening changes occurring in the basal segments with the exception of the basal anteroseptal region (−9.8%). Figure 4 illustrates the segmental normal limits for the rest–stress motion and thickening changes and the lower thresholds for reference range (right). The values below these limits were considered abnormal.

Segmental normal limits for poststress–rest motion change (A) and poststress–rest thickening change (B). Normal limits are defined as mean minus 2 SDs for each segment.
The comparison of the sensitivity and specificity of perfusion data and our hybrid method for detection of 3VD is shown in Figure 5. The sensitivity and specificity of ischemic TPD were 21% and 95%, respectively (Fig. 5A)—values agreeing with prior studies (6). The addition of either motion or thickening change to the ischemic TPD provided incremental improvement in sensitivity; however, the addition of both resulted in further significant improvement in sensitivity (52%, P < 0.0001), with an expected decline in overall specificity (74%, P < 0.0001). The sensitivity and specificity of stress TPD were 32% and 90%, respectively. The addition of motion and thickening each provided improvements in sensitivity, and the addition of both resulted in further improvement in sensitivity (61%, P < 0.0001) and reduced specificity (71%, P < 0.0001). Using our hybrid method, we were able to identify 32 more patients of 109 total with 3VD.
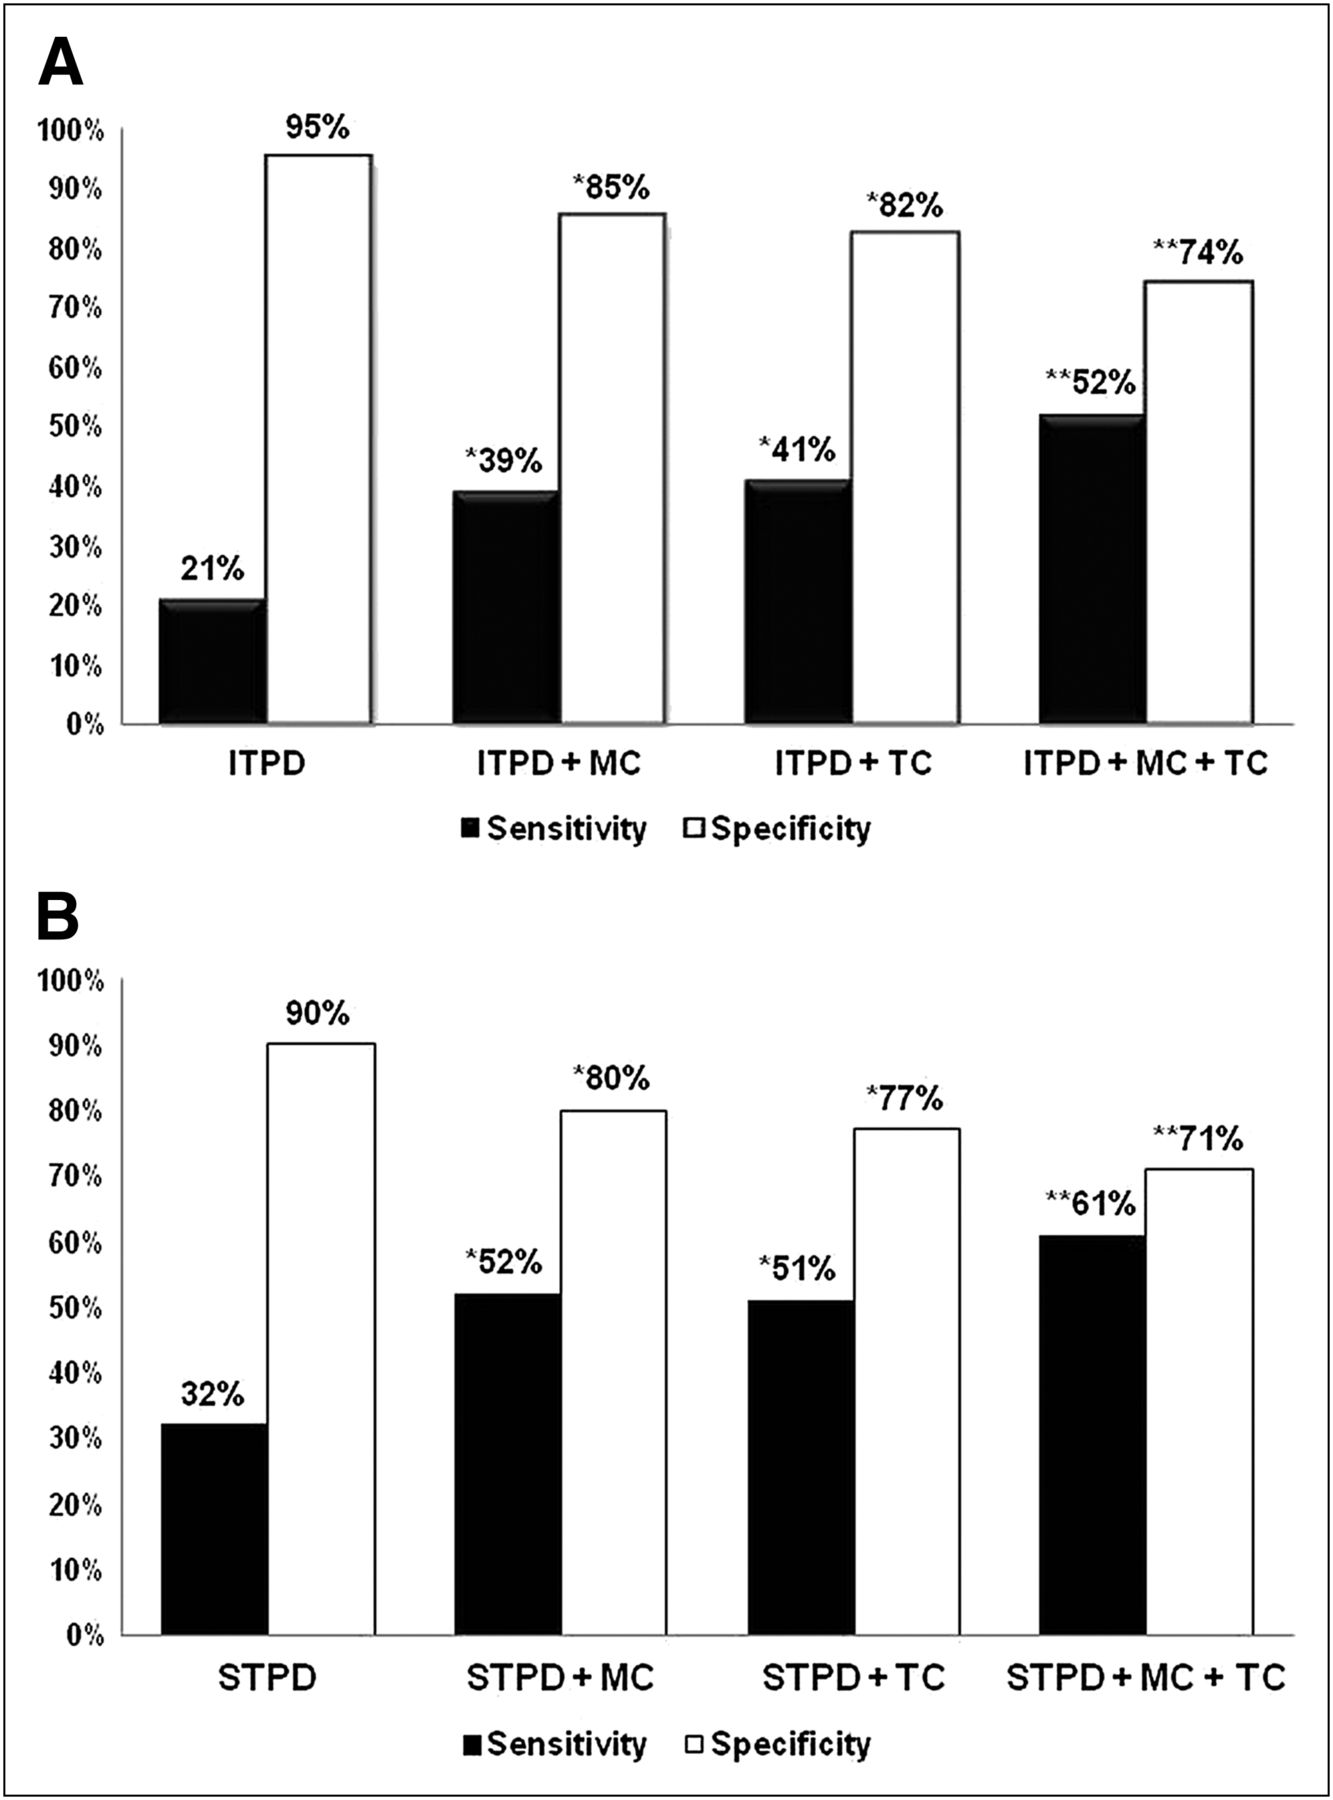
3VD detection using ischemic TPD (A), poststress TPD (B), and our hybrid approach. Abnormality threshold per vessel territory for TPD was set to 2%. *Sensitivity, P < 0.0001; specificity, P < 0.0001. **Sensitivity, P < 0.0001; specificity, P < 0.0001. ITPD = ischemic TPD; MC = motion change; TC = thickening change; STPD = stress TPD.
The comparison of the sensitivity and specificity of perfusion data and our hybrid method for detection of 1VD and 2VD is shown in Figure 6. The addition of MTC to ischemic TPD resulted in significant improvement in sensitivity for the detection of 2VD (63% vs. 53%, P < 0.001), with subsequent decline in specificity (72% vs. 80%, P < 0.001). There was no significant change in sensitivity (90% vs. 90%, P = 1) or specificity (47% vs. 50%, P = 0.0625) using our hybrid method for the detection of 1VD.
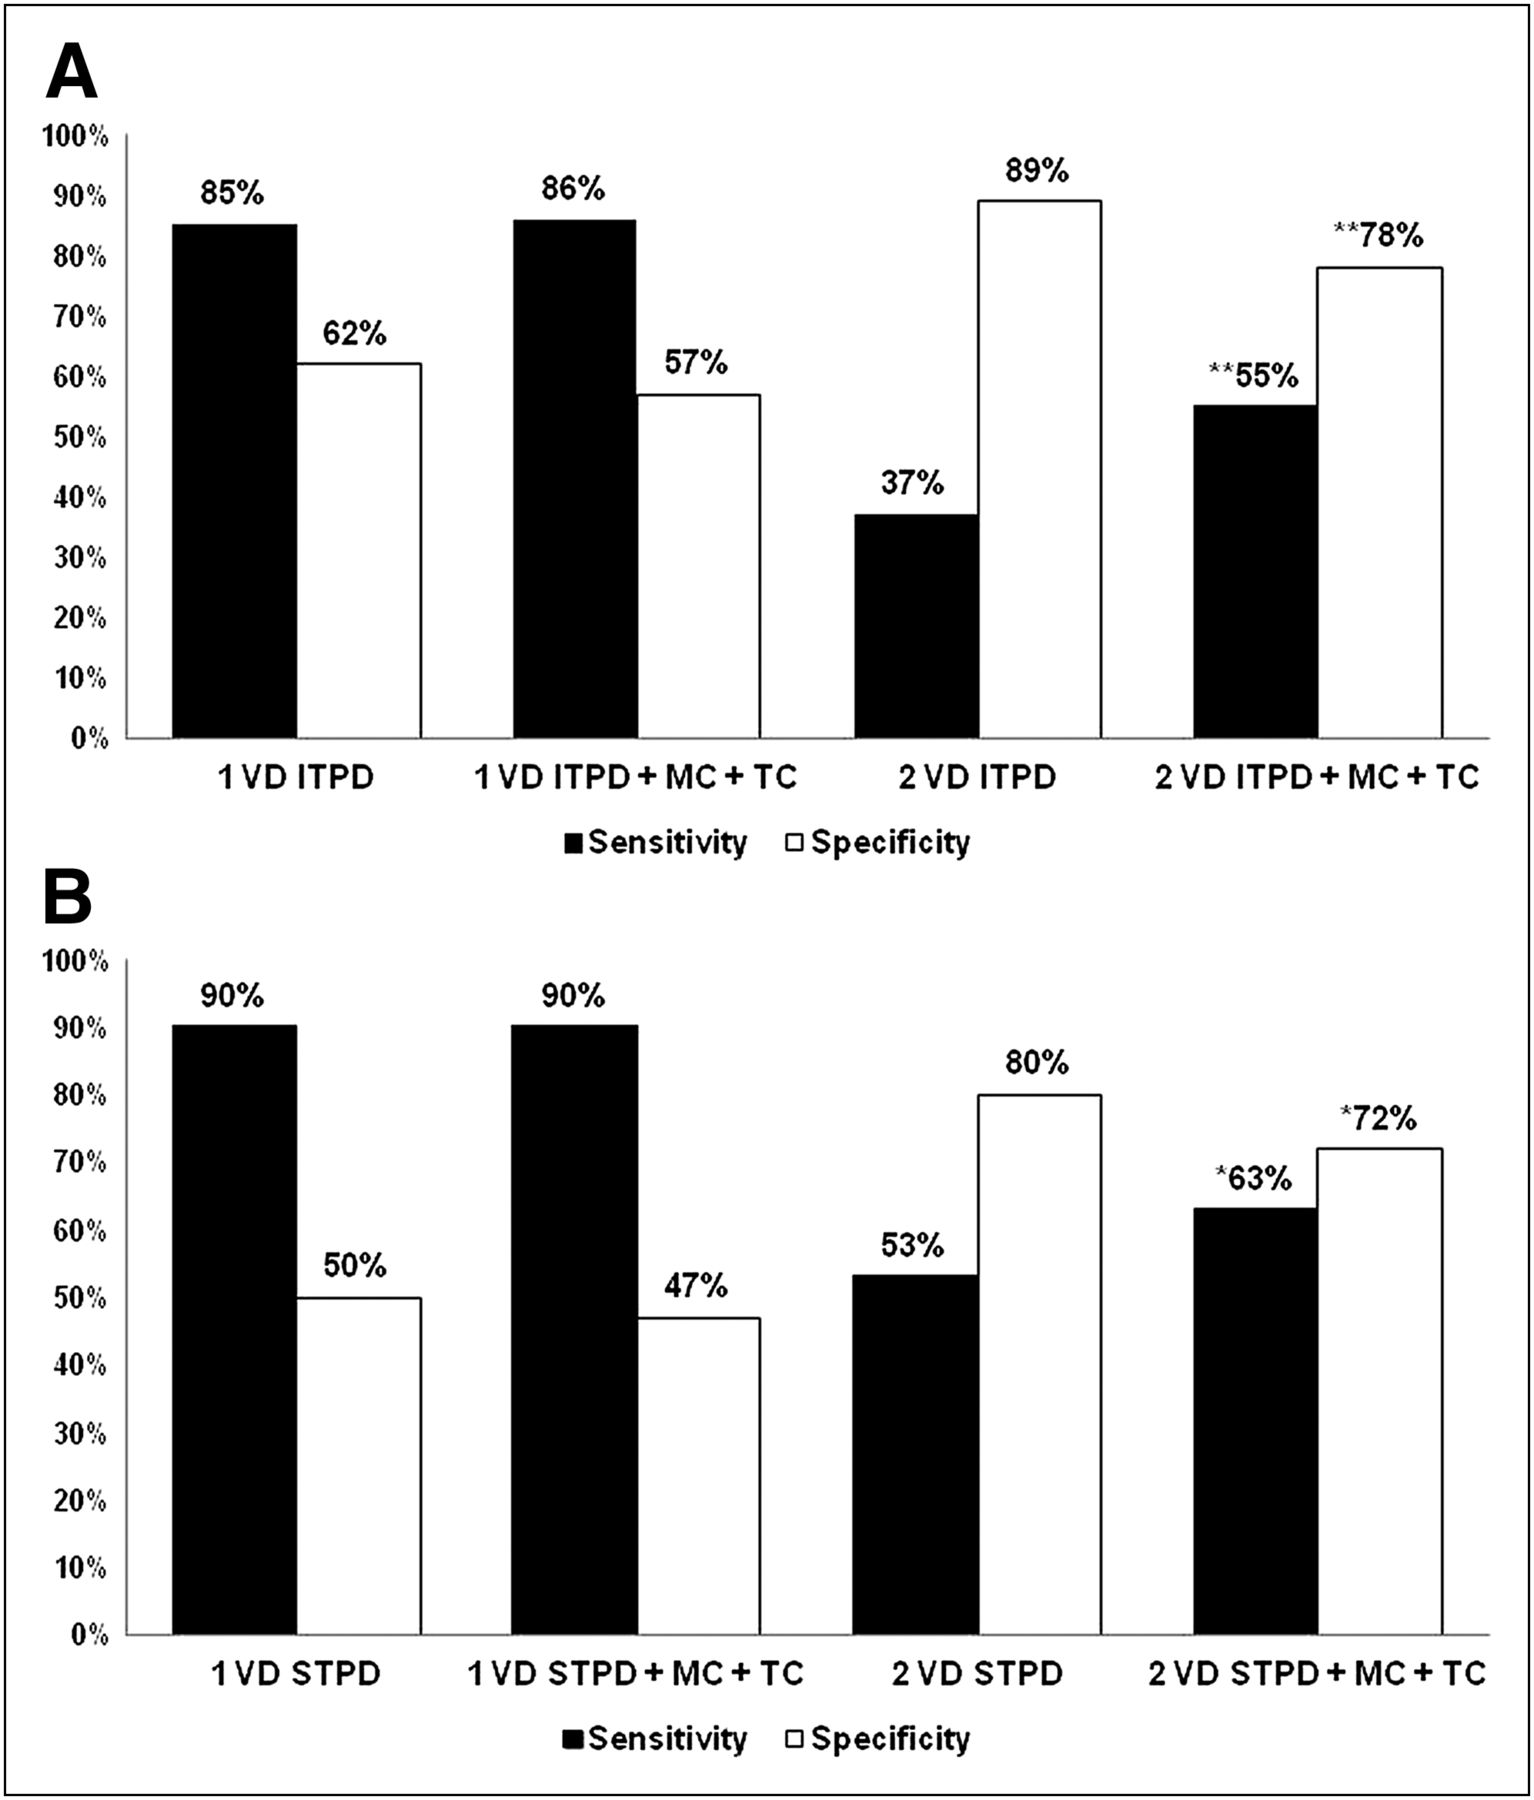
1VD and 2VD detection using ischemic TPD (A), poststress TPD (B), and our hybrid approach combining TPD and MTC. Abnormality threshold per vessel territory for TPD was set to 2%. *Sensitivity, P < 0.001; specificity: P < 0.001. **Sensitivity, P < 0.0001; specificity: P < 0.0001. ITPD = ischemic TPD; MC = motion change; TC = thickening change; STPD = stress TPD.
Furthermore, it has previously been shown that the global EF change between the rest and poststress studies provides incremental diagnostic value for the detection of a severe ischemic condition (7). The combination of regional stress TPD and the change in EF between the rest and poststress studies (with ≥5% drop in the EF after stress set as the abnormality threshold) resulted in an overall 63% accuracy for the detection of 3VD (19). By comparison, our hybrid method of combining stress TPD and MTC had a 69% accuracy (P < 0.004), further showing the overall improvement in performance of our proposed method for the detection of 3VD, as compared with existing tools. It is, however, important to bear in mind that a drop in EF after stress is a global measure and not necessarily a specific marker for 3VD.
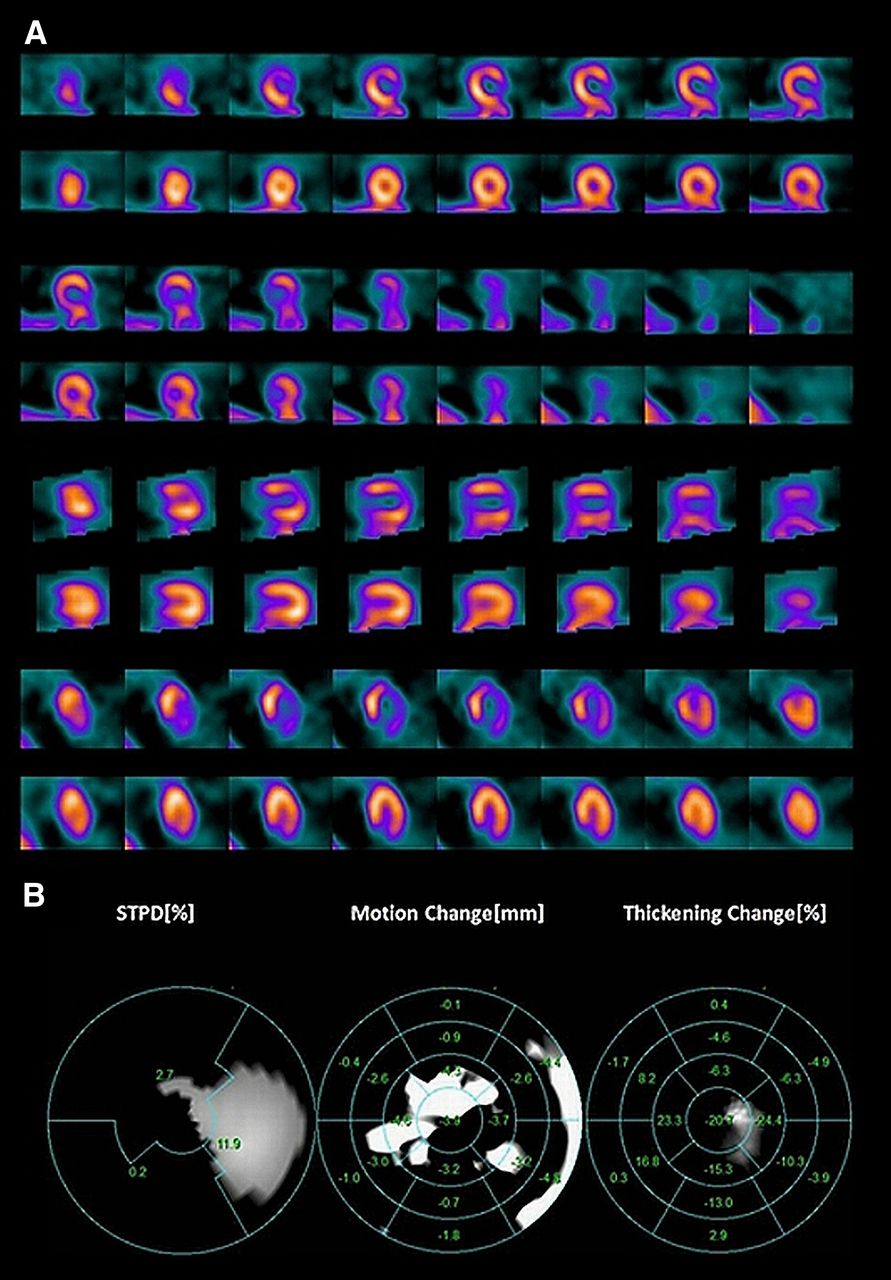
Figure 7 shows an example of how our hybrid method is able to provide incremental diagnostic value in addition to perfusion data. The patient underwent exercise 99mTc-sestamibi test, the results of which are shown in Figure 7A. The patient’s perfusion study clearly shows a reversible perfusion defect in the anterior and lateral walls (left anterior descending and left circumflex territories); however, the addition of MTC also demonstrated a motion abnormality in the right coronary artery territory. This patient’s angiogram confirmed the presence of severe 3-vessel obstructive CAD.

Rest–stress myocardial perfusion images of 53-y-old woman with history of hypertension and hyperlipidemia who underwent 99mTc-sestamibi imaging to evaluate chest pain. Poststress SPECT images clearly demonstrate reversible perfusion defect in left anterior and left circumflex artery territory (A). Motion and thickening change also identify abnormalities in right coronary artery territory (B). Cardiac catheterization confirmed presence of 3VD. STPD = stress TPD.
DISCUSSION
The diagnosis of multivessel CAD using MPS is associated with significant technical and clinical challenges. In patients with multivessel CAD, an overall global count deficiency in perfusion might exist. Because of the lack of normal landmarks during the count normalization process, a count deficiency can lead to overall reduced discrepancies between the normal limits and the ischemic regions (20). As a result, these hypoperfused regions could appear as normal, resulting in a decreased sensitivity of the test. This decrease in sensitivity can be quite significant, with 20% of patients with 3VD having normal MPS scan results and only about 29% of patients with 3VD having perfusion abnormalities in all 3 coronary territories (5,6). This limitation is unfortunate, because the patients with multivessel disease might benefit most from early detection and revascularization, especially if they have compromised left ventricular function (21,22). In patients with severe CAD, the myocardium may exhibit compromised contractile function such as reduced wall motion and thickening, and prior studies have shown that supplementing either regional or global functional data from the electrocardiography-gated SPECT stress studies to the perfusion quantification improved the accuracy of multivessel disease detection (7,20,23).
Emmett et al. demonstrated in 2002 (8) that poststress and reversible RWMA were strong predictors of obstructive CAD and provided incremental diagnostic value to MPS for the assessment of angiographic severity. In their study, reversible RWMA had a 53% sensitivity and 100% specificity for identifying angiographic stenoses of 70% or greater. Furthermore, they noted that reversible RWMA and poststress RWMA were strong predictors of angiographic severity. The overall advantage of our hybrid method is that by registering the myocardial surfaces, we were able to identify subtle changes between rest and poststress studies that might otherwise not be identified. Figure 4 demonstrates that in regard to myocardial wall motion, the poststress studies tended to have a larger degree of motion in all 17 segmental regions than the rest studies. On the other hand, we did not see a similar uniform pattern for myocardial wall thickening. Nonetheless, it is clear that for myocardial wall motion, and to some extent for myocardial thickening, the SD changes for segmental regions are similar. However, Figure 7 demonstrates that abnormal myocardial motion and thickening do not always correlate with each other or with those provided by perfusion imaging. It is likely that this lack of correlation is associated with the fact that functional changes related to ischemia are likely governed by more complicated relations, and the existence of CAD in a particular vessel territory might manifest in only a subset of functional signatures rather than both, due to technical limitations of MPS. Therefore, we consider both of these functional signatures when evaluating the presence of CAD in any particular territory.
The overall lack of sensitivity of regional TPD for detecting 3VD in our study is similar to a prior study by Christian et al. (6). Figure 5 demonstrates the improvement in performance of our hybrid method, compared with the traditional TPD method, for the detection of 3VD. In our study, a test was considered positive for 3VD detection only if there were abnormalities detected in all 3 vessel territories, regardless of the detection method used. Our proposed hybrid method outperformed the perfusion-only diagnostic method by correctly detecting 32 more cases of 3VD of 109 total patients with 3VD. On the other hand, because our hybrid method did not overrule the TPD-positive results, we did not expect any improvements in the overall specificity using our method, as was confirmed by the results. These data are consistent with prior studies demonstrating that new reversible RWMA was a strong predictor of angiographic severity and added incremental value to the perfusion data for assessment of severity (8). Furthermore, Figure 6 demonstrates a similar improvement in sensitivity for the detection of 2VD, with a similar decline in overall specificity. However, a similar pattern was not seen for the detection of 1VD. These findings are similar to a prior study by Sharir et al. (23), who showed that exercise-induced RWMA detected by 99mTc-sestamibi gated SPECT is a predictor of multivessel CAD.
The overall improvement in the detection rate of multivessel disease by applying our hybrid method, compared with the TPD-alone method, is evidence that there is incremental value in supplementing myocardial functional information with the traditional perfusion information for the diagnosis of multivessel disease.
Prior studies have also demonstrated that global functional changes could be used for the detection of 3VD. A study by Hida et al. in 2009 demonstrated that a postadenosine stress reduction in left ventricular function of 5% or greater had a 60% sensitivity and 77% specificity for the detection of multivessel CAD (19). However, in our study the accuracy of 3-vessel detection using a drop in EF of 5% or more was only 63%, as compared with 69% with our hybrid method (P < 0.004). A regional approach using our hybrid method along with TPD therefore appears to be a reasonable method for the detection of multivessel disease.
There are several limitations in our study. One of the major limitations is that the functional images were not obtained at the time of maximal stress but rather up to 45 min afterward, likely decreasing the overall sensitivity of our hybrid method. A study by Yoda et al. in 2005 demonstrated that the detection of RWMA immediately after exercise provided incremental diagnostic value to the myocardial perfusion images by improving sensitivity for the detection of moderate single-vessel disease (50%–70%) (24). However, other studies have demonstrated that stress-induced myocardial stunning could persist for more than 1 h after exercise or adenosine infusion in patients with severe CAD (7,25,26). Another limitation is that the abnormal rest studies will clearly limit the ability to identify new regional wall motion abnormalities on a poststress scan. In our study, however, patients with myocardial infarctions (known CAD) were excluded. Furthermore, vascular territories defined for myocardial perfusion studies are somewhat imprecise, with 2 vessels possibly supplying the same territory, and therefore part of the error of the technique is related possibly to the incorrect territory definition, which cannot be overcome by combination of functional and perfusion analysis.
CONCLUSION
In this paper, we presented a novel technique for myocardial surface nonrigid registration to eliminate the polar map indexing disparities between endocardial surfaces of different cardiac cycles and studies (rest and poststress) and to compute motion and thickening changes directly. Our results show the potential value of our proposed method, compared with the perfusion-only method, in improving the overall sensitivity for the detection of multivessel disease. Combining regional perfusion measures with regional functional changes appears more accurate for detection of 3VD than are the global functional measures using TPD and EF as a marker of 3VD.
DISCLOSURE STATEMENT
The costs of publication of this article were defrayed in part by the payment of page charges. Therefore, and solely to indicate this fact, this article is hereby marked “advertisement” in accordance with 18 USC section 1734.
Acknowledgments
We thank Arpine Oganyan for editing and proofreading the text. This research was supported in part by grant R01HL089765 from the National Heart, Lung, and Blood Institute/National Institutes of Health (NHLBI/NIH). Its contents are solely the responsibility of the authors and do not necessarily represent the official views of the NHLBI. No other potential conflict of interest relevant to this article was reported.
Footnotes
Published online Jul. 7, 2012.
- © 2012 by the Society of Nuclear Medicine and Molecular Imaging, Inc.
REFERENCES
- Received for publication November 17, 2011.
- Accepted for publication March 27, 2012.


