


Abstract
Calculated red marrow absorbed dose in patients receiving radioimmunotherapy (RAIT) has not been highly predictive of the dose-limiting hematologic toxicity observed in many patient populations studied. Because patients receiving the same red marrow dose often experience different grades of toxicity, other factors might help predict the different grades of toxicity observed. One such factor may be the plasma FLT3-L (FMS-related tyrosine kinase 3 ligand, hematopoiesis stimulatory cytokine) level, which has been shown to be a better indicator of recovery of progenitor cells and, thus, red marrow radiosensitivity (because during the recovery period the progenitor cells are hyperproliferative and potentially more radiosensitive) for patients treated with previous chemotherapy than peripheral blood counts. Methods: Red marrow radiation doses were determined for 30 patients (20 male, 10 female; all without bone marrow or bone involvement; 19 had prior chemotherapy) after receiving 131I RAIT (activity range, 2.1–8.9 GBq) for treatment of solid cancers known to produce carcinoembryonic antigen. Radiation dose estimates were calculated using 2 different methods of red marrow cumulated activity and red marrow-to-blood activity concentration ratio determinations for 2 dosimetric models: using both male and female and male-only masses and S values. Highest platelet toxicity grade at nadir (PTG), percentage platelet decrease (PPD) in counts, and platelet nadir (PN) counts were measured. FLT3-L levels (pg/mL) were determined by immunoassay before treatment; a normal FLT3-L level was assumed to be 80 pg/mL. The red marrow radiation doses (cGy) were adjusted for the patient’s FLT3-L level when the patient’s cytokine level exceeded the normal value. Marrow doses and FLT3-L–adjusted marrow doses were correlated with PTG, PPD, PN, and 1/PN. Administered activity, administered activity per unit body weight, and total body radiation dose were also correlated with these hematologic toxicity measures. Results: All red marrow dose calculation schemes resulted in essentially the same correlations for a given hematologic toxicity measure. Poor correlations were observed between administered activity, administered activity per unit body weight, total body radiation dose, or red marrow radiation dose and PTG, PPD, PN, and 1/PN. All correlations improved greatly when the various predictors of toxicity were adjusted for the patient’s FLT3-L level. The highest correlation observed was between red marrow dose or total body dose and 1/PN (r = 0.86). Using an unadjusted red marrow dose to predict toxicity ≥ grade 3, there were 8 true-positive, but 13 false-positive cases with 9 true-negatives. However, using a FLT3-L–adjusted red marrow dose, there were 8 true-positives, but only 2 false-positives and 20 true-negatives. Conclusion: FLT3-L–adjusted red marrow radiation doses provide improved correlation with hematologic toxicity. Thus, elevated FLT3-L plasma levels before RAIT may indicate increased radiosensitivity of the bone marrow, and use of this measurement to adjust calculated red marrow or total body radiation doses may provide significantly better prediction of toxicity than radiation dose alone, leading to a patient-specific administered activity prescription that will deliver radiation doses to diseased tissues sufficient to produce an effective treatment outcome at acceptable toxicity levels.
- dosimetry
- Flt3-L
- hematologic toxicity
- radioimmunotherapy
- radionuclide therapy
- red marrow dosimetry
- thrombocytopenia
The basic goal of radionuclide therapy treatment planning is to ensure that the appropriate activity is administered to the patient to deliver a radiation absorbed dose to diseased tissues that will produce an effective treatment outcome without causing undesired effects in healthy tissues. The dose-limiting toxicity for most of these agents without hematopoietic stem cell support is myelosuppression (1–4), and, as a result, many investigators have evaluated radiation dose to red marrow (or total body) for radioimmunotherapy (RAIT) patients to develop dose–toxicity relationships.
Currently, a widely accepted approach for calculating red marrow dose estimates uses a 2-component equation (1) for radionuclide therapy agents that do not bind to any blood, marrow, or bone elements in patients whose disease does not include significant bone marrow or bone involvement. Red marrow radiation dose has been confirmed to be the single most important factor affecting hematologic toxicity after RAIT (5), although, in some instances, investigators have shown total body radiation dose to be a useful predictive parameter (6,7). Nevertheless, calculated red marrow absorbed dose has not been highly predictive of dose-limiting hematologic toxicity observed in treated patients (4,5). As a result, unlike external beam radiation therapy, where patient-specific treatment planning is performed to ensure delivery of the tumor radiation dose prescribed to optimize the probability of tumor control relative to normal tissue complications, there is no standard approach for the treatment prescription of RAIT. Treatment may be prescribed in terms of administered activity, administered activity adjusted for patient-specific parameters (e.g., body weight or surface area), absorbed radiation dose by tumor, or dose-limiting normal organs.
Hematologic toxicity may be due to factors not entirely explained by pharmacokinetic and dosimetric variables alone, and this may be why patients’ estimated red marrow radiation doses do not accurately predict observed toxicity. Individuals’ biologic response to radiation may vary because of inherent interpatient differences, decreased bone marrow reserve in some patients, and increased radiosensitivity because of prior chemotherapy or external beam radiation. As a result, many investigators are attempting to refine their dosimetry models to be more patient specific. Although the predicted dose–toxicity relationship is likely to improve as more patient-specific red marrow dose models are implemented, more work needs to be done to predict the tolerance of patients who have received therapy before nonmyeloablative RAIT. Investigators have shown that, in addition to red marrow absorbed dose, other important factors—such as baseline peripheral blood cell counts, presence of bone marrow or bone metastases, and time from last chemotherapy treatment—have been useful for predicting myelotoxicity (5,8). Still, some patients experience greater toxicity (and some patients experience less toxicity) than these observations would have predicted.
Normal white blood cell (WBC) and platelet counts are typically considered sufficient indicators of patient tolerance for additional myelosuppressive treatment. Peripheral blood cell counts, however, do not reliably predict response to myelosuppressive therapy. During the recovery period (3–6 mo) after anticancer myelosuppressive therapy, hematopoietic progenitor cells become mitotically active to replenish the bone marrow compartment and remain hyperproliferative even after normalization of peripheral WBCs and platelets (9,10). In one study, persistent depletion of colony-forming unit–granulocyte macrophage (CFU–GM) has been noted after irradiation, although normal cell numbers were found in the peripheral blood (11). Severe reduction in the supportive stroma also has been reported (12,13) which affects long-term stem cell engraftment and the maintenance of normal hematopoietic functions. After radiation exposure, recovery proceeds by repair of sublethal cellular injury and compensatory cellular repopulation by the surviving fraction (14). At this stage, the progenitors are more radiosensitive and chemosensitive. Potentially cytotoxic radionuclide treatment during this phase will likely result in more severe myelotoxicity than would have occurred in the same patient who had not received this prior therapy, and this effect on the bone marrow needs to be considered. Previously, Blumenthal et al. (15) reported that the plasma concentration of the marrow stroma-produced stimulatory cytokine FLT3-L before radionuclide therapy was a better indicator of recovery of progenitor cells and, thus, red marrow radiosensitivity (because during the recovery period the progenitor cells are hyperproliferative and potentially more radiosensitive) for patients treated with previous chemotherapy than peripheral blood counts. FLT3-L levels enabled determination, with 86% accuracy, of which patients were likely to have grade 3 myelosuppression with additional cytotoxic therapy and which patients were not likely to experience dose-limiting myelotoxicity.
The purpose of this study was to determine if adjusting the red marrow radiation dose, as calculated using a variety of methods, for FLT3-L levels would improve the correlation between red marrow dose and hematologic toxicity in patients receiving RAIT. Red marrow absorbed dose estimates in this group of patients were calculated using 2 different methods of determining red marrow cumulated activity and red marrow-to-blood activity concentration ratios for 2 different dosimetric models: using both male and female and male-only masses and S values. Correlations with observed toxicity were studied with and without adjustment for FLT3-L levels in peripheral blood.
MATERIALS AND METHODS
Patients and Antibodies
Thirty patients (20 male, 10 female) with solid cancers known to produce carcinoembryonic antigen (CEA) enrolled in Institutional Review Board–approved Garden State Cancer Center clinical RAIT trials were included in this study. The majority of these patients had colorectal and medullary thyroid carcinomas. No patient had known bone marrow or bone metastases based on one or more of the following: CT scans, MRI scans, bone scans, and bone marrow biopsy. The patients received RAIT with 131I-labeled anti-CEA NP4 (IgG or F(ab′)2) or anti-CEA MN-14 (IgG or F(ab)2) (5), supplied by Immunomedics, Inc. (Morris Plains, NJ) with administered activities ranging from 2.1 to 8.9 GBq for the treatment of their CEA-producing cancers. The treatment activity prescription was either a fixed activity of 2.8 GBq, activity based on the patient’s body surface area, or activity determined by a pretherapy tracer study performed 1–2 wk before treatment to deliver a prescribed red marrow radiation dose. In the latter case, a patient-specific treatment activity was administered to deliver a red marrow absorbed dose of 250 or 325 cGy (for patients receiving the antibody fragment of MN-14) or 450 cGy (for patients receiving NP4 or MN-14 IgG). These prescribed dose limits were obtained using a blood-based marrow dose estimate (1) with a marrow-to-blood activity concentration ratio of unity (this latter activity concentration ratio has subsequently been reduced to 0.36). All infusions were given intravenously over a 15- to 30-min time period, and all patients were premedicated with Lugol’s or supersaturated potassium iodine solution and potassium perchlorate to decrease thyroid and gastric uptake of radioiodine. These labeled monoclonal antibodies do not bind to crossreactive antigens in the red marrow (16–18). Eleven patients were chemotherapy naive and the remaining 19 had received multiple cycles of chemotherapy with various drugs and different durations ranging from 1 to 25 mo since their previous treatment (11 of the 19 patients had prior chemotherapy within 6 mo of RAIT).
Blood and Total Body Pharmacokinetics
Blood cumulated activity concentrations were determined by counting samples of whole blood in a calibrated γ-well counter to obtain blood activity concentrations at various time points after the end of the antibody activity infusion. Three to 8 blood samples were collected over the first 24 h, and then daily sampling was performed over the next 2–7 d. Time–activity blood concentration curves were analyzed using a nonlinear least-squares curve-fitting algorithm to determine the slopes of the distribution (α) and elimination (β) phases and their respective intercepts. These curves, which were either monophasic or biphasic, were then integrated to obtain the blood cumulated activity concentration. Total body cumulated activities were determined using either whole-body gamma-camera counts or radiation probe counts obtained at multiple time points after administration.
Plasma Cytokine Immunoassays
Blood samples were collected in all patients on the day of RAIT. In addition, blood samples were collected from 5 healthy volunteers. Plasma FLT3-L in these blood samples was measured by a quantitative sandwich enzyme immunoassay using Quantikine Immunoassay kits (R&D Systems, Inc., Minneapolis, MN). Samples were run in duplicate and results were read from a linear standard curve. The assay kits were sensitive (7 pg/mL) and specific and showed no significant crossreactivity with any other murine or human cytokine. The purpose of the volunteer sampling was to determine a normal FLT3-L level.
Toxicity Assessment
Myelotoxicity was graded according to the Radiation Therapy Oncology Group criteria. All patients given therapeutic administrations of 131I-labeled monoclonal antibodies were monitored for hematologic toxicity by checking complete peripheral blood cell counts weekly. Patient blood was collected before RAIT to establish the baseline peripheral WBC and platelet counts. When grade 2 or higher thrombocytopenia or leukopenia developed, measurements were taken more frequently until the nadir had been determined. The patients’ blood counts were monitored until complete hematologic recovery was established. Because thrombocytopenia is often the dose-limiting factor for RAIT, platelet toxicity grade (PTG), percentage platelet decrease (PPD), and platelet nadir (PN) were used as the measures of toxicity in this study. In addition, 1/PN was determined.
Red Marrow Dosimetry
Red marrow radiation dose was estimated in all patients on the basis of the measured cumulated activity in the whole blood and the measured cumulated activity in the total body. The relative contribution of each of these 2 components to the red marrow dose estimate is dependent on the total body to blood cumulated activity ratio (19). Additional distinguishable source organ contributions could also be included (2); however, their expected contribution to red marrow dose has been estimated to be on the order of ≤5%. A 2-component equation (1) was therefore used to determine red marrow absorbed dose because these patients do not have disease in bone marrow or bone and the radioimmunotherapeutic agents they received do not bind to blood, marrow, or bone elements. The first component reflects the red marrow dose contribution from activity distributed within the extracellular fluid space of the red marrow due to the circulating blood activity, and the second component reflects the absorbed dose contribution from activity in the remainder of the body, according to:
 Eq. 1 where DRM is the red marrow dose estimate; ÃRM is the red marrow cumulated activity; ÃRB is the remainder of the body cumulated activity obtained by subtracting the red marrow value, ÃRM, from the total body value, ÃTB; S(RM ← RM) is the red marrow-to-red marrow S value; and S(RM ← RB) is the remainder of the body-to-red marrow S value. Most investigators have used 1 of 2 dosimetric models—namely, MIRD 11 (20) or MIRDOSE3 (21)—for the needed S values in Equation 1. Therefore, both sets of S values and their associated masses were used to compare the red marrow dose results. Furthermore, MIRDOSE3 explicitly provides S values for females; therefore, an additional red marrow dose comparison was performed using both male and female versus male-only masses and S values. The S values were adjusted for patient weight through multiplication by the total body mass of the patient divided by the total body mass of the model; all S values were adjusted using the inverse of this mass relationship (linear mass-based scaling of the S values for 131I is not strictly correct because the photon absorbed fractions do not scale linearly with weight; however, this approximation gives an adequate result). The red marrow mass of the adult male model is 1.5 kg and 1.12 kg for MIRD 11 and MIRDOSE3, respectively, and the total body mass of the adult male model is 69.88 kg and 73.7 kg for MIRD 11 and MIRDOSE3, respectively. For females, the MIRDOSE3 red marrow model mass is 1.05 kg and the model total body mass is 58 kg. It should be noted that the remainder of the body-to-red marrow S value was determined not only by using the patient-specific approach of adjusting the model S values and masses by the patient total body weight, but also, because there is no bone activity uptake in the patients studied, the bone component (i.e., trabecular and cortical) contribution to this term was explicitly subtracted (22).
The red marrow cumulated activity, ÃRM, in Equation 1 was determined using 2 approaches (these equations are applicable only for radiopharmaceuticals that do not bind to marrow or bone):
 Eq. 2
Eq. 2
 Eq. 3 where [Ã]blood is the blood cumulated activity concentration obtained from analysis of the blood activity concentration–time curve, mRM,model is the red marrow mass of the respective dosimetric model, mTB,patient is the total body mass of the patient, mTB,model is the total body mass of the respective model, A0 is the administered activity, and Te,blood is the blood effective half-time obtained from analysis of the blood activity concentration–time curve (if the blood activity concentration–time curve is biphasic, Te,blood is replaced by Σi fi (Ti)e,blood, where fi is the activity concentration fraction of the i-th exponential component and (Ti)e,blood is the effective half-time of the i-th exponential component). Because the red marrow and blood masses are assumed to vary similarly as a function of patient weight, the value of the mass ratio in Equation 3 is assumed to be a fixed value. Finally, CF is a correction factor for the marrow-to-blood activity concentration ratio. Originally, the correction factor, CF, was set at unity (1), but other investigators have shown this value to be too conservative (23–26). CF is currently assigned either a fixed value of between 0.2 and 0.4 (2) or a value of 0.19/(1 − hematocrit) (23). For this analysis, 2 approaches have been used to estimate the red marrow radiation dose: a fixed CF of 0.3 and a CF determined using the value of 0.19/(1 − hematocrit).
All red marrow radiation doses (cGy) were adjusted for the patient’s FLT3-L level when the patient’s cytokine levels exceeded normal values. Marrow doses and FLT3-L–adjusted marrow doses were correlated with PTG, PPD, PN, and 1/PN. In addition, administered activity, administered activity per unit body weight, and total body dose (equal to ÃTB multiplied by the mass-adjusted total body-to-total body S value) were also correlated with these measures of hematologic toxicity.
RESULTS
The FLT3-L level was determined in the volunteers to be 52 ± 14 pg/mL; therefore, a normal value of FLT3-L was assumed to be 80 pg/mL (mean + 2SD). The red marrow radiation doses (cGy) and the other toxicity predictors (administered activity, administered activity per unit body weight, and total body dose) were adjusted for the patient’s FLT3-L level through multiplication by a factor of FLT3-L level/80 when the patient’s cytokine level exceeded 80 pg/mL. All of the red marrow doses calculated by the various schemes resulted in essentially the same correlations for a given measure of hematologic toxicity (Table 1):
Use of MIRD 11 and MIRDOSE3 S values and masses yielded similar correlations.
Use of male-only parameters resulted in correlations that were similar to use of both male and female model parameters.
Use of the 2 methods for red marrow cumulated activity determination (Eqs. 2 and 3) resulted in similar dose–toxicity correlations.
Use of constant red marrow-to-blood activity concentration ratio (CF = 0.3) yielded results that were similar to use of the more patient-specific CF determination.
Use of 1/PN yielded correlations that were better than use of PTG, PPD, or PN.
All predictors of toxicity (administered activity, administered activity per unit body weight, total body dose, and red marrow dose) when adjusted for the patient’s observed FLT3-L level yielded stronger correlations than the corresponding nonadjusted values.
Adjusted red marrow and total body dose yielded better correlations than adjusted administered activity (GBq) or adjusted administered activity per unit body weight (GBq/kg) when using 1/PN as the measure of hematologic toxicity.
Comparison of Correlation Coefficients Between Unadjusted and FLT3-L–Adjusted Toxicity Predictors
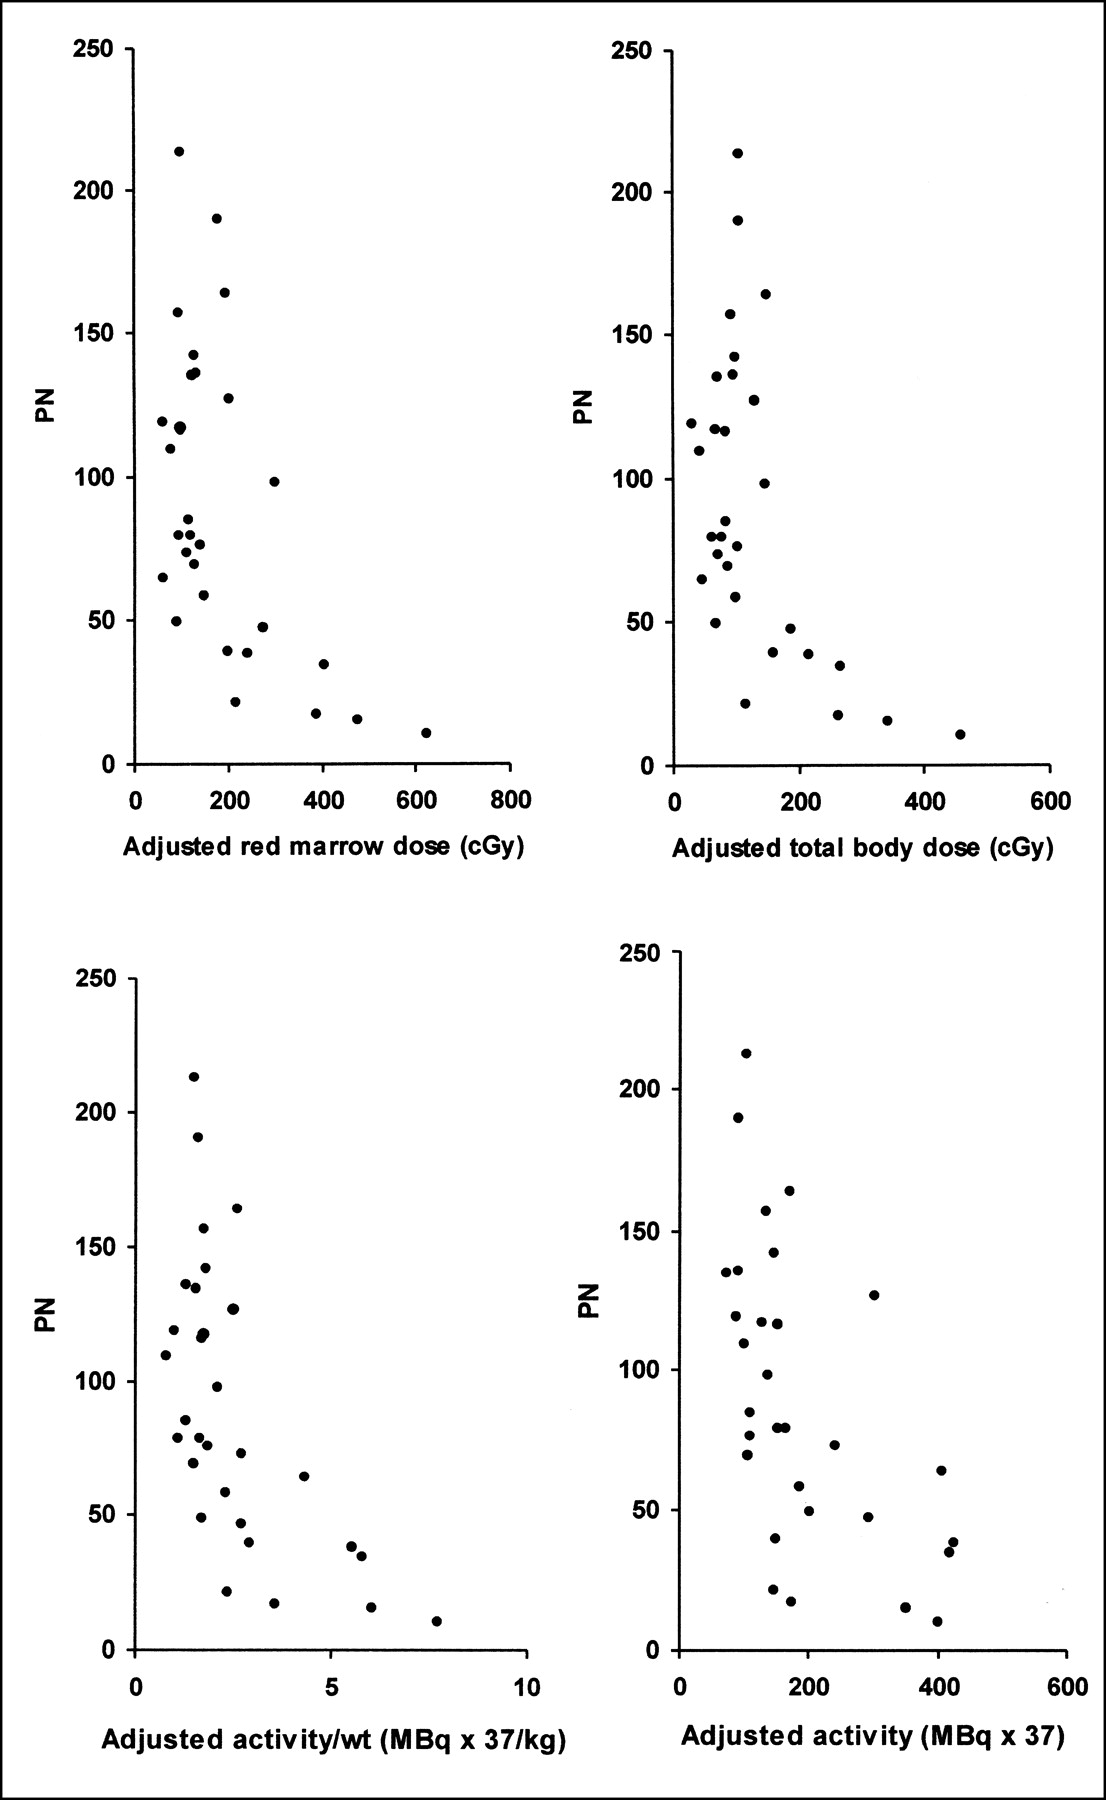
The correlation coefficients for PN versus radiation dose were determined using an exponential function; all other correlations were determined using a linear function. The comparisons of PN with the FLT3-L–adjusted predictors of toxicity are shown in Figure 1, and the comparisons of 1/PN with the FLT3-L–adjusted toxicity predictors are shown in Figure 2.

Comparisons of PN with FLT3-L–adjusted predictors of toxicity.

Comparisons of 1/PN with FLT3-L–adjusted predictors of toxicity.
Poor correlations were observed between the administered activity and PTG, PPD, PN, and 1/PN (r = 0.05, 0.15, 0.03, and 0.21, respectively) and the administered activity per unit body weight and these hematologic toxicity measures (r = 0.28, 0.33, 0.18, and 0.04, respectively). Similar poor correlations were observed between red marrow radiation dose and PTG, PPD, PN, and 1/PN (r = 0.28, 0.15, 0.22, and 0.20, respectively). Correlations between FLT3-L–adjusted marrow dose and PTG, PPD, PN, and 1/PN were greatly improved (r = 0.70, 0.48, 0.76, and 0.86, respectively), as were the correlations for administered activity and administered activity per unit body weight. Correlations between FLT3-L–adjusted total body dose, using only the MIRDOSE3 dosimetric model, and PTG, PPD, PN, and 1/PN were 0.68, 0.46, 0.75, and 0.86, respectively.
Only 8 patients had a PTG of 3 or 4. RM dose adjusted for FLT3-L versus 1/PN for these patients resulted in a correlation coefficient of 0.85. FLT3-L–adjusted TB dose, administered activity, and administered activity per unit body weight versus 1/PN resulted in correlation coefficients of 0.81, 0.14, and 0.60, respectively. The other 22 patients had grade 0 to grade 2 platelet toxicities; adjusted RM dose versus 1/PN for these patients resulted in a correlation coefficient of 0.18. Adjusted TB dose, administered activity, and administered activity per unit body weight versus 1/PN resulted in correlation coefficients of 0.33, 0.42, and 0.27, respectively.
The FLT3-L–adjusted red marrow doses, using the male MIRDOSE3 model, Equation 3, and a CF of 0.3, were compared with the FLT3-L–adjusted administered activities per unit body weights and unadjusted red marrow dose as predictors of grade 3 or higher toxicity by determining sensitivity, specificity, accuracy, positive predictive value (PPV), and negative predictive value (NPV). Using a threshold value of 200 cGy for the adjusted red marrow dose (this threshold, as well as the others below, was based on the data and represents the approximate lowest value at which any grade 3 or grade 4 toxicities occurred), there were 8 true-positives, 0 false-negatives, 2 false-positives, and 20 true-negatives, resulting in a sensitivity, specificity, accuracy, PPV, and NPV of 100%, 90.9%, 93.3%, 80%, and 100%, respectively. Although the number of patients with grade 3 or higher hematologic toxicity was low (n = 8), there were 22 patients who did not develop grade 3 or higher toxicity; in these patients there were no false-negatives, but 20 true-negatives. Using a threshold value of 100 cGy for red marrow dose by itself, there were 8 true-positives, 0 false-negatives, 13 false-positives, and 9 true-negatives, resulting in a sensitivity, specificity, accuracy, PPV, and NPV of 100%, 40.9%, 56.7%, 38.1%, and 100%, respectively. Using a threshold value of 74 MBq/kg for the adjusted activity per body weight, there were 8 true-positives, 0 false-negatives, 6 false-positives, and 16 true-negatives, resulting in a sensitivity, specificity, accuracy, PPV, and NPV of 100%, 72.7%, 80%, 57.1%, and 100%, respectively.
DISCUSSION
The ability to predict the magnitude of myelotoxicity in response to a test dose of RAIT would permit better determination of patient-specific administered activity prescriptions. Red marrow absorbed doses have not been highly predictive of hematopoietic toxicity in RAIT-treated patients (4,5). Although the dose–toxicity relationship is likely to improve as more patient-specific protocols for the calculation of red marrow dose are implemented, more work needs to be done to define the tolerance of patients who have received therapy before nonmyeloablative RAIT. Thus, methods need to be established that reflect more accurately the marrow radiosensitivity in patients, so that the activity prescription for RAIT can be adjusted accordingly.
In previous work (15), it was demonstrated that 13% of the patient population studied experienced significantly less toxicity than was predicted by their marrow dose and 15% of the same population experienced significantly greater toxicity than predicted. Many of these patients have received multiple treatments of external beam radiation therapy or chemotherapy before receiving RAIT. It was postulated that long-term hematopoietic damage from prior cytotoxic therapy might render a patient’s marrow more “brittle” and therefore more radiosensitive to the RAIT dose. Additional tumor-produced cytokines may also be a significant factor influencing the proliferation rate of marrow cells, thereby affecting their response to radiation from RAIT (27). Merging biologic knowledge with calculated radiation dose, Blumenthal et al. (15) further postulated that marrow- or tumor-produced cytokines released into the circulation might be useful in better predicting the magnitude of myelosuppression in response to a particular radiation dose delivered by RAIT. Because bone marrow stromal cells are important sources of cytokines, which participate in regulation of proliferation and differentiation of hematopoietic stem and progenitor cells, it is reasonable to evaluate plasma cytokines as a marker of hematologic damage or function after therapy. Five cytokines were previously considered and FLT3-L emerged as being the one strongly correlated with hematologic toxicity in response to RAIT (15). The other stimulatory cytokine, stem cell factor, and the 3 inhibitory cytokines (macrophage inflammatory protein-1α, tumor growth factor-β, and tumor necrosis factor-α) were not useful on their own at predicting the magnitude of RAIT-induced toxicity.
FLT3-L is a growth factor involved in early hematopoiesis. It is expressed in transmembrane and soluble forms and stimulates or costimulates proliferation and colony formation of hematopoietic myeloid and lymphoid stem or progenitor cells (CFU–GM and CFU–granulocyte-erythrocyte-monocyte-megakaryocyte) in bone marrow, spleen, and peripheral blood (28–30). On the basis of previous findings that FLT3-L was directly related to the magnitude of thrombocytopenia in RAIT-treated patients (15), plasma FLT3-L levels were used to investigate toxicity correlations in patients receiving RAIT of solid tumors. By itself, FLT3-L has weak colony-stimulating activity, but its effect on colony number and size is additive to synergistic when combined with other colony-stimulating factors (CSFs). Therefore, correlations should also be examined using a combined factor that includes results of plasma levels of other cytokines that are additive with FLT3-L at stimulating hematopoiesis (31). In addition, a need still exists to establish a predictive marker for a sizeable number of individuals who experience significantly less toxicity for a given marrow dose of RAIT than was expected.
All of the red marrow dose calculation schemes resulted in essentially the same correlations for a given hematologic toxicity measure. It is important to point out, however, that this study did not focus on comparisons of correlations among these methods. Comparisons between different dosimetry methods should be conducted in controlled patient populations with minimal influence of other possibly confounding biologic factors. In this study, the status of recovery of progenitor cells is likely the major factor influencing the dose–toxicity correlations, as evidenced by the significant improvements in the toxicity predictions after FLT3-L levels were considered. Consequently, it is statistically difficult to make any comments on other factors that may be less significant than the FLT3-L cytokine levels.
Correlations for dose–toxicity were as high as 0.86 between FLT3-L–adjusted radiation dose and the inverse of PN as the measure of hematologic toxicity. Correlations with this latter parameter were much higher compared with all other measures of hematologic toxicity (PTG, PPD, and PN); the correlation coefficients jumped from a range of approximately 0.5–0.8 up to almost 0.9. The use of 1/PN appears to transform the PN–hematologic toxicity predictor curves to the anticipated shape of a dose–response curve (i.e., at low dose limited toxicity is observed followed by increasing toxicity at higher dose in a linear fashion). The classic sigmoid curve was not observed, presumably because of the fact that the calculated dose levels were not high enough to establish the portion of the curve where dose–response levels off. This may explain why linear regression analyses of the 1/PN–hematologic toxicity predictor curves result in the strongest correlations. Further studies are required for confirmation.
The data from this study need to be expanded to a larger patient population to determine the reproducibility of the correlation coefficients and the value of the FLT3-L levels as adjustment factors for improving the prediction of hematologic toxicity. In an expanded study, some possibilities of why the FLT3-L dose adjustments do not provide an even higher dose–toxicity correlation can be addressed. One possibility is the accuracy of the red marrow absorbed dose estimation. Although we have used the best currently accepted dosimetry approaches, even more patient-specific red marrow dose estimates could be developed. It may be necessary to directly determine the cumulated activity in the red marrow because the use of the blood pharmacokinetics in combination with the CF value may not accurately reflect the marrow biokinetics using the current methodology. Given the observed range of patient hematocrits, the red marrow-to-blood activity concentration ratio, CF, varies by only ±20% from a mean of approximately 0.32, so it is not surprising that the results obtained using a fixed CF of 0.3 or a CF = 0.19/(1 − hematocrit) resulted in equivalent dose–toxicity correlations. This is the simplest implementation of this latter correction factor and it is strictly applicable only in patients whose bone marrow has not been compromised by therapy or disease (23). However, it is for the most part generally applied to all patients regardless of their treatment history or bone marrow radiosensitivity. Because many of the patients in this study had prior therapy, a better method for determining CF may be warranted. A variety of approaches could be used to characterize the red marrow biokinetics, including determination of the red marrow cumulated activity from scintillation camera image-based analyses (24), compartmental modeling techniques (32), or use of magnetic resonance spectroscopy to provide a patient-specific estimate of the red marrow extracellular fluid fraction (33). Another possibility that could be addressed in an expanded study is the need for additional FLT3-L measurements. Because only a single measurement was made in this study, it may be important to determine by additional measurements whether the FLT3-L levels are on the rise or in the process of falling from their peak to better predict myelotoxicity.
In this limited patient population, clear distinctions were not found in the correlations between patients with long or short effective half-times in blood. This may explain why the FLT3-L adjustment of total body dose and administered activity per unit body weight correlated with observed toxicity as well as red marrow absorbed dose (the correlations involving administered activity were not as good). When patients were separated in terms of the severity of their bone marrow toxicity (i.e., grade 3 or grade 4 platelet toxicity vs. those patients with a PTG of 0–2), both red marrow and total body dose resulted in stronger correlations than administered activity and administered activity per unit body weight. In addition, FLT3-L–adjusted red marrow dose resulted in higher specificity, accuracy, and PPV compared with adjusted activity per unit body weight and red marrow dose by itself. Furthermore, when using FLT3-L–adjusted red marrow dose as a predictor of hematologic toxicity, there were no false-negatives and 20 of the 22 patients with less than grade 3 toxicity were true-negatives. Thus, radiation dose-based predictors of myelotoxicity should be pursued in lieu of the use of parameters such as administered activity and administered activity per unit body weight in patients who received chemotherapy before RAIT. Because these latter parameters do not account for all patient-specific variables, their use will likely place an inescapable upper limit on the quality of correlations achievable.
The blood-based red marrow dosimetry approaches in this study are justifiable because no patient had bone marrow or bone metastases and the radiolabeled monoclonal antibodies administered do not bind to any blood, marrow, or bone components, with 1 caveat. Patients who are recovering from chemotherapy may have hyperproliferating bone marrow with enhanced radioantibody uptake (34). If such involvement were present, red marrow dosimetry would need to take this into consideration (19). In such patients image-based red marrow dose estimates have been shown to improve predicted severity of myelotoxicity (34,35). It has also recently been claimed that image-based red marrow dose estimates might improve the prediction of toxicity for nonmarrow targeting 90Y antibody therapy (36). This is in spite of the fact that existing image-based red marrow dose models do not explicitly treat the component of dose due to activity uptake in localized areas of the marrow. It might be anticipated that accurate treatment of this dose component would further improve dose–toxicity relationships.
Although total body and red marrow dose had very similar correlation coefficients with hematologic toxicity in this study, further improvements are not likely using total body dose. Red marrow dose models, on the other hand, are currently being made more patient specific. Future studies should strive to calculate the most accurate red marrow dose using patient-specific treatment planning that includes some measure of individual patients’ marrow ability to tolerate additional myelosuppressive treatment, especially in patients who have received chemotherapy before RAIT. As we have demonstrated, this will likely lead to improved predictive dose–toxicity relationships.
Further work needs to be done to explore whether (a) these findings with 131I-labeled antibodies in solid tumor patients are applicable to 90Y-labeled antibodies, especially in other tumors, including lymphoma; (b) plasma levels of other thrombopoietic cytokines alone or in combination with FLT3-L can further improve the correlation between dose and toxicity; and (c) plasma markers that predict unexpectedly low toxicity can be identified.
CONCLUSION
FLT3-L–adjusted red marrow and total body radiation doses provide improved correlations with hematologic toxicity over nonadjusted dose values in patients who received chemotherapy before RAIT. The adjusted absorbed doses provided stronger dose–toxicity correlations than those obtained using simpler empiric parameters, such as administered activity and administered activity per unit body weight. Elevated FLT3-L plasma levels before RAIT may indicate increased radiosensitivity of the bone marrow, and use of this measurement to adjust calculated red marrow or total body radiation doses may provide significantly better prediction of toxicity than radiation dose alone, leading to a patient-specific administered activity prescription that will deliver radiation doses to diseased tissues sufficient to produce an effective treatment outcome at acceptable toxicity levels. Improved methods for red marrow absorbed dose estimates might allow for even better treatment optimization. Further, in those patients identified to be at low risk for toxicity, the administered activity may be increased, potentially leading to a greater treatment benefit. Whether these findings with RAIT apply to other marrow-toxic therapies will need to be answered by additional studies.
Footnotes
Received Mar. 6, 2002; revision accepted Jul. 25, 2002.
For correspondence or reprints contact: Jeffry A. Siegel, PhD, Nuclear Physics Enterprises, 216 Society Hill, Cherry Hill, NJ 08003.
E-mail: siegelja{at}aol.com
REFERENCES
In this issue


Jump to section
Related Articles
Cited By...
- A Self-Assembling and Disassembling (SADA) Bispecific Antibody (BsAb) Platform for Curative Two-step Pretargeted Radioimmunotherapy
- PSMA-Targeted Radionuclide Therapy of Metastatic Castration-Resistant Prostate Cancer with 177Lu-Labeled PSMA-617
- A Compartmental Model of Mouse Thrombopoiesis and Erythropoiesis to Predict Bone Marrow Toxicity After Internal Irradiation
- RADAR Commentary: Evolution and Current Status of Dosimetry in Nuclear Medicine
- Predicting Hematologic Toxicity in Patients Undergoing Radioimmunotherapy with 90Y-Ibritumomab Tiuxetan or 131I-Tositumomab
- A Phase I Clinical Trial of CHT-25 a 131I-Labeled Chimeric Anti-CD25 Antibody Showing Efficacy in Patients with Refractory Lymphoma
- Linear Regression Model for Predicting Patient-Specific Total Skeletal Spongiosa Volume for Use in Molecular Radiotherapy Dosimetry
- Cocaine Cues and Dopamine in Dorsal Striatum: Mechanism of Craving in Cocaine Addiction
- Radioimmunotherapy of Solid Tumors by Targeting Extra Domain B Fibronectin: Identification of the Best-Suited Radioimmunoconjugate
- Lack of Efficacy of Two Consecutive Treatments of Radioimmunotherapy With 131I-cG250 in Patients With Metastasized Clear Cell Renal Cell Carcinoma
- Blood-Based Red Marrow Dosimetry: Where's the Beef?
- Radioimmunotherapy of Prostate Cancer: Does Tumor Size Matter?
- Planning Time for Peripheral Blood Stem Cell Infusion After High-Dose Targeted Radionuclide Therapy Using Dosimetry
- Radioimmunotherapy of Non-Hodgkin's Lymphoma Revisited
- Dosimetry of Internal Emitters
- Perspectives on Cancer Therapy with Radiolabeled Monoclonal Antibodies
- Bone Marrow Dosimetry Using Blood-Based Models for Radiolabeled Antibody Therapy: A Multiinstitutional Comparison
- Radioimmunotherapy of Non-Hodgkin's Lymphoma with 90Y-DOTA Humanized Anti-CD22 IgG (90Y-Epratuzumab): Do Tumor Targeting and Dosimetry Predict Therapeutic Response?