


Abstract
Standardization of marrow dosimetry is of considerable importance when estimating dose–response for a multicentered clinical trial involving radionuclide therapy. However, it is only within the past five years that the intercomparison of marrow dosimetry results among separate clinical trials that use the same agent has become scientifically feasible. In this work, we have analyzed reported marrow dosimetry results from radioimmunotherapy trials and recalculated marrow absorbed doses at a central facility using a standard blood model with patient-specific source data. The basic approach used in the American Association of Physicists in Medicine (AAPM)/Sgouros marrow dosimetry methodology was common to calculation performed at all participating institutions, including the central facility. Differences in dose estimates associated with starting assumptions and the exact implementation of the AAPM/Sgouros calculation methodology used by the source institutions and the central facility were quantified and compared. Methods: Data from 22 patients enrolled in radiolabeled antibody clinical trials were randomly selected from 7 participating institutions for the assessment of marrow dose. The analysis was restricted to those patients who were treated with 131I- or 186Re-labeled antibody and had no marrow involvement. Calculation of bone marrow dose at each participating institution was unique to the trial or institution, but all used some form of the AAPM/Sgouros blood model approach. The central facility adopted a marrow dosimetry model based on the AAPM/Sgouros model for radiolabeled antibodies using the standard MIRD approach to the remainder-of-body contribution. A standardized approach to account for variations in patient mass was used for the remainder-of-body component. To simplify clinical implementation, regional marrow uptake and time-dependent changes in the marrow-to-blood concentration ratio were not included. Methods of formatting the collection of standard datasets useful in defining dose–response parameters are also presented. Results: Bone marrow doses were calculated according to the method described for each of the 22 patients based on the patient-specific data supplied by the participating institutions. These values were then individually compared with the marrow doses originally reported by each institution. Comparison of the two calculation methods was expressed as a ratio of the marrow doses for each patient. The mean ratio for the dose estimates at the participating institution calculation compared with the central laboratory value was 0.920 ± 0.259 (mean ± SD), with a range from 0.708 to 1.202. Conclusion: The independent use of the AAPM/Sgouros method blood model approach to marrow dosimetry has brought these dose estimates to within 30% of the results obtained centrally compared with substantially higher uncertainties reported previously. Variations in calculation methodology or initial assumptions adopted by individual institutions may still contribute significant uncertainty to dose estimates, even when the same data are used as a starting point for the calculation comparison shown here. A clinically relevant, standard method for marrow dosimetry for radiolabeled antibodies is proposed as a benchmark for intercomparison purposes. A parameter sensitivity analysis and a summary discussion of the use of this model for potentially improving dose–response data correlation are also presented.
As more radiopharmaceuticals for therapy progress through translational development to regulatory approval, a convenient standard measure or metric to estimate dose–response relationships becomes important in determining therapeutic and commercial efficacy. Presently, there is controversy about whether this metric should be specified by generic, preadministration parameters (e.g., activity per kg or m2) or more patient-specific measurements (e.g., the total-body clearance of the radiopharmaceutical, the total-body absorbed dose, or the red marrow absorbed dose). If the former is used, no correction for patient-specific clearance is applied and this may result in a metric that demonstrates increased variability with response (i.e., under treatment or excessive toxicities). To allow intercomparison of dose versus response across studies, it is important to use a standardized method of estimating absorbed dose. These methods should be relatively practical to implement yet should incorporate enough detail to be valuable in predicting dose–response relationships. This is particularly important since improvements in the patient risk-to-benefit ratio would justify the additional resources for acquiring data needed for dosimetry.
The red marrow is usually the dose-limiting organ in targeted radionuclide therapy when large carrier molecules (e.g., antibodies) are used in a nonmyeloablative setting (1,2). With agents that do not target marrow, the blood model has been used to estimate marrow absorbed dose with increasing consistency (1–4). In this report, patient data from 7 institutions have been collected and analyzed using a single analytic method at a central facility. These data are from 5 different radiolabeled antibody therapy trials for the treatment of lymphoma, colon, ovarian, and prostate carcinoma using either 131I or 186Re. A standard marrow dose calculation based on the American Association of Physicists in Medicine (AAPM)/Sgouros blood model (5,6) using readily available patient-specific parameters has been adopted. The parameters captured on a data collection form include patient weight, height, hematocrit (HCT), blood clearance, age, sex, and prior therapy. Improvements in the marrow dose–response correlation have been reported when some of these patient-specific parameters have been considered (1–4,7–10). The current method was adopted to provide a practical method of computing marrow dose from patient-specific data. It was not our intention to provide a model that included a sophisticated treatment of all possible model refinements. Rather, this computational methodology can be used as a relatively practical benchmark for intercomparison of marrow dose estimates between institutions using similar compounds under clinical trial conditions. It can also be used as a comparative tool to show improvements in dose–response correlations when new marrow dosimetry models are introduced or as an absolute comparison across trials for different radiopharmaceuticals when a marrow dose–response and the appropriate patient-specific data are provided.
MATERIALS AND METHODS
Marrow Dose Equations
Two options currently exist for measurement of cumulated activity in red marrow, ÃRM: direct in vivo imaging of skeletal regions with high red marrow concentrations or indirect assessments via measurements of activity in circulating blood. For the latter, one first measures the mass concentration of blood activity in the patient as a function of time, [A(t)]bl. This measurement can alternatively be expressed as the normalized blood activity concentration, [A(t)]bl/A0, where A0 is the administered activity to the patient (11). The total cumulated activity in blood is thus obtained as:
 Eq. 1 where Mbl–patient is the total blood mass within the patient. This expression assumes a blood density of 1,000 kg/m3. According to the theoretic and experimental considerations outlined in Siegel et al. (5) and Sgouros (6), the mass concentration of activity in marrow is directly proportional to the measured mass concentration of activity in blood when that activity is subject to nonspecific uptake within the skeletal tissues:
 Eq. 2 where RMECFF is the red marrow extracellular fluid fraction. A nominal value of 0.19 has been proposed for the RMECFF. Equation 2 assumes that the red marrow–to–blood activity concentration ratio is constant; recent studies indicate that this value may be time dependent (2,12). Time integration of Equation 2 and substitution by Equation 1 gives an expression of the cumulated activity in red marrow as needed to perform dosimetry under the MIRD schema:
 Eq. 3 where both mass estimates may be patient specific and MRM–patient is defined as the mass of the red marrow in a specific patient. As these values are difficult to assess directly in the patient, one may approximate them from the whole-body masses of Reference Man and the patient, respectively (13):
 Eq. 4 and
 Eq. 5 where both mass estimates may be patient specific. MRM–MD11, MWB–MD11, and MWB–patient are defined as the mass of the red marrow and mass of the whole body for standard Reference Man and the patient-specific whole-body mass, respectively.
A reduced form of Equation 3 is thus found after substitution by Equations 4 and 5, and then by Equation 1:

 Eq. 6
Eq. 6
The absorbed dose to red marrow can now be estimated using the MIRD schema in which contributions from activity localized in the marrow tissues (self-dose) and in the remainder tissues of the body (cross-dose) are considered separately:

 Eq. 7 where S(RM←RM)patient and S(RM←RB)patient are the S factor for red marrow to red marrow and the remainder of body to red marrow for specific patients, respectively. The assignment of radionuclide S values in both terms of Equation 7 can be made approximately patient specific by scaling standard S values for Reference Man using ratios of tissue masses unique to the individual patient:


 Eq. 8
Eq. 8

 Eq. 9a or by substitution using Equation 4:
 Eq. 9b Final expressions for both the self-dose and cross-dose to red marrow are attained via substitution of Equations 6, 8, and 9b into both components of Equation 7:
 Eq. 10

 Eq. 11
The cross-dose term in Equation 11 provides for the dose received by the red marrow from sources of activity distributed in the remainder of the body. For pure β-emitting radionuclides such as 90Y and 32P, this term is either negligible or very small (e.g., bremsstrahlung radiation). However, if the radionuclide has a substantial γ-ray component to its emission spectrum, as is the case for 131I, this cross-organ irradiation term may become significant.
The marrow mass for this term also must be explicitly evaluated and scaled as shown in Equation 11. This derivation assumes whole-body mass is an appropriate quantity to use in scaling. Other anthropometric factors might include lean body mass, body surface area, or body height. Further scaling of the S values for patient-specific data are considered second-order corrections and are not included in the above derivation.
Finally, alternative expressions for both the self-dose and cross-dose can also be made in terms of the time-integrated blood activity concentration, [Ã]bl (kg−1), via substitution again of Equations 1 and 5 within Equations 10 and 11. In these reduced expressions, the patient’s whole-body mass now appears in only cross-dose term:
 Eq. 12

 Eq. 13
Database Description
For each patient entered into the database for this study, the institution completed a separate electronic data sheet. The data forms were divided into 4 sections: (a) general demographic patient information (age, sex, weight, height, body surface area, primary diagnosis, disease stage, HCT), (b) pharmacokinetics (radionuclide, administered activity, time–activity data for blood and total-body uptake and clearance), (c) observed toxicity (platelets, white cell count, absolute granulocytes, hemoglobin toxicity grade, baseline and nadir values, and time to nadir), and (d) bone marrow status (results of marrow biopsy, past chemotherapy, radiation and radionuclide therapy with full description of administered doses and chronology of treatment). Patients of all ages were entered into the database (adults, 36–83 y old), and all patients had no marrow involvement as measured by bilateral bone marrow biopsy. Patient primary disease types included colorectal, ovarian, lymphoma, and prostate carcinoma. For this work, only data from sections (a) and (b) were used for the computation of marrow dose estimates. Sections (c) and (d) were included here to provide the investigator with a suggested format of data collection when response outcomes were of interest. Data entry forms were rejected if only items (a) and (b) were incomplete. The participating institution had the choice of filling in the form either on hard copy or by an electronic spreadsheet. All data were converted to the electronic form and stored on CD ROM. No standardization of methods for collection and counting of blood samples between participating institutions was performed. Each institution provided blood activity concentration versus time for a minimum 5 data points per patient as shown in Figures 1A–1D. Participating institutions were also asked to provide only effective half-life (t1/2eff) for the total body. These data were acquired from total-body counting, either by total-body imaging methods or by external probe measurements as outlined in MIRD Pamphlet No. 16 (14). No standardization or specific calibration methods were required for measuring these data between institutions, and data were accepted as submitted. These clinical sites then calculated the absorbed dose to the bone marrow according to a calculation method acceptable to them. All institutional absorbed dose values were provided directly to the central facility by the principal investigator via the data collection form. No specific selection criteria were used to include or exclude an institution from submitting data to the central facility, except that the clinical trial had to conform to institutional review board and U.S. Food and Drug Administration guidelines. However, all institutions entered into this multiinstitutional study were using a blood-based calculation model similar to the work published by Siegel et al. (5) or Sgouros (6). The blood clearance data were then reanalyzed using the methodology presented here.
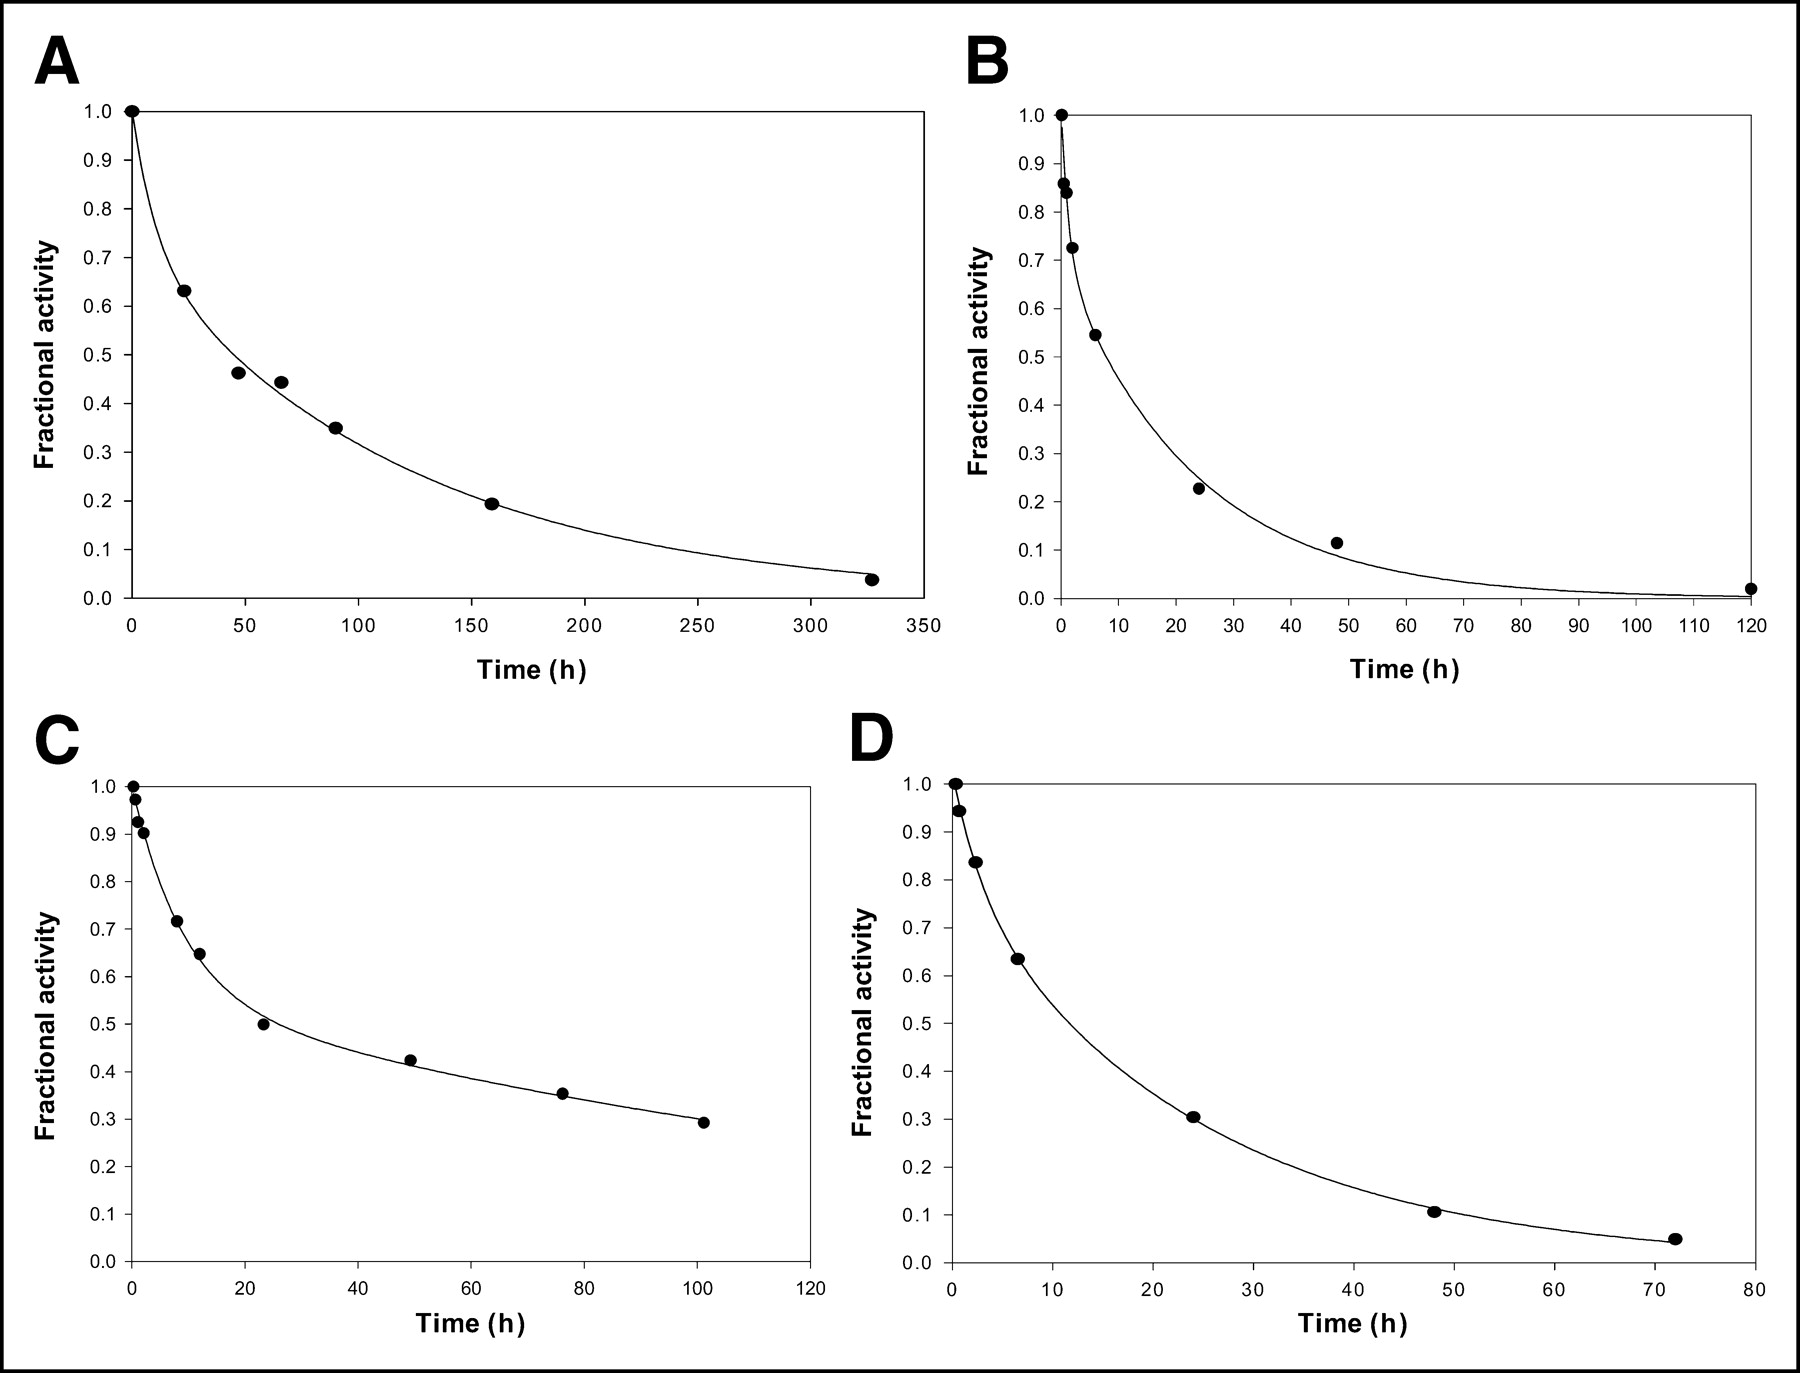
(A–D) Biphasic clearance of blood activity vs. time was plotted for the 4 patients listed in Table 1: patients A1 (A), B2 (B), F1 (C), and G1 (D).
Table 1 shows sample patient data for the first randomly selected subject entered into the dataset from 4 of the 7 participating institutions. These data are used to complete the information required to calculate the patient-specific absorbed dose from the blood time–activity measurements using Equations 10 and 11. Figures 1A–1D show activity-versus-time plots for the uptake and clearance of the radiopharmaceutical in the whole blood from 4 patients randomly selected from the 22 patients included in the dataset. Input of data into Table 1 is divided into 3 classifications of information: Rows 1–6 list the patient information entered directly from the data sheet supplied by each institution; rows 7–24 are calculated, derived values or dosimetric constants; and rows 25 and 26 provide some measures of patient responses. The calculations of marrow dose shown in Table 1 were based on entering or calculating quantities in an Excel (Microsoft) spreadsheet coded for Equations 10 and 11. Briefly, from the blood time–activity data that were normalized to 37 MBq (1 mCi) at time zero, the area under the measured time–activity curve (AUC) was numerically calculated to the last time point. This component of the AUC was added to the AUC derived by fitted extrapolation of the time–activity curve. A 2-component exponential expression was fit (Sigma-Plot; Micrographics) to the measured data, and the β-component of this curve was integrated analytically to yield the AUC beyond the last measured data point. The sum of the numerically calculated and analytically integrated AUCs gave the total AUC. It was found that most of the blood data closely followed a biexponential expression with a statistical significance of P ≤ 0.01. Counting statistics for blood samples showed uncertainties associated with each measurement to be <3%. A biologic t1/2 was calculated using this total AUC blood data value and, similarly, a t1/2eff was derived after taking the physical t1/2 into account. Hence, a residence time for the blood was computed individually for each patient. Ãrm was calculated according to the concentration and scaling factors introduced in Equation 3 and, similarly, the Ãwb was derived from the t1/2eff values provided for each patient. Absorbed dose for the marrow was computed directly with entry of the total administered activity, the appropriate S values with patient-specific mass scaling according to Equations 10 and 11. A sample calculation is included in the Results section to enable the reader to calculate cumulated activities from Figures 1A–1D, implement the use of Equations 10 and 11, and show how the ratio between the institution dose value and the core laboratory was derived.
Multiinstitutional Bone Marrow Data (131I Only)
In addition, a parameter sensitivity analysis was performed for 8 of the independent variables and measured constants: administered activity, RMECFF, HCT, MWB, Ãbl, ÃWB, S(RM←RM), and S(RM←WB). Parameter values were varied by 10%–200% of their original value for a sample patient, selected from institution B and treated with 131I-labeled antibody. For several parameters, the range was constrained to be within a physiologic realm (e.g., 10%–60% in the HCT and 5–150 kg in MWB). The sensitivity of red marrow absorbed dose values Dself, Dcross, and Dtotal to changes in each parameter was either briefly described or depicted graphically depending on whether the relationship between variables was deemed complex.
RESULTS
An example dose calculation using Equations 10 and 11 is shown using the data from patient 2 of institution B (B2) given in Table 1. For this patient, the cumulated activity in blood, Ãbl, was calculated to be 68,200 MBq-s per MBq administered. The cumulated activity in the whole body, ÃWB, was calculated to be 165,000 MBq-s per MBq administered. This patient was administered 5,160 MBq of 131I-labeled antibody. The HCT was measured at 39.6% and the individual’s total mass was 67.7 kg. Institution B computed an absorbed dose to red marrow of 89.2 cGy for this patient, whereas the central facility computed a value of 88.9 cGy. The dose ratio (institution value/central facility value) for this entry is thus 1.003.
Table 2 contains the summary of results for 22 patients first analyzed at the institution where the measurements were taken. The average result for all patients from each institution was compared with the central facility–derived value and is given as a dose ratio in Table 2. A simple mean value of all institutions was derived using the average dose ratio from each institution. The intention of this study was to estimate the deviation of the calculation methods used by each institution compared with the central facility. Inherently, no single institution was presumed to have an optimized method regardless of the number of patients accrued into this study. The number of patients accrued did, however, affect the statistical uncertainty associated with each cohort and was reflected in the SDs quoted for each institution as well as for the overall dose ratio average. For example, institution E contributed 10 patients to this evaluation and also had the highest dispersion in its results relative to the central facility. Upon closer examination in this particular case, a substantial portion of the uncertainty was traced back to 2 of the 10 patients. These patients were not considered to be statistical outliers and were still included in the analysis.
Multiinstitutional Comparison of Bone Marrow Dosimetry Results
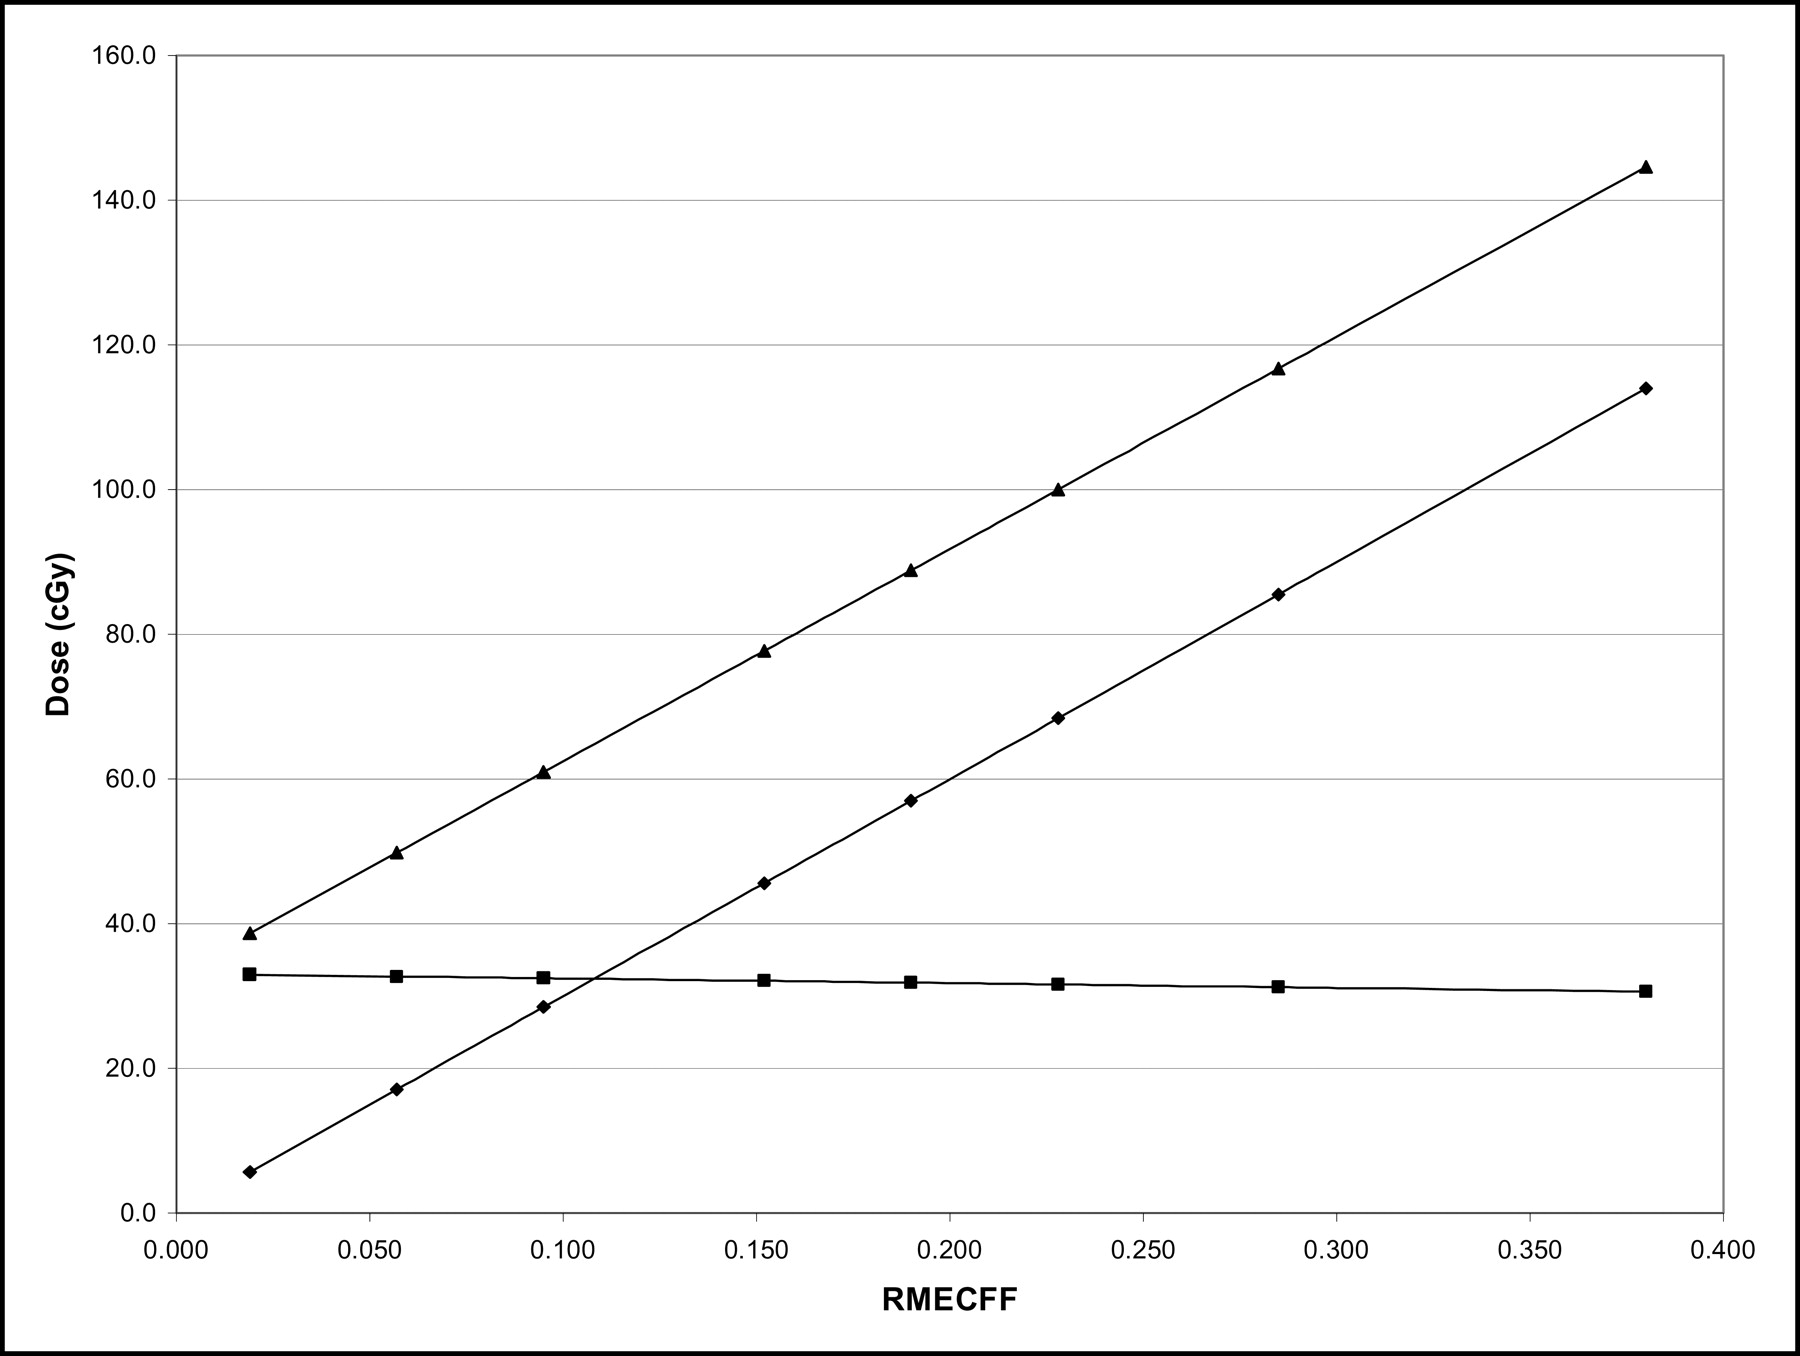
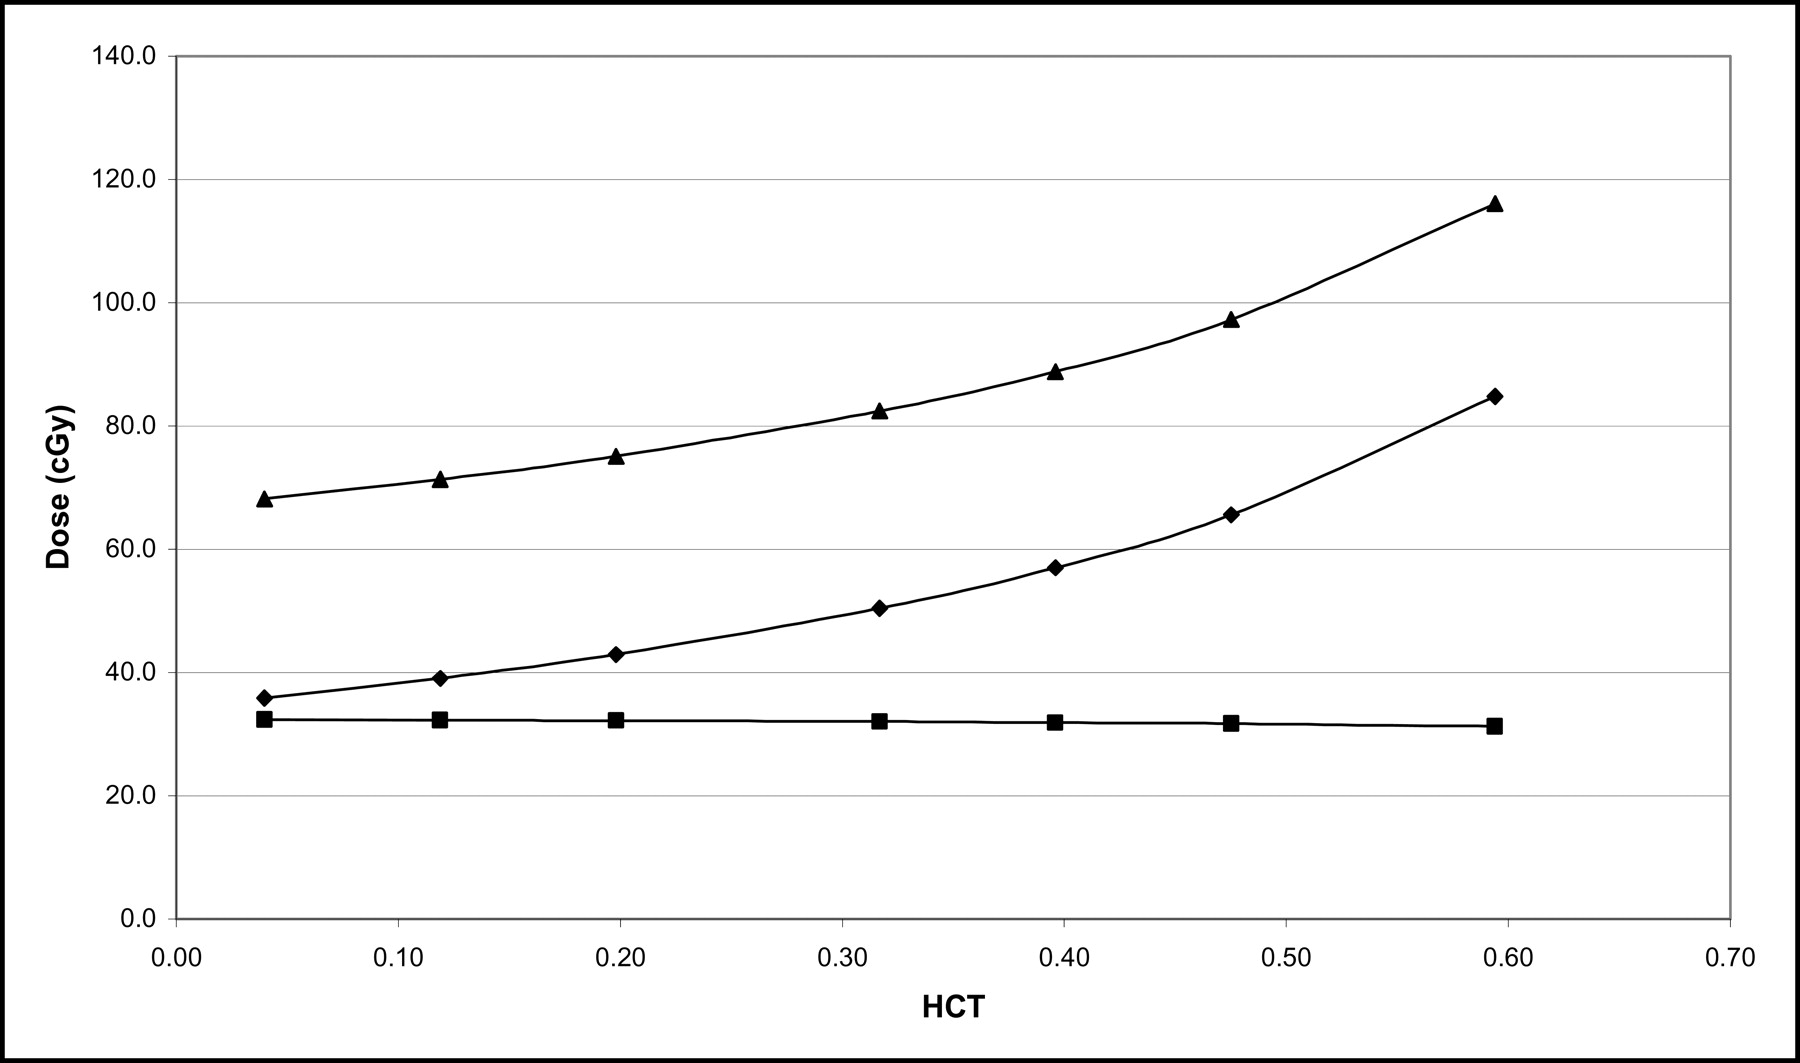
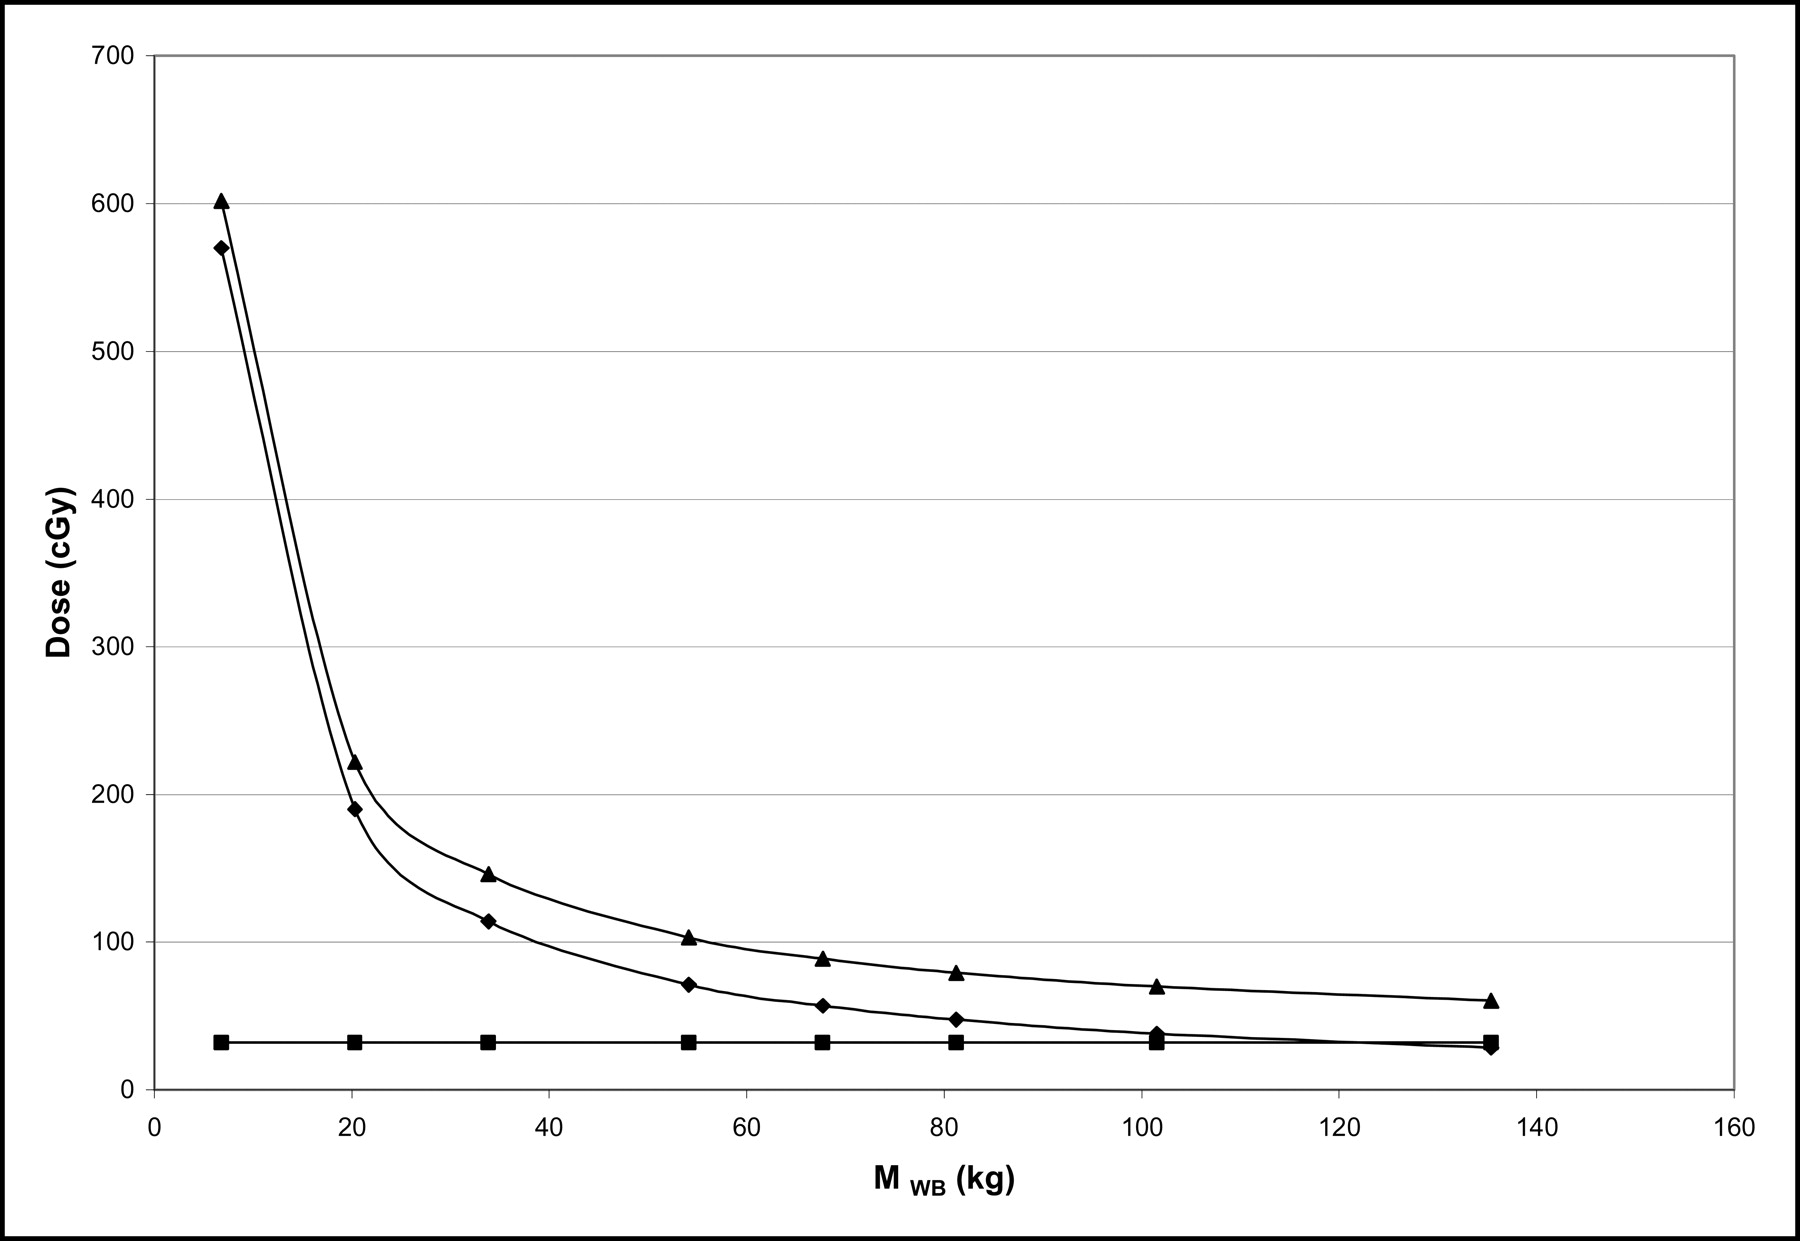
Results of sensitivity analysis indicated that the increase of administered activity results in a linear increase in the total absorbed dose. As expected, all quantities plotted (total dose, self-dose to marrow, and cross-dose to marrow) exhibit this same direct increase with activity. Parameters such as RMECFF (Fig. 2), HCT (Fig. 3), and Ãbl affect the total dose mostly through the self-dose term. Conversely, the quantities ÃWB and S(RM←WB) affect the total marrow dose through the cross-dose term. Parameters including MWB and S(RM←RM) affect the total dose in a complex manner either by increasing the self-dose exponentially as MWB goes to zero (Fig. 4) or by having the opposite effect on the self- and cross-dose when S(RM←RM) is varied in the marrow dose equation (Fig. 5).

Plot of absorbed dose vs. RMECFF when RMECFF was allowed to vary from 0.02 to 0.38. Dself (⧫) and Dtotal (▴) showed linear increase with RMECFF where Dcross (▪) was unaffected.
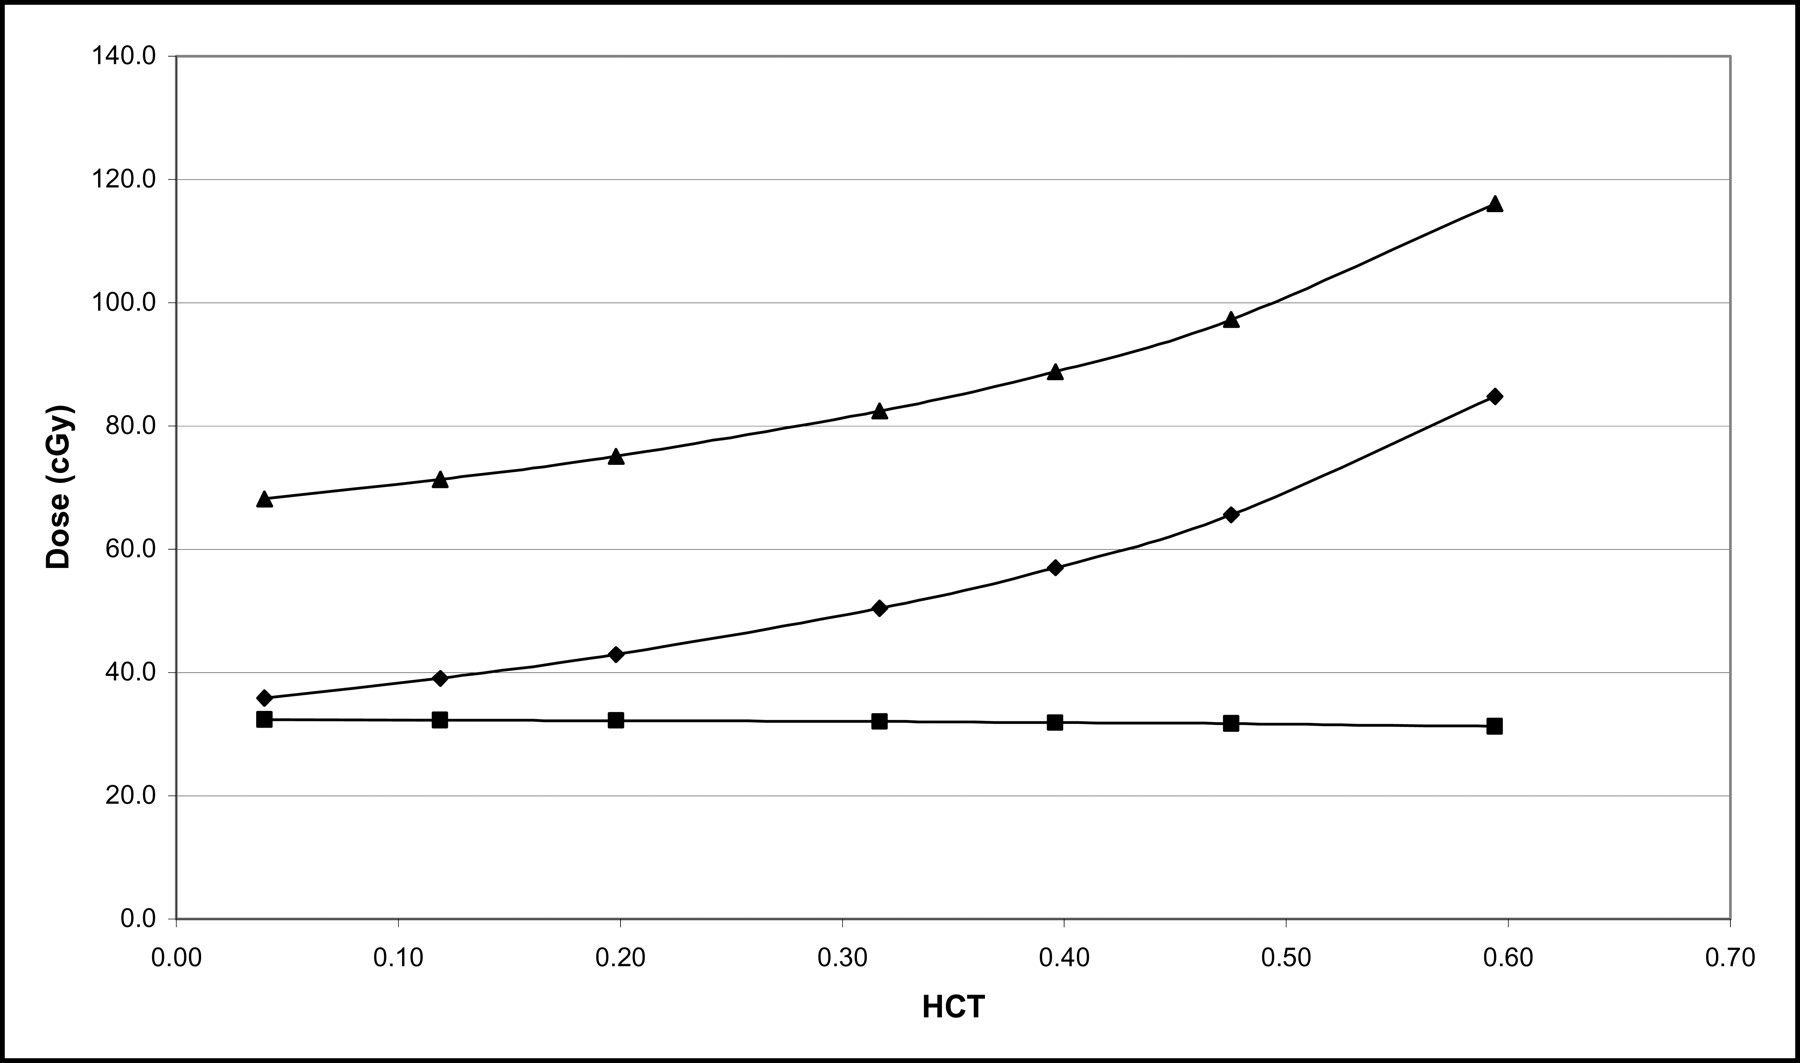
Plot of absorbed dose (Dself [⧫] and Dtotal [▴]) vs. HCT showed nonlinear increase in dose with increasing HCT. Dcross (▪) is relatively unaffected.

Rapid decrease in Dself (⧫) and Dtotal (▴) was plotted as MWB is allowed to increase to 135 kg. No effect on Dcross (▪) was observed.

Plot of absorbed dose vs. increasing values of S(RM←RM). S(RM←RM) was shown to have direct relationship with Dself (⧫) and inverse relationship with Dcross (▪), resulting in net increase in Dtotal (▴).
DISCUSSION
We report that the relative value of the marrow dose computed by the central facility compared with the values reported independently by the contributing institution using similar, but not identical, methods have an average variation of −8% (range, −29% to +20%). This is significant since previously the variability for marrow dose computation was up to 700% in the 1980s and still 200% in the 1990s (5). With the application of identical methodology among institutions, a more consistent dose–response metric may be obtained. It is also remarkable to note that, even though these independent participating institutions have adopted the basic AAPM/Sgouros blood model method to calculate marrow doses, there was still variability across institutions in how the generalized blood-based model was implemented. Possible sources of variability include the use of different fitting routines and fitted parameter estimates in estimating the AUC for blood and whole-body time–activity curves, the use of different values for phantom masses and S values, and also calculation or programming error. At a more fundamental level, there was no assurance that each participating institution used a mathematically identical method for applying these marrow dose equations in terms of patient-specific mass or the remainder-of-body corrections. No attempt was made to reanalyze data from these patients at the institution since these were the results reported either to governmental regulatory agencies or in the open literature.
Our approach simply involves the collection of blood samples and basic patient-specific data that are readily available from the patient’s chart information. Dose calculation methods for bone marrow with patients receiving radiolabeled antibody therapy, and who do not have specific targeting of marrow elements, are becoming standardized (1–11). The significance of this standardization is paramount when embarking on dose quantification efforts associated with conducting a multicentered clinical trial for new radionuclide therapies. The lack of uniformity in organ dosimetry has been a substantial hindrance to analysis and interpretation of results submitted to government regulatory agencies (e.g., U.S. Food and Drug Administration). This nonuniformity extends to the dosimetric results reported from multicentered trials using the same agent as administered under a single protocol or to results reported by several independent clinical trial sponsors using a similar class of agents. Due to this lack of common methodology and the complexities of patient-specific dosimetry, many investigators have opted instead to simply use an administered activity–based dosing metric (15).
However, as shown in this work, the methods outlined by Siegel et al. (5) and Sgouros (6) for marrow dose calculation have become widely adopted as a generalized approach for many institutions performing clinical trials. Investigators have been using these methods directly or perhaps deriving similar models that are mathematically similar to what is being proposed here (1,11). Therefore, significant uncertainties (>50%) associated with marrow dosimetry are no longer due to the use of vastly different calculation models or initial assumptions of clinical trial investigators performing the calculations, as was the case in the past 2 decades. Present-day sources of uncertainty are more likely to be dependent on the variability associated with biologic data, the inadequacies of current models to accurately describe the clinical reality, and variations in the standard blood model methodology adopted by individual investigators. The experience in external beam therapy suggests that absorbed dose is the best predictor of biologic response. In radionuclide therapy, an administered activity-based prescription regimen should yield results that depend on differences in clearance kinetics among different patients. Since patient pharmacokinetics are incorporated in the absorbed dose estimation, this particular variable is removed when an absorbed dose–based prescription is used in targeted radionuclide therapy.
Nevertheless, the fine tuning of the blood model using an identical initial dataset still has resulted in relative uncertainties in dose estimates in excess of the 5% limit that is the external beam dosimetry norm. These blood model development efforts have included corrections to the marrow mass by scaling to body weight, height, or lean body weight and are still areas of active investigation. Bone and marrow dose models have undergone recent revision (16,17) that has provided for new S values and methods to modify the marrow dose equation further. It also has been shown that uncertainties may be introduced in the absolute specification of absorbed dose using the MIRDOSE3 (18) S values or MIRD Pamphlet No. 11 S values (13) or through the remainder-of-body correction term (Eq. 9) (19). To further illustrate the comparison of calculation marrow dose estimates using different methodologies, if the MIRDOSE3.1 (18) Reference Man masses (MWB, 73.7 kg; MRM, 1.12 kg) and S factors were to be used in evaluating patient data in Table 1, the computed dose to marrow would be 12% less than that using MIRD Pamphlet No. 11 values. The wide-scale distribution and acceptance of the MIRDOSE3.1 program in radiation dose estimate reports and product package inserts may lead to “benchmarking” from these MIRDOSE3.1 values. Efforts by Stabin and Siegel (16) to disseminate generally accepted S values for hundreds of radionuclides through the use of a Web-based Internet site has assisted in a more efficient electronic method to transport these large databases to individual users worldwide. In any case, whether MIRD Pamphlet No. 11, MIRDOSE3.1, or future refined values for S factors and masses are adopted, the necessity for using the same calculation methodology in a multicentered clinical trial to assess marrow dose–response will remain of primary importance in reducing dose estimate uncertainties.
The blood-based dosimetry approach implemented in this work requires the conversion of cumulated activity concentration to total cumulated activity in the red marrow. In another approach, Shen et al. (11) used the concept of fractional specific blood activity and concentration of the cumulated radioactivity in the blood (Eqs. 1 and 2) to develop an expression in which it is not necessary to include the patient-specific mass of the marrow to calculate a marrow dose. It relies on deriving the electron absorbed fractions from the MIRD tables, assuming that only self-dose to marrow is from electron irradiation and that all cross-irradiation terms come from the total body as a single source. They show that, in a clinical database of 84 patients receiving radiolabeled antibody from either 131I or 67Cu irradiation, the error associated with these assumptions varied from 3.9% to 9.1% compared with using individual organs as sources. The elimination of the necessity of using specific marrow mass in the calculation of marrow dose is gaining appeal, although simple scaling of marrow mass by weight of the patient to Reference Man usually corrects for the major uncertainties associated with the calculation of marrow dose (11).
Further improvements to patient-specific dosimetry models may lead to higher correlation coefficients for these dose–response data (9–11) with or without marrow targeting. Additionally, in the development of new agents that show specific targeting to marrow elements, different methods of marrow dosimetry should be explored to account for concentrations of active red marrow being regionally dependent on the age (20), past treatment history (8,21), and specific marrow localization mechanisms (22). A standardized approach should also be developed for radiolabeled small molecules, where a higher concentration in the marrow is expected compared with large radiolabeled antibodies.
A sensitivity analysis highlighting changes to patient-specific parameters that contribute to marrow dose, such as the percentage of marrow involvement with disease or specific localization, was performed by Stabin et al. (22). They studied the effect of variations in total-body/blood cumulated activity ratios, subject body mass, or marrow mass on final dose estimates and also showed that if additional sources of red marrow dose are present, the blood-based methodology will significantly underestimate red marrow dose, especially for 90Y-labeled tumor-targeting agents. The sensitivity analysis (Figs. 2–5) performed in this work has focused more on the relationship between the 8 parameters used in Equations 10 and 11 and the variation in the overall marrow dose. This sensitivity analysis for these measured or calculated parameters also can help with the assessment of uncertainties in the final dose specification for marrow. The analysis also includes the separation into self-dose and cross-dose components, which can be useful in extending this analysis when the marrow is irradiated by radionuclides with different emission properties.
Improved accuracy of marrow dose estimates should result in improved dose–response relationships with marrow toxicity and may allow patient-specific treatment planning. However at present, there is a dearth of standardized recommendations (23) regarding the use of individual patient characteristics to adjust the dosing protocol to avoid hematologic toxicity. For radioimmunotherapy of non-Hodgkin’s lymphoma with 131I-B1 (Bexxar; GlaxoSmithKline) (24) and 90Y-Y2B8 (Zevalin; Biogen Idec) (15), where the targeted dose uses the patient-specific approach or the dosing is based on body size, the approach adopted is to lower the target whole-body dose or dosage (respectively), if the baseline platelet count is <100 × 106 per milliliter of blood, or for patients with a prior bone marrow transplant because of increased hematologic toxicity in these patient groups.
CONCLUSION
The bone marrow is a highly complex organ. Its widespread distribution throughout the body makes activity quantitation within this organ difficult. The use of blood to derive red marrow activity concentration in a model-dependent manner has led to significantly different estimates of marrow concentration for a given patient. Standardization of a practical model for use in clinical trial dosimetry is a good first step in consistent reporting and interpretation of marrow dosimetry.
Though a more comprehensive discussion of the factors influencing radionuclide therapy dose–response for many normal organ systems remains outside the specific aims of this current standardization effort, we are encouraged that relative patient-specific marrow reserve classification criteria as cited here will further delineate the factors affecting response. The implementation of standardized calculation methodology on a more widespread basis using a mathematically identical method as a benchmark for the direct intercomparison of clinical trial marrow dose estimates should ultimately improve these dose–response correlations.
Acknowledgments
The authors thank the MIRD Committee for review and discussion of this manuscript over the past several years. This research was supported in part by National Cancer Institute (NCI) CA96441, NCI CA47829, NCI CM 87215, and MO1 RR 00032 and by Alpha Therapeutics Corp. The working group is appreciative of the patient data made available by the Garden State Cancer Center (Drs. Robert Sharkey and David Goldenberg) and for the dose estimates derived by Darell Fisher, PhD, for the Virginia Mason Medical Center patients. We also thank Yuxia Zhang for her assistance with the tables, figures, and data analysis.
Footnotes
Received Feb. 7, 2004; revision accepted Apr. 29, 2004.
For correspondence or reprints contact: Barry W. Wessels, PhD, Department of Radiation Oncology, Lerner Tower B-181, University Hospitals, Case Western Reserve University, 11100 Euclid Ave., Cleveland, OH 44106.
E-mail: vbneone{at}aol.com
REFERENCES
In this issue


Jump to section
Related Articles
Cited By...
- Dosimetry Software for Theranostic Applications: Current Capabilities and Future Prospects
- 177Lu-Labeled Albumin-Binder-Conjugated PSMA-Targeting Agents with Extremely High Tumor Uptake and Enhanced Tumor-to-Kidney Absorbed Dose Ratio
- Preclinical Characterization of the Radioimmunoconjugate 111In or 90Y-FF-21101 Against a P-Cadherin-Expressing Tumor in a Mouse Xenograft Model and a Nonhuman Primate
- Safety, Pharmacokinetics, and Dosimetry of a Long-Acting Radiolabeled Somatostatin Analog 177Lu-DOTA-EB-TATE in Patients with Advanced Metastatic Neuroendocrine Tumors
- Long-Term Hematotoxicity After Peptide Receptor Radionuclide Therapy with 177Lu-Octreotate
- Bone Marrow Dosimetry Using 124I-PET
- A Phase I Clinical Trial of CHT-25 a 131I-Labeled Chimeric Anti-CD25 Antibody Showing Efficacy in Patients with Refractory Lymphoma
- High-Dose Radioimmunotherapy with 90Y-Ibritumomab Tiuxetan: Comparative Dosimetric Study for Tailored Treatment
- Blood-Based Red Marrow Dosimetry: Where's the Beef?
- Dosimetry of Internal Emitters