


Abstract
Metabolic processes studied by PET are quantified traditionally using compartmental models, which relate the time course of the tracer concentration in tissue to that in arterial blood. For liver studies, the use of arterial input may, however, cause systematic errors to the estimated kinetic parameters, because of ignorance of the dual blood supply from the hepatic artery and the portal vein to the liver. Methods: Six pigs underwent PET after [15O]carbon monoxide inhalation, 3-O-[11C]methylglucose (MG) injection, and [18F]FDG injection. For the glucose scans, PET data were acquired for 90 min. Hepatic arterial and portal venous blood samples and flows were measured during the scan. The dual-input function was calculated as the flow-weighted input. Results: For both MG and FDG, the compartmental analysis using arterial input led to systematic underestimation of the rate constants for rapid blood–tissue exchange. Furthermore, the arterial input led to absurdly low estimates for the extracellular volume compared with the independently measured hepatic blood volume of 0.25 ± 0.01 mL/mL (milliliter blood per milliliter liver tissue). In contrast, the use of a dual-input function provided parameter estimates that were in agreement with liver physiology. Using the dual-input function, the clearances into the liver cells (K1 = 1.11 ± 0.11 mL/min/mL for MG; K1 = 1.07 ± 0.19 mL/min/mL for FDG) were comparable with the liver blood flow (F = 1.02 ± 0.05 mL/min/mL). As required physiologically, the extracellular volumes estimated using the dual-input function were larger than the hepatic blood volume. The linear Gjedde–Patlak analysis produced parameter estimates that were unaffected by the choice of input function, because this analysis was confined to time scales for which the arterial-input and dual-input functions were very similar. Conclusion: Compartmental analysis of MG and FDG kinetics using dynamic PET data requires measurements of dual-input activity concentrations. Using the dual-input function, physiologically reasonable parameter estimates of K1, k2, and Vp were obtained, whereas the use of conventional arterial sampling underestimated these parameters compared with independent measurements of hepatic flow and hepatic blood volume. In contrast, the linear Gjedde–Patlak analysis, being less informative but more robust, gave similar parameter estimates (K, V) with both input functions.
Dynamic PET is used for quantitative in vivo measurements of organ function using intravascularly injected PET tracers. [18F]FDG is used widely to detect tumors and to study metabolic changes in the heart and brain. The use of PET for liver studies has been mostly in the detection of liver tumors (1–3). Studies of liver metabolism have been limited, in spite of the key role of the liver in the regulation of the metabolism and the unique possibility of studying metabolism in vivo by positron-labeled substrates. Metabolic processes are usually quantified by PET using kinetic models that relate the time course of the tracer activity concentration in tissue to that in arterial blood. This approach has been successful in heart and brain studies and has also been applied to the liver (2,4). For liver studies, the use of arterial input may, however, introduce systematic errors in the estimated kinetic parameters because of ignorance of the hepatic dual blood supply. The main part of an intravenously injected tracer goes to the liver by portal venous blood flow; it is delayed and dispersed in comparison with that of the hepatic artery. The question to be answered is how closely the true hepatic input is approximated by conventional arterial blood sampling.
This study was designed to compare the dual-input function with the arterial-input function for kinetic parameter estimation using 3-O-[11C]methylglucose (MG) and FDG. The errors made with the arterial-input function were examined, and the importance of using the dual-input function was shown. The hypothesis tested was that the use of the dual-input function, instead of the conventional arterial-input function, would improve model fitting and provide physiologic parameter estimates.
MATERIALS AND METHODS
Animals
The study procedures were approved by the Danish National Ethics Committee for animal research. Six pigs of Danish Landrace (age, 3 mo; weight range, 38–42 kg) were used. The pigs were deprived of food 24 h before the experiment but had free access to water.
Animal Preparation
Each pig was anesthetized by intramuscular injection of 10 mg/kg (milligram per kilogram of body weight) ketamine and 0.5 mg/kg midazolam followed by intravenous injections of 5 mg/kg and 0.25 mg/kg, respectively. The anesthesia was maintained using intravenous infusions of 4–8 mg/min/kg ketamine and 0.4–0.8 mg/min/kg midazolam, and the pig was ventilated with air containing 40% oxygen using a Servo 900 respirator (Siemens-Elema, Solna, Sweden). Each pig was placed on its back, and a catheter was placed in the caval vein through the right femoral vein for infusions. A catheter was placed into the aorta through the right femoral artery for arterial blood sampling corresponding to the hepatic artery (HA) and for blood pressure measurements. A catheter was placed through a 10-cm-long abdominal incision into the portal vein (PV) through the splenic vein for PV blood sampling. The position of the PV catheter was controlled by fluoroscopy before each experiment. Finally, two sonographic transit-time flow-meter probes (CardioMed; In Vivo Aps, Oslo, Norway) were placed around the HA and PV through the abdominal incision. The pig was then allowed to recover for 1 h before administration of the first tracer. The oxygen saturation and pH in the arterial blood samples were measured every hour and were adjusted toward >98% and 7.45, respectively, by changing the amount of air delivered from the respirator. The arterial blood glucose level was measured three times during each scan and was in the range of 5.0–6.7 mmol/L. The pigs were covered and placed on a thermostatically controlled heat blanket set to keep the body temperature between 38.5°C and 39.5°C.
PET Examination and Blood Sampling
All six pigs were scanned after 500 MBq [15O]carbon monoxide (CO) inhalation, 500 MBq MG 15-s intravenous injection, and 300 MBq FDG 15-s intravenous injection. Between scans, we waited six times the radioactive half-lives to allow the previous tracer to decay. PET was performed using an ECAT EXACT HR-47 camera (CTI, Knoxville, TN/Siemens Medical Systems, Inc., Hoffman Estates, IL). The PET camera was calibrated using a phantom containing a 68Ge/68Ga solution with a known activity concentration. The pig was positioned with the liver inside the 15-cm field of view. A 15-min transmission scan with external rod sources was performed before the first emission scan and used for photon attenuation correction. After the CO inhalation, eight 20-s frames were recorded with corresponding arterial blood samples. For the two glucose scans, dynamic data acquisition was started at the injection time and included 38 frames: 18 × 10 s, 4 × 30 s, 5 × 1 min, 6 × 5 min, and 5 × 10 min, for a total scanning time of 90 min. The PET data were reconstructed with filtered backprojection using a Hanning filter with a cutoff at 0.3 Nyquist frequency. The resulting three-dimensional images contained 128 × 128 × 47 voxels with a size of 2.4 × 2.4 × 3.1 mm and a central spatial resolution of 6.7 mm full width at half maximum. In the pig, MG and FDG do not enter red blood cells (S. Keiding, unpublished data), in agreement with previous findings for glucose and galactose (5). The activity concentrations were measured in the blood, and the clearance of the tracer from the blood to tissue therefore refers to the blood flow. HA and PV blood samples of 1 mL each were collected manually for 88 min starting at the injection time in the following intervals: 18 × 5 s, 3 × 10 s, 2 × 30 s, 1 × 2 min, 1 × 3 min, 1 × 4 min, 1 × 6 min, and 7 × 10 min. Radioactivity concentrations were measured using a well counter (Packard Instrument Co., Meriden, CT), which was calibrated using a 68Ge/68Ga solution with a known activity concentration. All measurements in the blood samples were decay corrected to the start of the tracer administration. Blood flows in HA and PV were measured continuously throughout the experiment. After finishing the measurements, the liver was removed from the anesthetized animal and weighted.
Image Analysis
Regions of interest were defined using transaxial slices of the mean image consisting of the sum of all frames 12–90 min after injection. This procedure made it easier to distinguish the liver from the surrounding tissue in comparison with using only a single frame from the study. The regions of interest were drawn to contain liver tissue without including extrahepatic tissue and summed to a volume of interest of about 200 mL. Liver tissue time–activity curves (TACs) were generated from these volumes of interest.
Modeling
CO.
CO is transported by the red blood cells, which cannot cross the endothelial cells. During the steady state, the hepatic blood volume, Vb, can be calculated using the liver tissue activity concentration, M, and the blood input activity concentration, Cin:
 Eq. 1
Eq. 1
MG.
The blood–tissue exchange of the glucose analogs takes place in the hepatic sinusoids. Blood is separated from the hepatocytes by the endothelial cells permeable for plasma and an extracellular volume including the space of Disse (6). MG is a nonmetabolizable glucose analog that enters and leaves the hepatocytes by the hepatic GLUT-2 transport protein but is not phosphorylated (7). The dynamic data obtained after the MG injection were analyzed using a one-tissue compartment model accounting for MG in an extended blood volume and in an intracellular space. The extended blood volume parameter accounts for MG in the extracellular volume, including the hepatic blood volume and space of Disse. The model has three free parameters: the clearance into the cell, K1; the reverse rate constant, k2; and the extended blood volume, V0. Denoting tissue activity concentration by M(t) and blood input activity concentration by Cin(t), this model predicts:
 Eq. 2
where ⊗ denotes a convolution integral. The external PET measurement of M(t) is direct, whereas the input to the liver, Cin(t), is inferred from blood samples, being either the dual-input or the arterial-input function.
Eq. 2
where ⊗ denotes a convolution integral. The external PET measurement of M(t) is direct, whereas the input to the liver, Cin(t), is inferred from blood samples, being either the dual-input or the arterial-input function.
FDG.
FDG enters the hepatocytes by the hepatic GLUT-2 transport protein. In the hepatocytes, FDG is phosphorylated through hexokinase to FDG-6PO4 (7), which can be dephosphorylated by glucose-6-phosphatase (8). Thus, FDG can be transported out of the cells again. Any further metabolism through the glycolytic series is assumed not to occur within the experimental period. The FDG data were analyzed using a two-tissue compartmental model (9,10), accounting for FDG in the extended blood volume and in the intracellular space, and a pool representing FDG-6PO4. In addition to the parameters in the MG model (K1, k2, and V0), the FDG model includes rate constants for the phosphorylation of FDG, k3, and the dephosphorylation of FDG-6PO4, k4. The two-tissue compartmental model then predicts:


 where
where
 Eq. 4
Eq. 4
Gjedde–Patlak Representation.
In the liver MG and FDG experiments discussed in this article, two short-time processes occur. After a 15-s injection, the dynamic phase of the input lasts about 1 min (Fig. 1). The equilibration between the extracellular and intracellular pools of the blood-borne precursor has the relaxation time 1/k2, also about 1 min. For a nonmetabolized tracer, such as MG, or an irreversibly metabolized tracer, such as FDG, in most extrahepatic tissues, no other time scales are defined. Reversible metabolism introduces another, usually much longer, time scale of equilibration between the precursor and the metabolite pool. A typical example is the characteristic time given by the rate constant for dephosphorylation of FDG in the liver, 1/k4 ≈ 100 min, which is longer than the duration of our experiment.
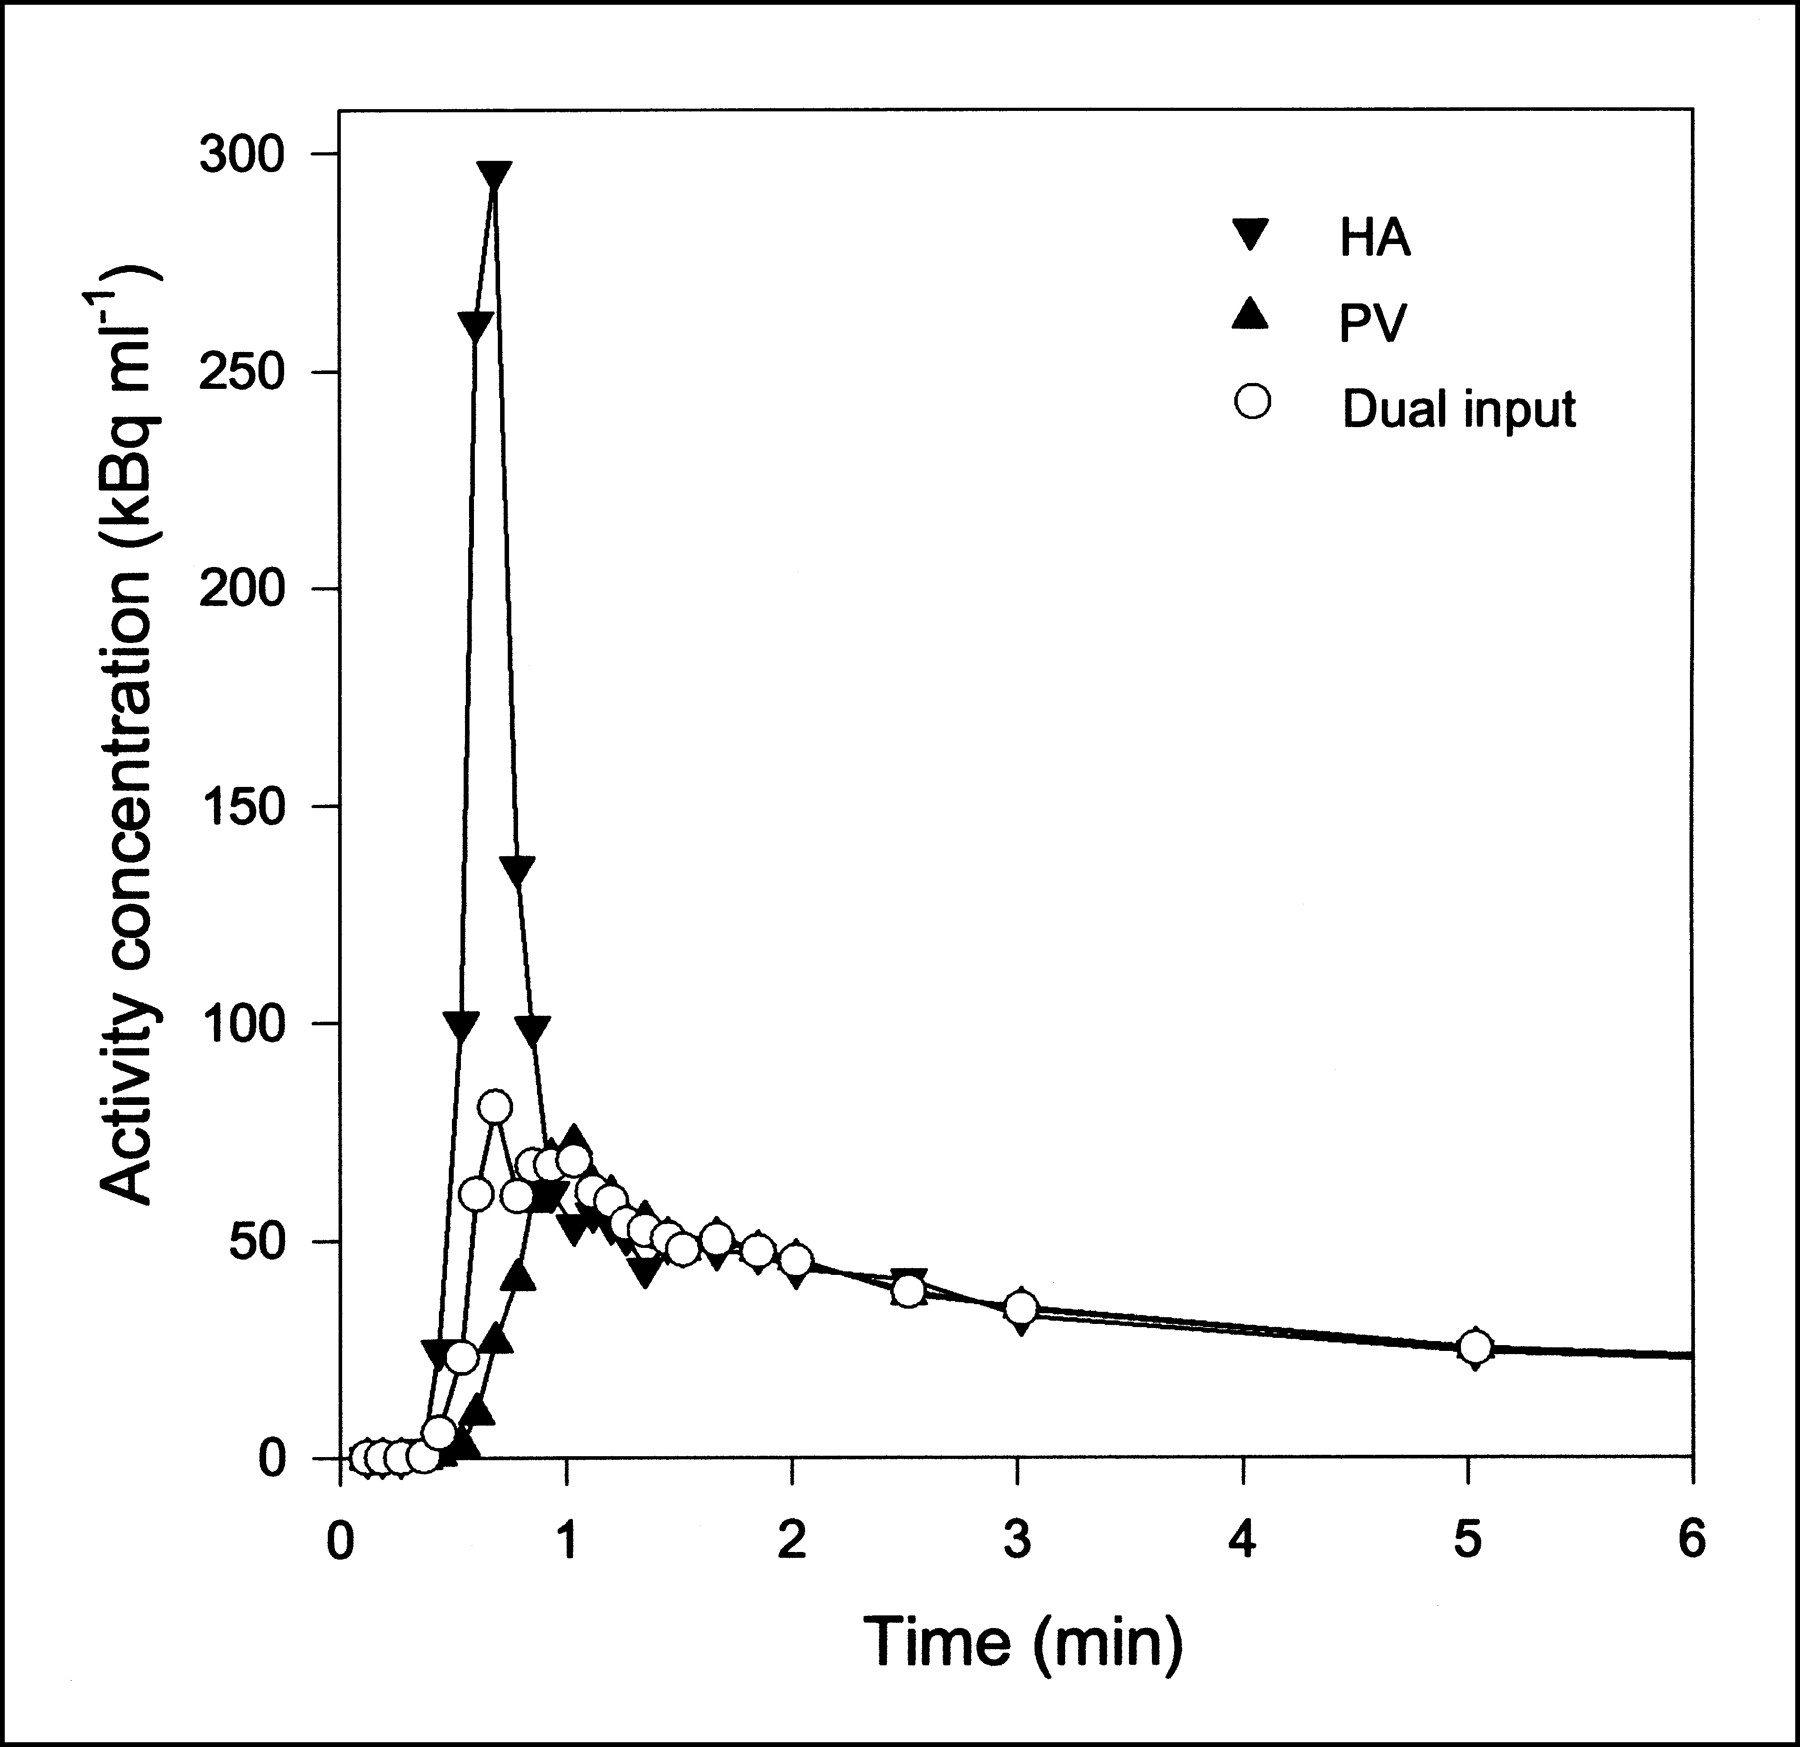
Typical blood TACs (MG injection; pig 6) from HA, PV, and flow-weighted dual-input function. First 6 min are shown, when differences of shapes were most pronounced. After a few minutes, all three curves were similar. Lines are linear interpolations between data points.
A clear way to display the time scales is the less informative, but often more robust, analysis provided by the Gjedde–Patlak representation (11,12). In the graphic Gjedde–Patlak representation, M(t)/Cin(t) is plotted against a virtual time variable:
 Eq. 5
where θ(t) is a nonlinear, monotonically increasing function of time. The ordinate M(t)/Cin(t) changes rapidly on the short time scales and then slowly, or not at all, on the long time scale. A particularly clear-cut application of the Gjedde–Patlak plot is to a precursor exchanged between the blood and cells with parameters K1 and k2 and then metabolized irreversibly in the cells with a rate constant of k3. In that case, beyond the short time scales, the plot has the form:
Eq. 5
where θ(t) is a nonlinear, monotonically increasing function of time. The ordinate M(t)/Cin(t) changes rapidly on the short time scales and then slowly, or not at all, on the long time scale. A particularly clear-cut application of the Gjedde–Patlak plot is to a precursor exchanged between the blood and cells with parameters K1 and k2 and then metabolized irreversibly in the cells with a rate constant of k3. In that case, beyond the short time scales, the plot has the form:
 Eq. 6
where the forward clearance K and the virtual volume V have the following kinetic meanings:
Eq. 6
where the forward clearance K and the virtual volume V have the following kinetic meanings:
 Eq. 7
Eq. 7
Parameter Estimation and Statistical Criteria.
Model parameters were estimated by minimizing the weighted residual sum of squares (WRSS), and PET data were weighted in proportion to the frame durations. Plots of the weighted residuals against time were examined for systematic errors. Identifiability of the model parameters was examined using sensitivity functions:
 Eq. 8
where M′(t) is the model solution and p is any model parameter. Mathematic independence of the model parameters is shown by the fact that no sensitivity function is proportional to or a reciprocal of another.
Eq. 8
where M′(t) is the model solution and p is any model parameter. Mathematic independence of the model parameters is shown by the fact that no sensitivity function is proportional to or a reciprocal of another.
The best model fitted to the data is not necessarily the model producing the smallest WRSS, because adding more parameters generally decreases the WRSS. Therefore, we identified the statistically favorable model based on two criteria that included penalty functions proportional to the number of parameters in the model (13). The Akaike (14) and Schwarz (15) criteria (Eqs. 9 and 10, respectively) were used to measure the quality of a fit:
 Eq. 9
Eq. 9
 Eq. 10
where AIC is the Akaike information criteria, SC is the Schwarz criterion, P is the number of parameters in the model, and N is the number of data points. It is seen that small values of AIC and SC should be preferred.
Eq. 10
where AIC is the Akaike information criteria, SC is the Schwarz criterion, P is the number of parameters in the model, and N is the number of data points. It is seen that small values of AIC and SC should be preferred.
Results are given as the mean ± SEM. Pairwise comparisons were performed using t tests; P < 0.05 was considered statistically significant.
RESULTS
Hepatic Blood Volume
The hepatic blood volume, Vb, was measured in all six pigs according to Equation 1. About 5 min after tracer administration, the tissue and arterial blood activity concentrations reached constant levels, and mean activity concentrations were used to calculate Vb. The mean value of Vb was 0.25 ± 0.01 mL/mL (milliliter blood per milliliter liver tissue).
Time–Activity Curves
The dual-input concentrations were calculated as the flow-weighted input concentrations from HA and PV according to:
 Eq. 11
where F is blood flow. The flows were measured continuously during the experiments. Typical flow fractions were 20% from HA and 80% from PV. The mean total hepatic blood flow was 1.02 ± 0.05 mL/min/mL. It was calculated using measurements of flow and liver weight. As illustrated in Figure 1, the HA TAC had a rapid phase with a narrow peak, and the PV TAC was delayed and dispersed during the passage through the intestines. The dual-input TAC was somewhere in between, because it is composed of the two input curves. The difference between the blood TACs was most pronounced around the peak, immediately after the bolus injection. After some time, the TACs get less dynamic, and dispersion and delay through the intestines become less important. Eventually, the three blood TACs reached a quasi–steady state, in which they were virtually identical.
Eq. 11
where F is blood flow. The flows were measured continuously during the experiments. Typical flow fractions were 20% from HA and 80% from PV. The mean total hepatic blood flow was 1.02 ± 0.05 mL/min/mL. It was calculated using measurements of flow and liver weight. As illustrated in Figure 1, the HA TAC had a rapid phase with a narrow peak, and the PV TAC was delayed and dispersed during the passage through the intestines. The dual-input TAC was somewhere in between, because it is composed of the two input curves. The difference between the blood TACs was most pronounced around the peak, immediately after the bolus injection. After some time, the TACs get less dynamic, and dispersion and delay through the intestines become less important. Eventually, the three blood TACs reached a quasi–steady state, in which they were virtually identical.
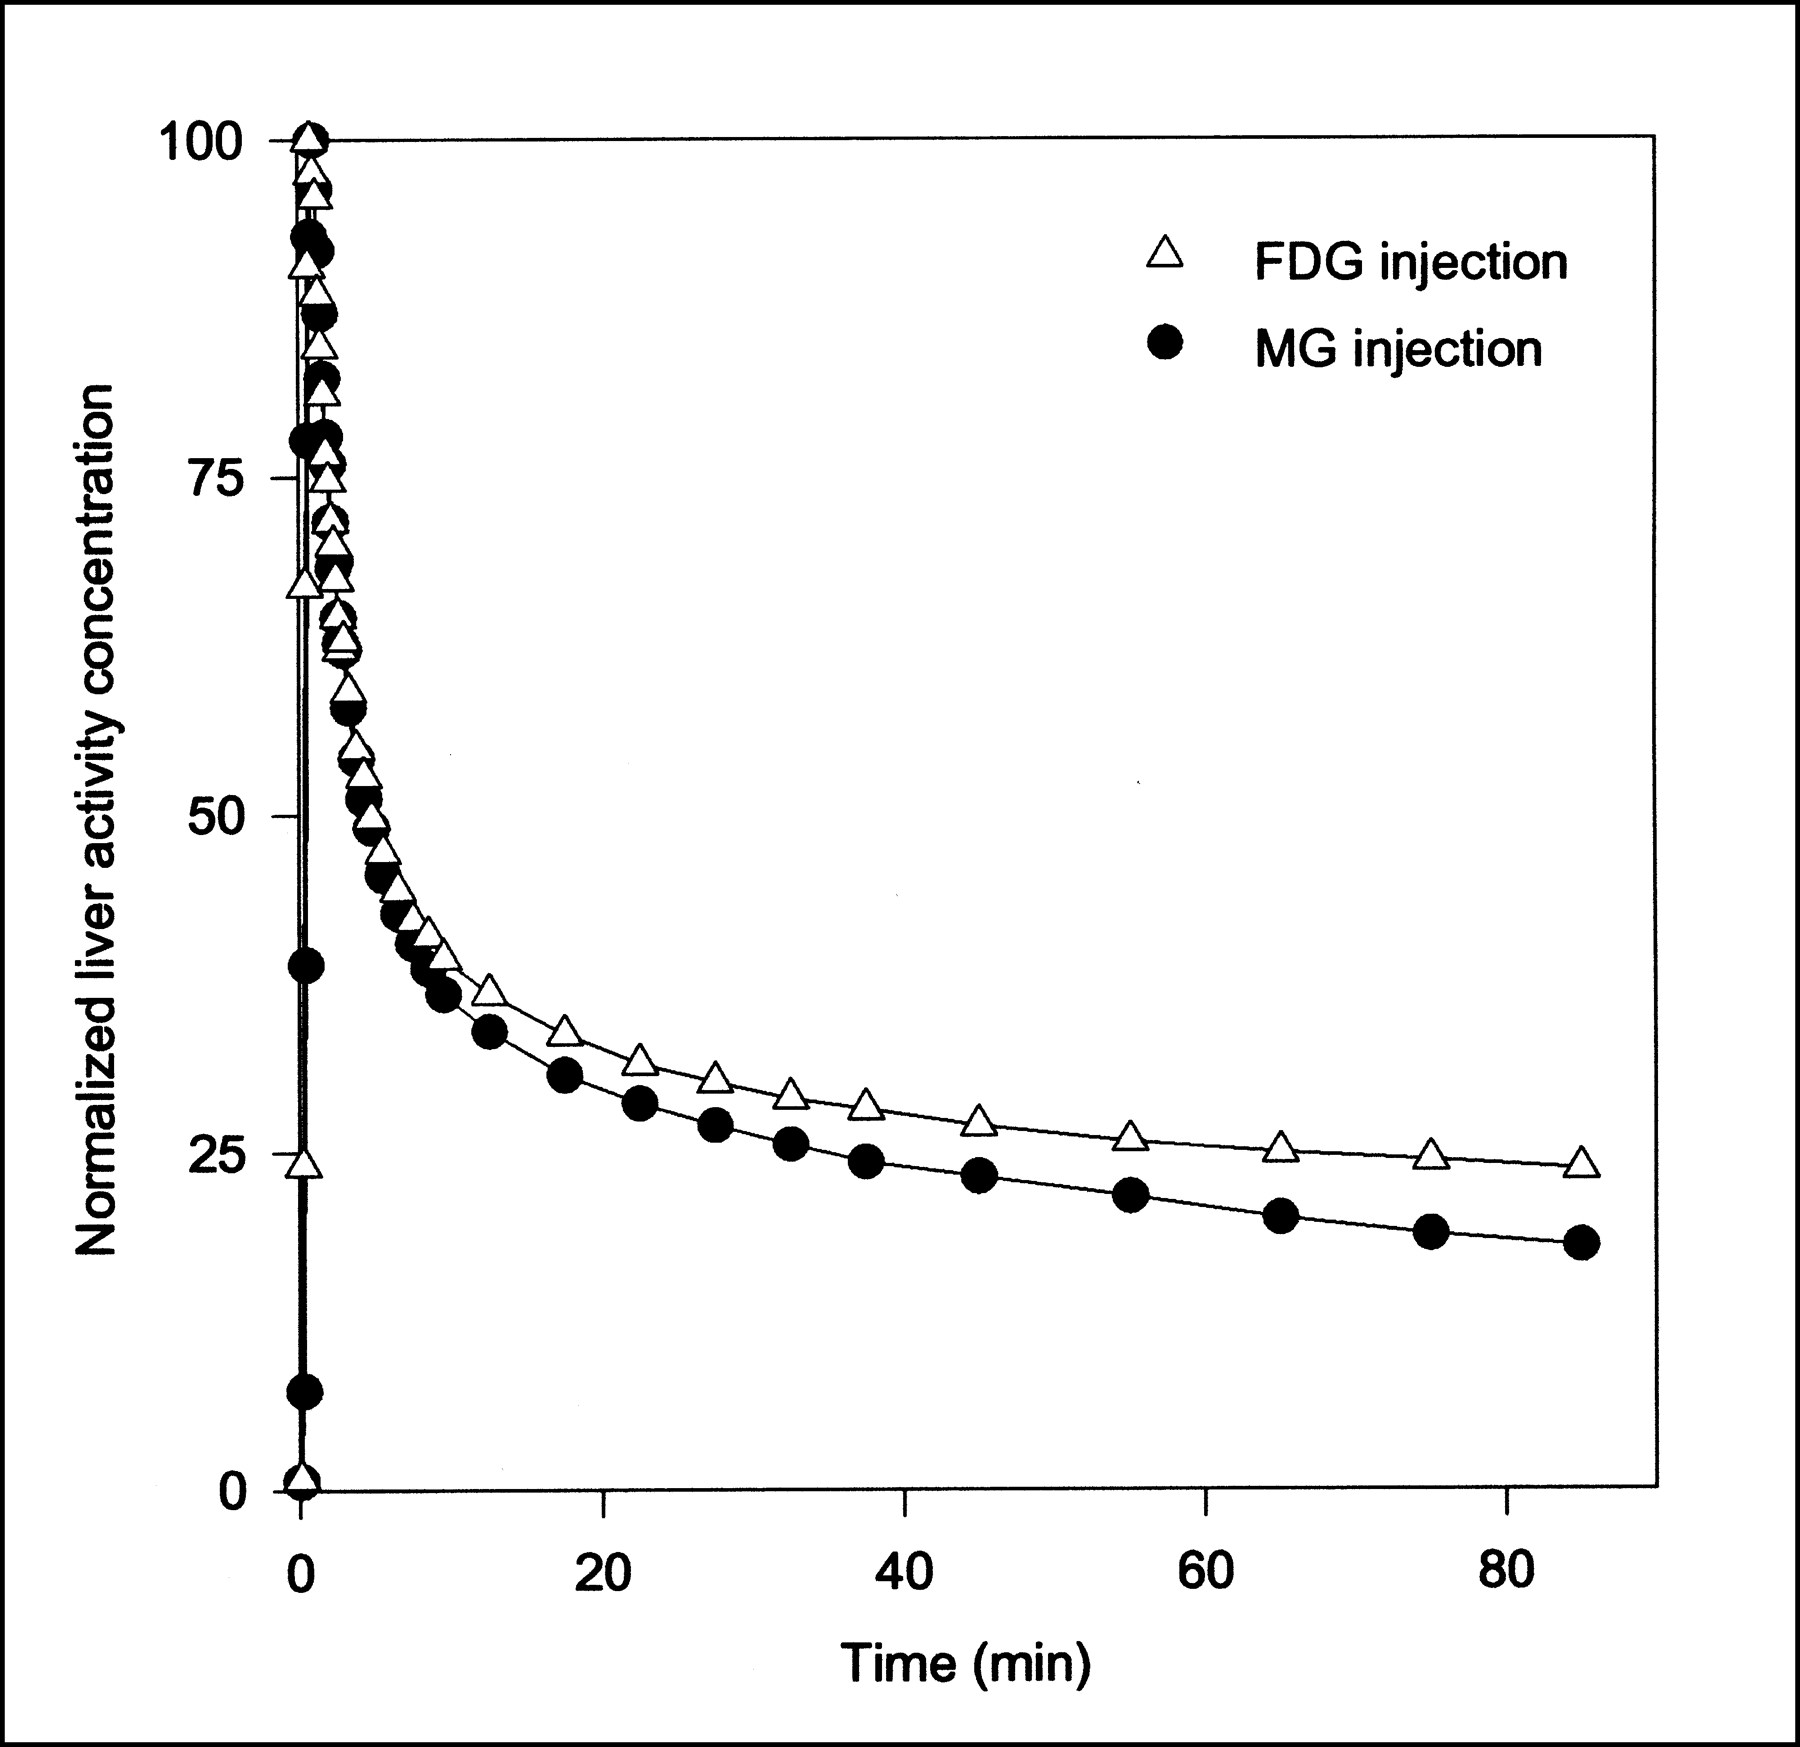
Typical PET TACs for tissue activity concentrations after MG and FDG injections are shown in Figure 2. Higher activity concentrations at late time points show that FDG is retained longer in the liver than is MG. This result reflects the transport of FDG into and out of the intracellular FDG-6PO4 pool.

Typical tissue TACs after 500 MBq MG and 300 MBq FDG bolus injections (pig 6). Because different amounts of MG and FDG were administered, TACs are normalized (same peak height) for comparison. Lines are linear interpolations between data points.
Parameter Estimates Using Dual Input and Arterial Input
Compartment Models.
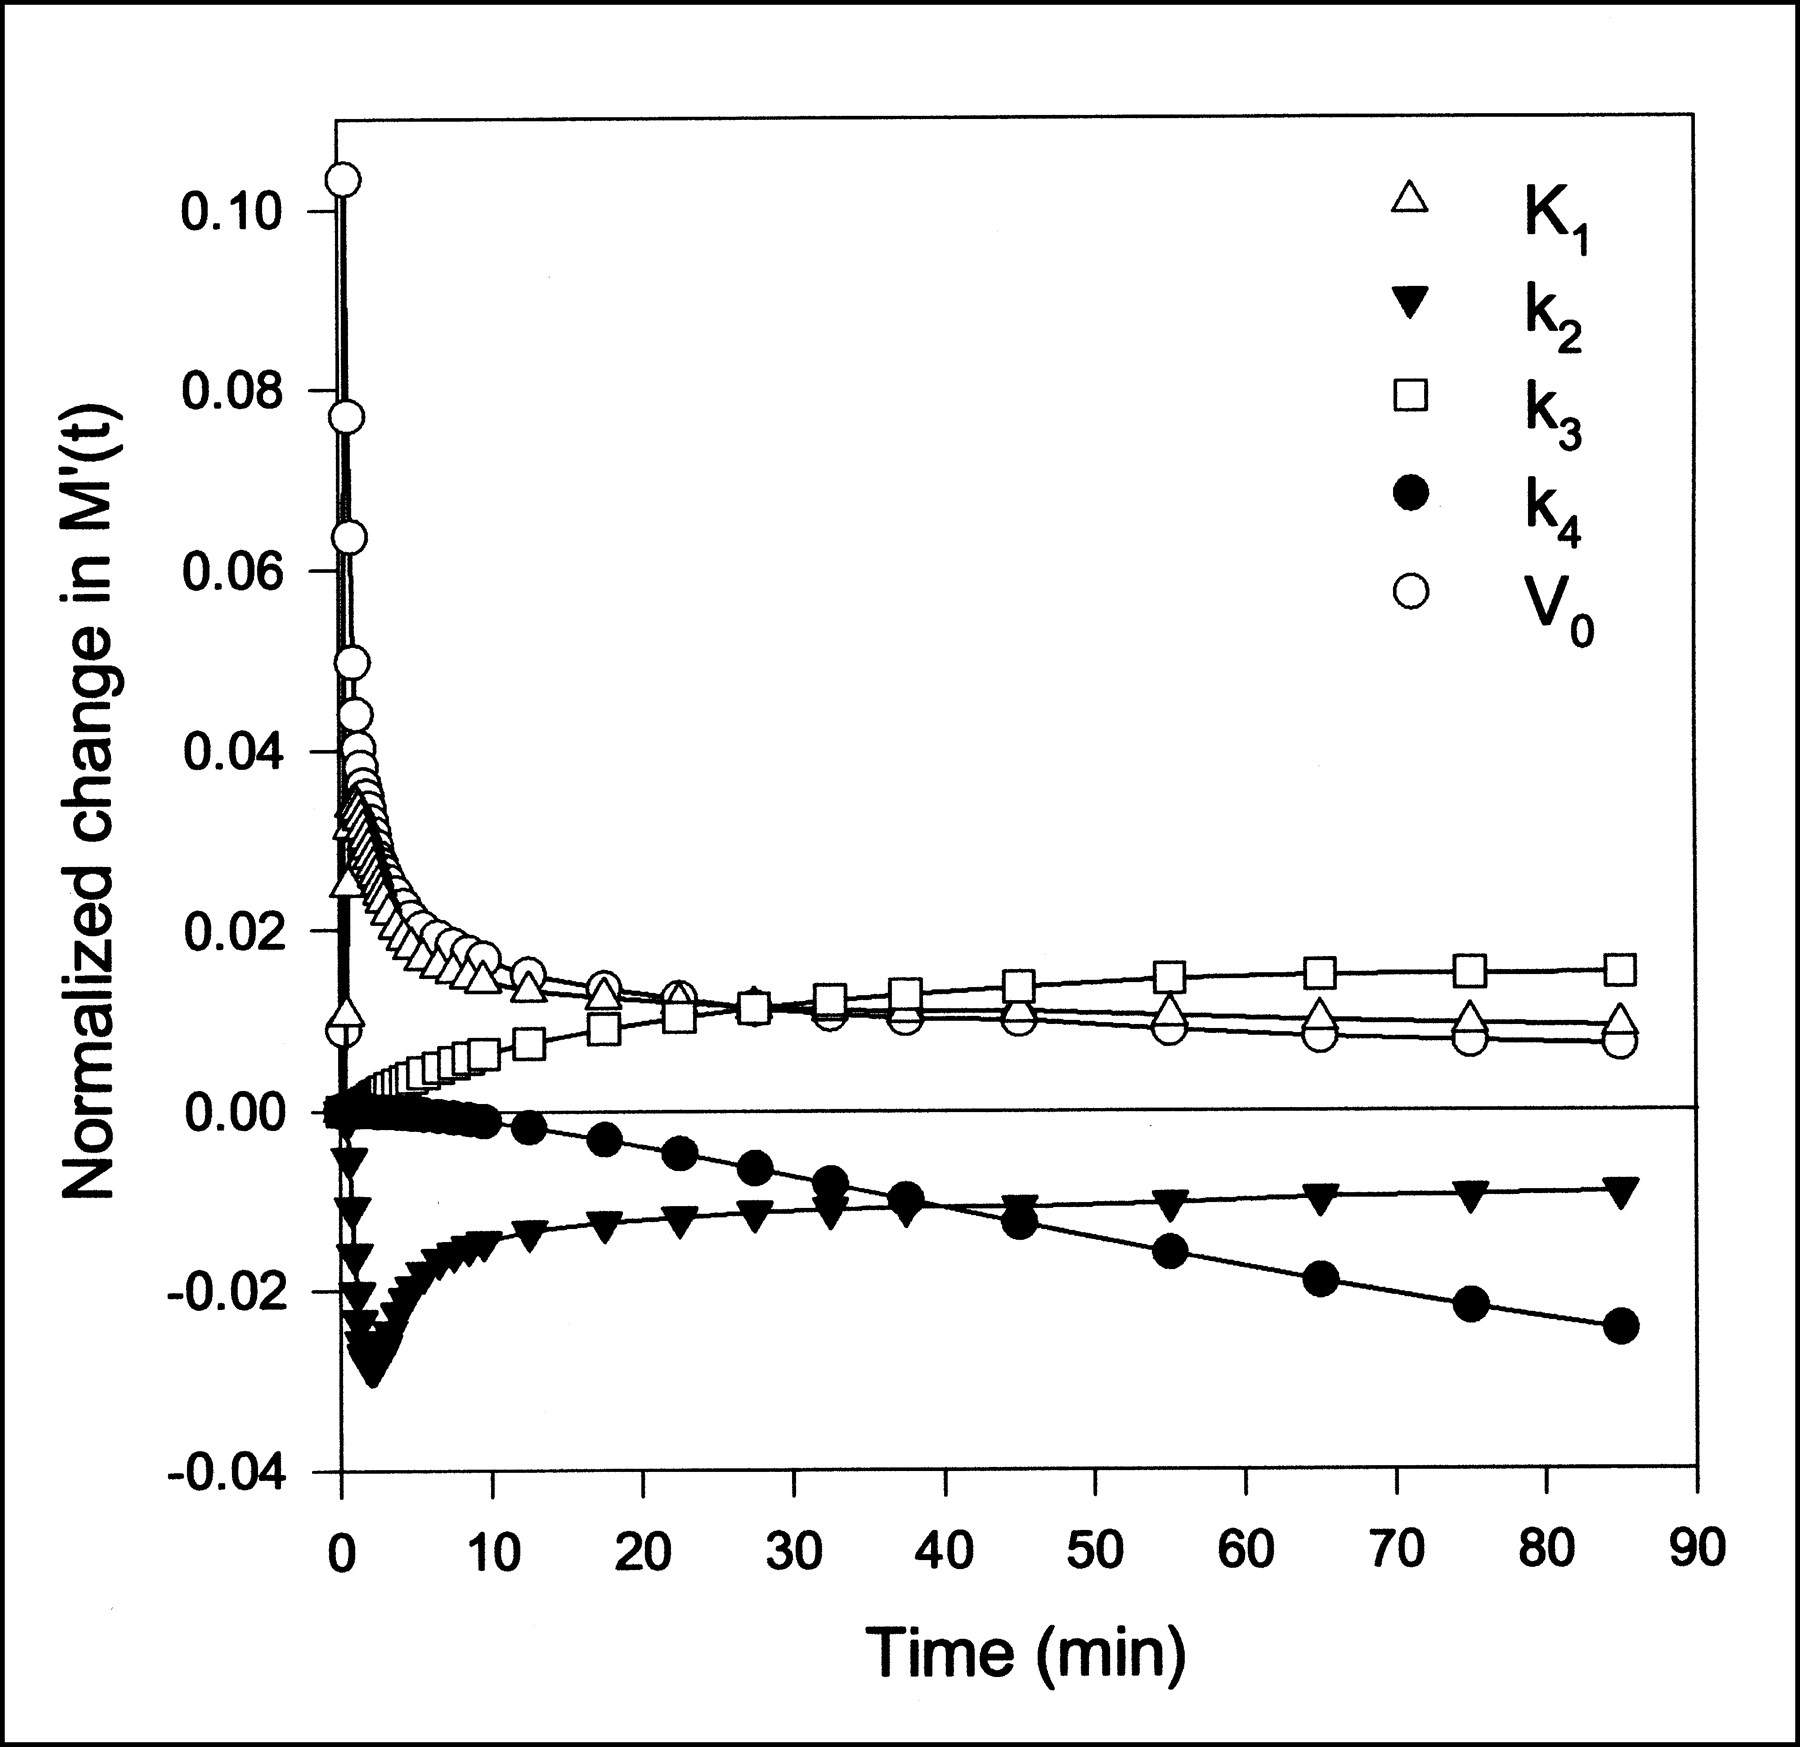
Data obtained after MG injections were analyzed using a one-tissue compartment model (Eq. 2) and were fitted using both the dual-input function and the arterial-input function. Similarly, the FDG data were analyzed using a two-tissue compartment model (Eq. 3) using both input functions. Parameter estimates and the statistical criteria are presented in Table 1. For both MG and FDG, K1, k2, and V0 are significantly larger using the dual input rather than a single arterial input. The k3 and k4 values for FDG do not differ significantly using either of the inputs. As illustrated by the sensitivity plot (Fig. 3), the determination of K1, k2, and V0 is associated with the short time scales, for which the difference between the dual input and arterial input is most pronounced (Fig. 1). The determination of these parameters therefore depends strongly on using the correct input. The early arterial-input function overestimates the true hepatic input. This situation causes the rate constants for transport of tracer into and out of the cells to be underestimated and the vascular volume to be grossly underestimated—the sharp initial peak of the arterial samplings is not reflected in the tissue TAC. In contrast, k3 and k4 for conversion of FDG into and out of the phosphorylated state are primarily determined by the late data points (Fig. 3). For example, k4 has no importance until some FDG-6PO4 has been produced on which the phosphatase can work. At that time, the arterial input does not differ much from the dual input, and the determination of these rate constants is not sensitive to the choice of input function. Better fits were obtained for both MG and FDG using the dual-input function rather than the arterial-input function, as shown by the lower AIC and SC scores. The statistical argument may be somewhat weakened by the fact that a noisy or even wrong input function can cause better fits, but in each of the 14 injections, we obtained lower statistical scores using the dual input.
Compartmental Modeling of MG PET and FDG PET of Pig Livers Using Dual Input and Arterial Input

Sensitivity of model solution M′(t) to changes in FDG model parameters as function of time using dual-input function. Lines are linear interpolations. Model is most sensitive to K1, k2, and V0, which primarily affect model solution at early time points. All sensitivity functions in this figure have been normalized to emphasize shape. Positive sensitivity means that increase in parameter will increase model prediction.
Gjedde–Patlak Representation.
MG and FDG data were fitted with the Gjedde–Patlak representation (Eq. 6) using both the dual-input function and the arterial-input function. The time constant of the reversible compartment is on the order of 1/k2 ≈ 1 min, so data from the first few minutes were not included in the analysis. This early phase also includes the dynamic phase, for which the inputs are very different (Fig. 1). Parameter estimates and the statistical criteria are presented in Table 2. Examples of Gjedde–Patlak plots are shown in Figures 4 and 5. The quantities K and V pertaining to the asymptote are seen to be unaffected by the errors arising from the use of the arterial input. This result is a consequence of the differences between arterial and dual inputs being confined to the short time scales.
Gjedde–Patlak Modeling of MG PET and FDG PET of Pig Livers Using Dual Input and Arterial Input

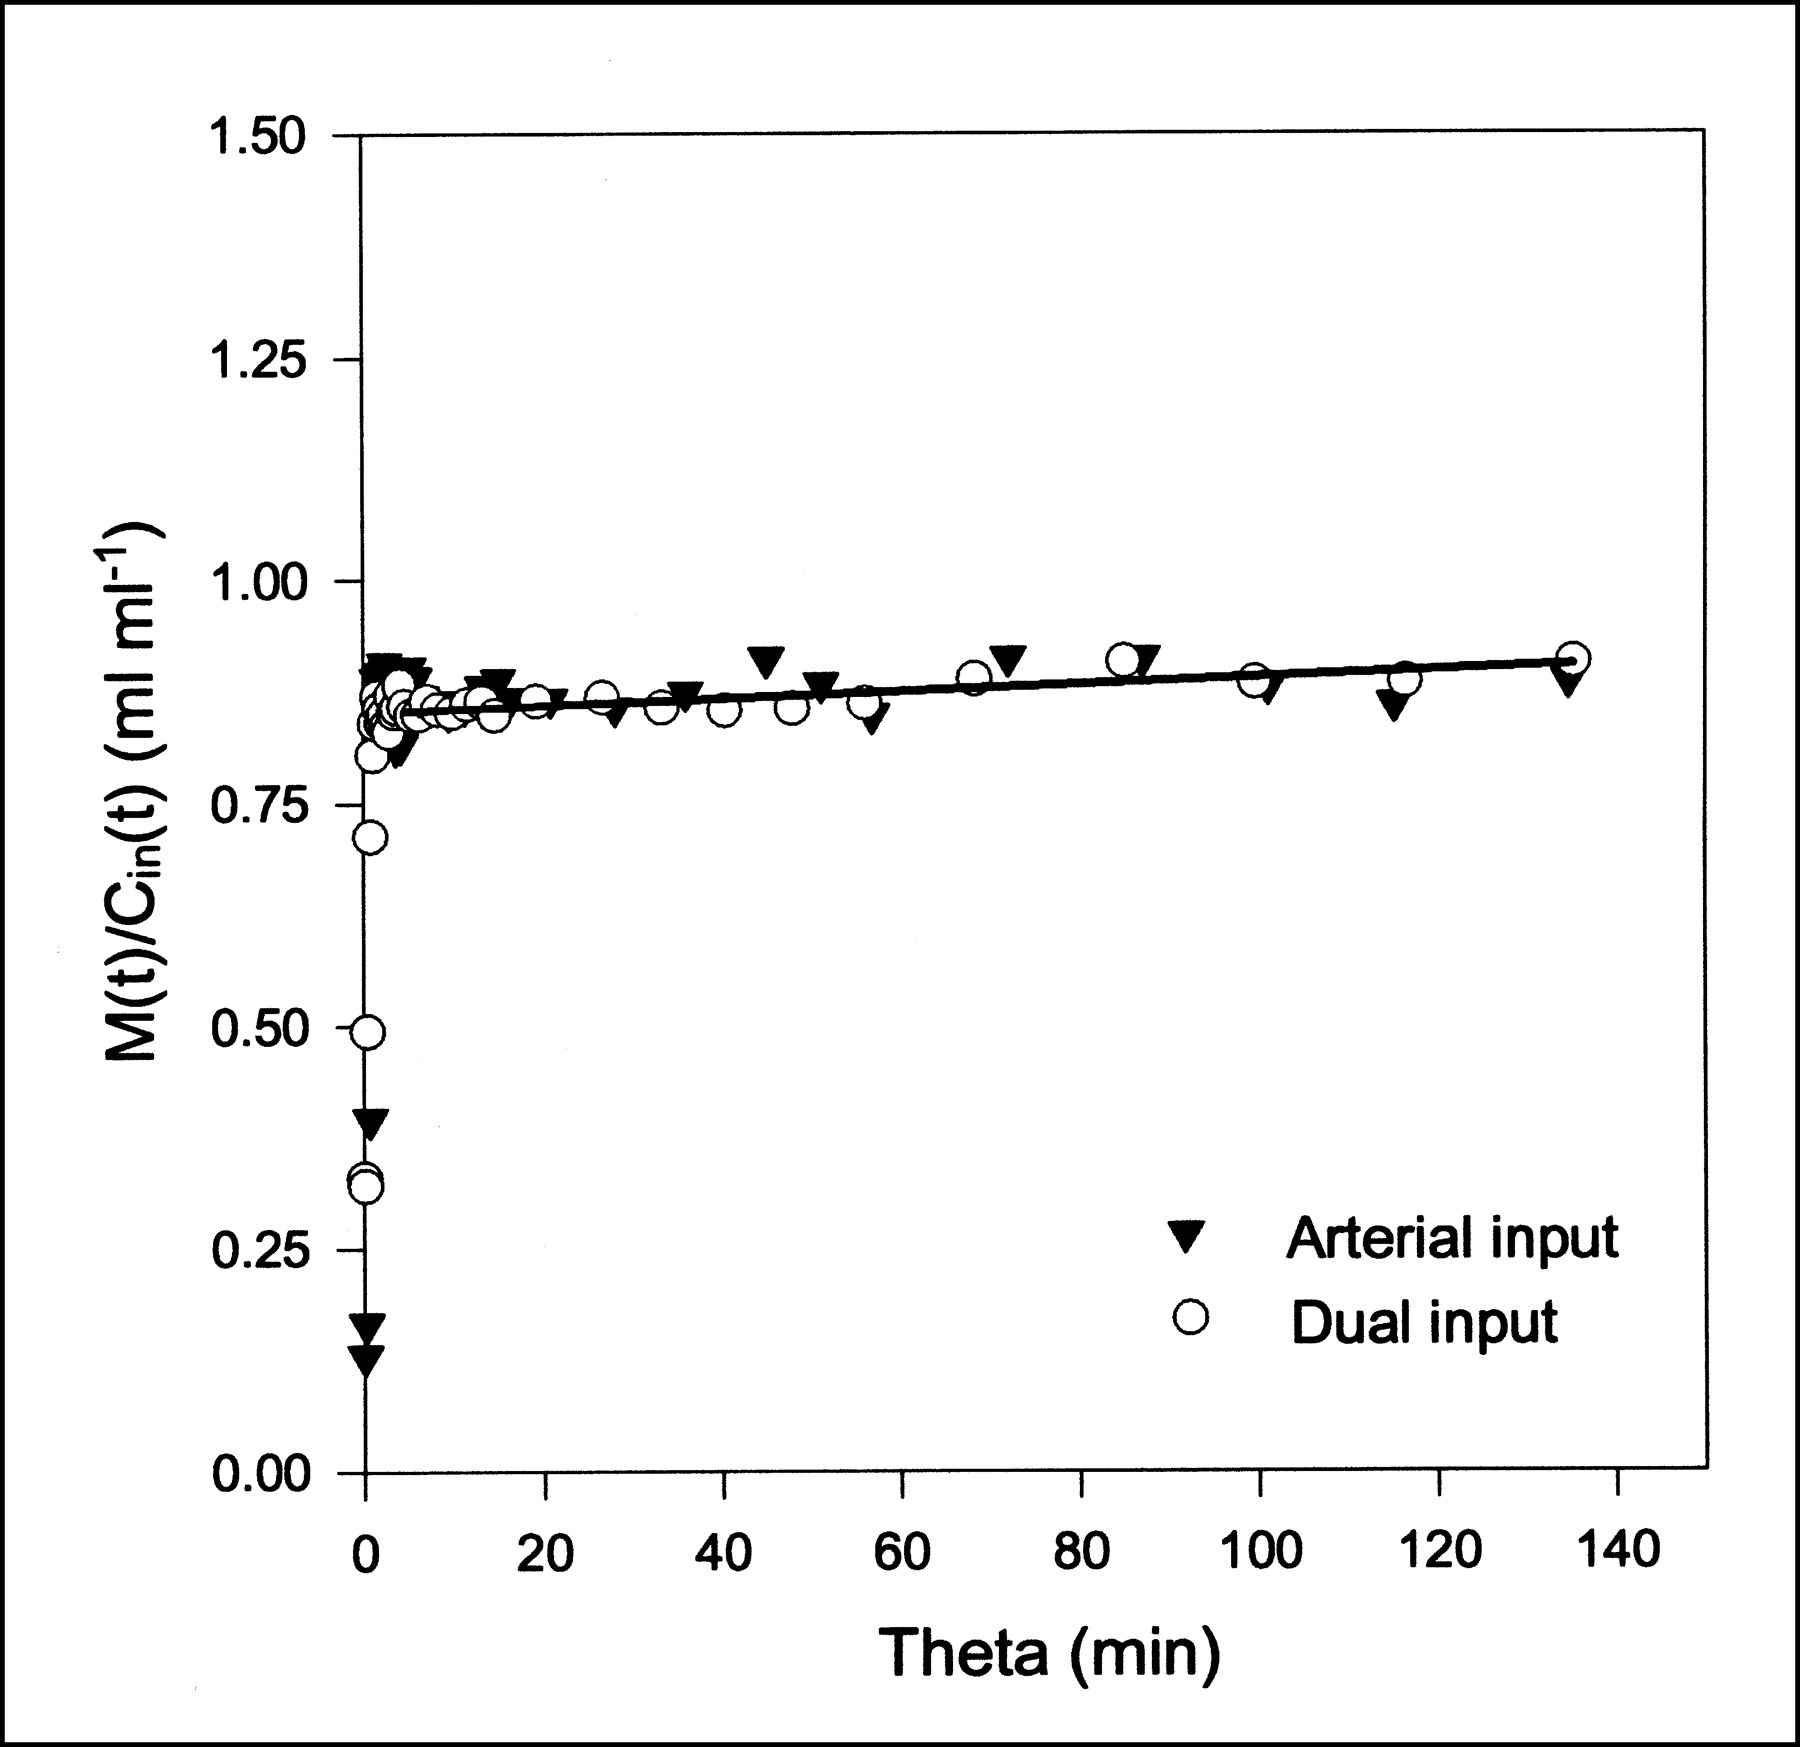
MG Gjedde–Patlak plots using either arterial input or dual input (pig 2). Straight-line fit using dual-input data is shown as black line; early data points are excluded. Parameter estimates are K = 0.0004 mL/min/mL and V = 0.81 mL/mL.
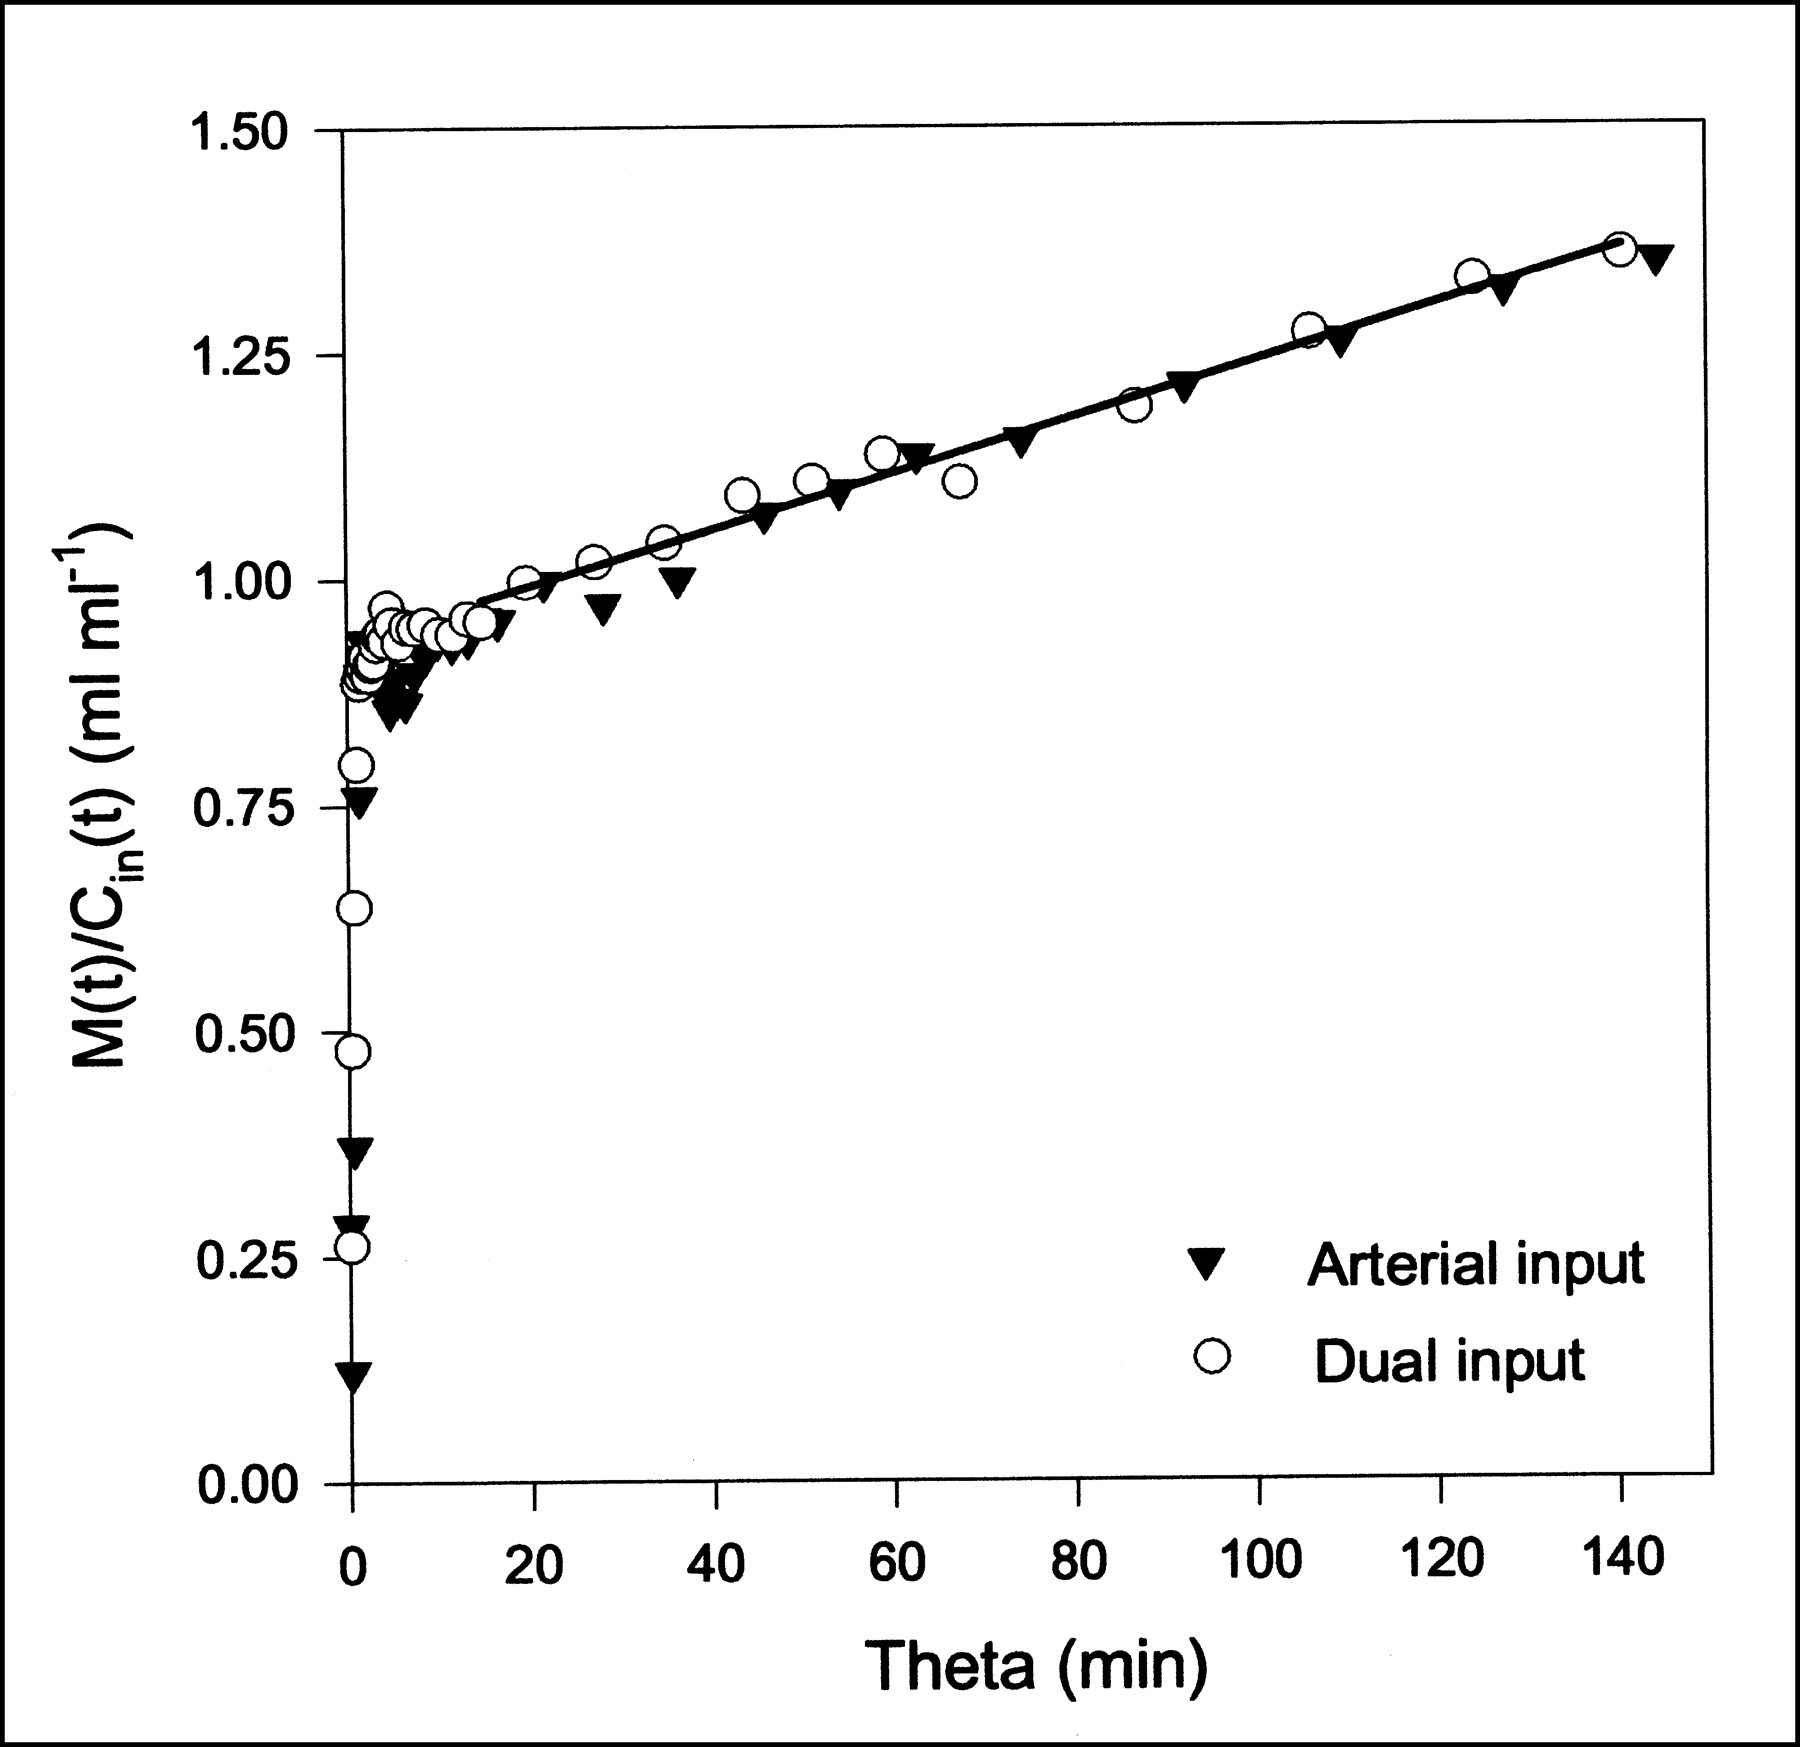
FDG Gjedde–Patlak plots using either arterial input or dual input (pig 6). Straight-line fit using dual-input data is shown as black line; early data points are excluded. Parameter estimates are K = 0.0031 mL/min/mL and V = 0.92 mL/mL.
DISCUSSION
This study revealed the errors made when analyzing liver PET data using conventional arterial input instead of dual input. True hepatic inputs were obtained from measurements of tracer concentrations and blood flows in the HA and the PV. Physiologically reasonable parameter estimates of MG and FDG kinetics were obtained from the compartmental analysis only with the dual-input function. Then, the estimated extended blood volumes (0.27 ± 0.05 mL/mL for MG; 0.40 ± 0.10 mL/mL for FDG) were larger than the independently measured hepatic blood volume of 0.25 ± 0.01 mL/mL, as required physiologically. Furthermore, estimated clearances (1.11 ± 0.11 mL/min/mL for MG; 1.07 ± 0.19 mL/min/mL for FDG) were in close agreement with our measurements of total hepatic blood flow (1.02 ± 0.05 mL/min/mL). The importance of using the dual-input function was also indicated by the statistical criteria that, for both MG and FDG, favored the use of dual input. Table 1 shows that FDG has a larger extracellular volume than MG. This difference, which is not statistically significant (P > 0.2), might be a consequence of a correlation between the vascular volume and the rate constants for transport into and out of the hepatocytes (Fig. 3).
The conventional arterial input leads to absurdly low estimates for the extracellular volume in the liver, which we refuted by separate measurements with CO, and leads to systematic underestimation of rate constants for rapid blood–tissue exchange. In general, kinetic parameters determined using compartmental models and arterial input are underestimated, as shown in Table 1. The FDG rate constants obtained using arterial input correspond to values obtained from FDG liver studies in fasting humans, for which corrected TACs from the left ventricular cavity of the heart were used as the input function (4). In the same study, on the basis of AIC and SC, it was found that a two-tissue compartment model without vascular volume, but with a time-delayed input function, was the best kinetic model to describe the hepatic FDG PET data. In view of our results, these findings can be explained by their use of a single input function. Using our data and the dual-input function, we found AIC of 89 ± 8 and SC of 97 ± 8 including vascular volume, and AIC of 134 ± 9 and SC of 140 ± 12 excluding vascular volume. Thus, the statistical criteria clearly favor the more physiologic model including a vascular volume. Because our blood sampling sites were close to the liver, no time delay was needed.
In our experiments, when integrating the arterial input and the dual input over the entire sampling period, we found that the difference between the integrals was always <1%. This result is important, because any loss of tracer in the intestines would make the use of arterial concentrations clearly wrong for both compartmental and Gjedde–Patlak analysis. Our Gjedde–Patlak analysis showed a zero slope when used to analyze MG data. This result was expected, because MG has a completely reversible metabolism. In the more complicated cases, such as FDG metabolism with reversible phosphorylation, the steady state may not be reached within the time scale of these experiments, and the Gjedde–Patlak plot may not have an asymptotic straight line. Its interpretation therefore involves problems that do not concern us here, except inasmuch as the division of the plot into short and long time scales is preserved, and the parameter estimates are unaffected by the use of arterial samples. For MG and FDG, the Gjedde–Patlak analysis will produce the same parameter estimates for both arterial input and dual input, because the analysis is confined to time scales for which the reversible pools have reached a steady state, and by that time, the arterial-input and dual-input functions are similar. The Gjedde–Patlak analysis, which is often used for evaluating liver tumors (1,3), can therefore be used for the quantification of the forward metabolic clearance using only arterial samples.
CONCLUSION
Compartmental analysis of MG and FDG liver kinetics using dynamic PET data requires measurements of the hepatic dual-input function. Using the dual-input function, physiologic estimates of K1, k2, and Vp were obtained in agreement with independently measured hepatic flow and hepatic blood volume. In contrast, the use of conventional arterial input underestimated the rapid blood–tissue exchange and the extracellular volume. The dual-input measurement procedure cannot be used directly on humans, because invasive blood sampling and blood-flow measurements are required, but the results may serve as a foundation for future noninvasive studies of liver metabolism and liver tumors. Parameters estimated by linear Gjedde–Patlak analysis (K, V) were found to be robust and unaffected by the use of arterial samples.
Acknowledgments
This study was supported by grants from the Novo Nordisk Foundation, Helga and Peter Kornings Foundation, and Aarhus University Hospital Research Initiative.
Footnotes
Received Aug. 26, 2000; revision accepted Dec. 18, 2000.
For correspondence or reprints contact: Ole L. Munk, MSc, PET-Center, Aarhus University Hospital, Nørrebrogade 44, DK 8000 Aarhus, Denmark.
REFERENCES
In this issue


Jump to section
Related Articles
Cited By...
- Total-Body Quantitative Parametric Imaging of Early Kinetics of 18F-FDG
- Structural and Practical Identifiability of Dual-input Kinetic Modeling in Dynamic PET of Liver Inflammation
- Dynamic PET of Human Liver Inflammation: Impact of Kinetic Modeling with Optimization-Derived Dual-Blood Input Function
- Fasting hepatic glucose uptake is higher in men than women
- Hepatic glucose utilization in hepatic steatosis and obesity
- Hepatobiliary Secretion Kinetics of Conjugated Bile Acids Measured in Pigs by 11C-Cholylsarcosine PET
- How Should Lumped Constant Be Estimated for Hepatic 18F-FDG Glucose in Humans?
- Methodologic Considerations for Quantitative 18F-FDG PET/CT Studies of Hepatic Glucose Metabolism in Healthy Subjects
- Bringing Physiology into PET of the Liver
- Is Liver SUV Stable over Time in 18F-FDG PET Imaging?
- Hepatic Blood Perfusion Measured by 3-Minute Dynamic 18F-FDG PET in Pigs
- A quantitative method for estimating hepatic blood flow using a dual-input single-compartment model
- An efficient method for calculating kinetic parameters in a dual-input single-compartment model
- 18F-FDG Assessment of Glucose Disposal and Production Rates During Fasting and Insulin Stimulation: A Validation Study
- Determination of Regional Flow by Use of Intravascular PET Tracers: Microvascular Theory and Experimental Validation for Pig Livers
- Effects of Metformin and Rosiglitazone Monotherapy on Insulin-Mediated Hepatic Glucose Uptake and Their Relation to Visceral Fat in Type 2 Diabetes
- Insulin Stimulates Liver Glucose Uptake in Humans: An 18F-FDG PET Study
- Metabolic Fate of 18F-FDG in Mice Bearing Either SCCVII Squamous Cell Carcinoma or C3H Mammary Carcinoma
- Quantification of 18F-FDG Uptake in the Liver Using Dynamic PET
- Metabolites of 18F-FDG and 3-O-11C-Methylglucose in Pig Liver