


Abstract
The liver is vital for the regulation of glucose metabolism, but inaccessibility of the organ for direct assessments has limited the study of its metabolic role in vivo. Methods: The effect of insulin and insulin sensitivity (IS) on hepatic glucose uptake was investigated using PET, 18F-FDG, and graphical analysis and 3-compartment modeling in humans. We studied 16 healthy sedentary men (normal IS), 8 athletes (high IS), and 7 patients with coronary artery disease (low IS) either during fasting (n = 14) or during euglycemic hyperinsulinemia (n = 24). Results: Whole-body insulin-mediated glucose uptake was 35 ± 7 μmol/min/kg for normal-IS subjects, 65 ± 8 μmol/min/kg for high-IS subjects (P < 0.05 vs. normal IS), and 24 ± 3 μmol/min/kg for low-IS subjects (P < 0.05 vs. normal IS and high IS). Hyperinsulinemia enhanced hepatic glucose influx (2.3 ± 0.9 vs. 1.5 ± 0.7 μmol·min−1·100 mL−1, P < 0.05) and phosphorylation rates (0.55 ± 0.24 vs. 0.36 ± 0.19 min−1·10−2, P < 0.05) similarly in insulin-sensitive and -resistant subjects. During hyperinsulinemia, however, the glucose phosphorylation-to-dephosphorylation ratio was significantly lower in the low-IS group than in normal-IS subjects (P < 0.05) or high-IS subjects (P < 0.01); correspondingly, whole-body insulin-mediated glucose disposal was directly related to this ratio (r = 0.45; P < 0.05). Furthermore, glucose influx rates were inversely correlated with fasting plasma free fatty acids (P < 0.05). Both compartmental modeling and the graphical approach accurately described the data, though the latter yielded slightly lower estimates of glucose influx rates during fasting. Conclusion: Our study provided evidence that physiologic hyperinsulinemia enhances hepatic glucose uptake and that IS is related to the glucose phosphorylation-to-dephosphorylation balance in the liver. Graphical analysis and modeling proved to be applicable and complementary tools for the investigation of glucose metabolism in the liver.
The liver plays a dominant role in the preservation of glucose homeostasis (1,2). Hormonal modulation of hepatic glucose output (HGO) has been extensively investigated, and the importance of plasma insulin concentrations and hepatic insulin sensitivity (IS) in the control of HGO is widely recognized (1–4). However, the specific effect of insulin on hepatic glucose uptake (HGU) remains unclear. Animal experiments (1,5) showing an independent stimulatory action of insulin on HGU were conducted under hyperglycemic conditions, and extrapolation of these findings to the euglycemic situation is problematic because of the mass action effect of glucose to promote its own uptake. In humans, no change in splanchnic glucose uptake (using the splanchnic balance technique) was observed during euglycemic hyperinsulinemia (6,7). However, inhibition of endogenous insulin secretion abolished the enhancement of glucose uptake induced by hyperglycemia, suggesting a permissive role of endogenous insulin in splanchnic glucose uptake. In vitro, insulin has been shown to upregulate glucokinase transcription (8,9) and glycogen synthase activity (10) and to inhibit glucose-6-phosphatase (11) and glycogen phosphorylase (10) in hepatocytes.
Inaccessibility of the liver for direct assessment remains a major obstacle to in vivo investigations. In humans, isotopic dilution methods have been used, either alone or in combination with the splanchnic balance technique, to indirectly estimate HGO and HGU (7). Obviously, these methods cannot discriminate the liver from other splanchnic organs. Animal studies have been conducted using the pancreatic clamp technique (1). By introducing catheters directly into the portal vein, these studies isolate the liver from the other splanchnic organs. So far, human and animal studies have shared the burden of being highly invasive. One main assumption in these studies was that HGO equals total endogenous glucose production; this assumption has been challenged by more recent studies demonstrating that the kidney contributes a nonnegligible fraction of endogenous glucose release (12–14).
PET enables direct observation of tissue radioactivity concentration over time in vivo. Kinetic modeling using a 3-compartment configuration is generally recognized to accurately describe the events leading to glucose and 18F-FDG uptake in several body tissues (15–17). When irreversible glucose uptake occurs, graphical analysis (18) has proven to be a robust and intuitive alternative.
In the present study, our cardiac 18F-FDG PET database was used to assess HGU during fasting and euglycemic hyperinsulinemia in several groups of subjects with different degrees of IS. The aims were to reevaluate the question of whether insulin stimulates HGU and, if so, to investigate the impact of IS on this variable and to establish whether graphical analysis is suitable for the assessment of HGU.
MATERIALS AND METHODS
Subjects
The study population comprised 31 men who were selected to reflect different levels of whole-body IS. Studies on these subjects, addressing completely different issues, were published elsewhere (19–21). Eight of the subjects were athletes, 16 were healthy sedentary men, and 7 were older patients with mild coronary artery disease (CAD). Athletes have an increased IS (high IS), and CAD patients are known to represent a stage of impaired IS (low IS), compared with the IS of healthy control subjects (normal IS) (Table 1). None of the control subjects or athletes was taking any medication at the time of the study, and all were healthy as judged by medical history, physical examination, and routine laboratory tests. The patients with CAD had angiographically confirmed single-vessel disease, with no previous history or electrocardiographic evidence of myocardial infarction, coronary bypass grafting, or coronary angioplasty. None had diabetes or heart failure.
Characteristics of Study Groups
The protocol was approved by the Ethical Committee of Turku University Central Hospital, Finland. Each subject gave written informed consent before taking part in the study.
Study Design
All studies were performed after a 15- to 18-h fast. Seven normal-IS subjects underwent the fasting study. The remaining 9 normal-IS subjects and the high-IS subjects underwent the clamp study. Low-IS patients underwent both fasting and clamp studies on separate days, in random order and within 2 wk. The clamp study (22) consisted of at least 120 min of hyperinsulinemia, and in the fasting study saline was infused instead of insulin and glucose. For HGU measurement, 18F-FDG was injected after 1 h and a 40-min dynamic scan was started. Blood samples for the measurement of hormone and metabolite concentrations and 18F-FDG activity were taken as detailed below. Whole-body glucose uptake was measured between 60 and 120 min of the clamp.
PET Scanning.
Scanning was performed using an ECAT 931-08/12 scanner (CTI Inc.) with a 10.5-cm axial field of view and a resolution of 6.7 mm (axial) × 6.5 mm (in-plane) in full width at half maximum. 18F-FDG was synthesized with an automatic apparatus by a modification of the method of Hamacher et al. (23), leading to a specific activity > 75 GBq·μmol−1 and a radiochemical purity > 99%. Two venous catheters were inserted, one in an antecubital vein for infusion of saline, insulin, dextrose, and 18F-FDG and another in a heated vein for sampling of arterialized venous blood. After optimization of subject position, a 20-min transmission scan was obtained after exposure of a retractable 68Ge ring source to correct all subsequent emission data for tissue attenuation of γ-photons. Then, in 24 subjects undergoing the clamp study, a primed-continuous (40 mU·m−2·min−1) infusion of insulin was started, and an at least 120-min euglycemic hyperinsulinemic clamp was performed as described previously (19,21,22). Euglycemia was maintained using a 20% dextrose infusion adjusted according to frequent plasma glucose measurements. In 14 subjects undergoing the fasting study, normal saline (0.9% NaCl) was infused in similar amounts. After 60 min had elapsed from the start of the insulin or saline infusion, 18F-FDG (∼250 MBq) was infused intravenously over 2 min and a 40-min dynamic scan was obtained to image the liver and cardiac regions, as described previously (24). Arterialized blood samples were collected throughout scanning to measure whole-blood and plasma 18F-FDG radioactivity over time.
Image Processing.
All sinograms were corrected for tissue attenuation, dead time, and decay and were reconstructed through standard reconstruction algorithms in a 128 × 128 matrix, with a Hann filter of 0.3 cycles·s−1. Final in-plane resolution was 9.5 mm in full width at half maximum. Image manipulation and data handling were performed on SUN SPARC workstations (Sun Microsystems) with the ECAT (CTI) software package.
Large circular regions of interest (ROIs, ∼45 cm2) for hepatic 18F-FDG time–activity measurements were placed on 2–4 consecutive image planes in the right lobe of the liver. Such measurements were averaged to generate 1 tissue time–activity curve per patient, with care being taken that diaphragm movement would not affect the ROI location in the tissue image and, thus, affect the results. Tissue radioactivity over time was weighted in proportion to the duration of each frame. Smaller ROIs (∼3.5 cm2) were drawn on 2 adjacent image planes in the left ventricular chamber of the heart for the measurement of radioactivity in arterial blood; special attention was paid to avoiding contamination from surrounding myocardial tissue. Later points of the curve were corrected for spillover by use of in vitro measurements of arterialized plasma radioactivity. Input functions were corrected for time delay by comparison with correspondent tissue time–activity curves. Examples of ROIs and time–activity curves are shown in Figure 1.
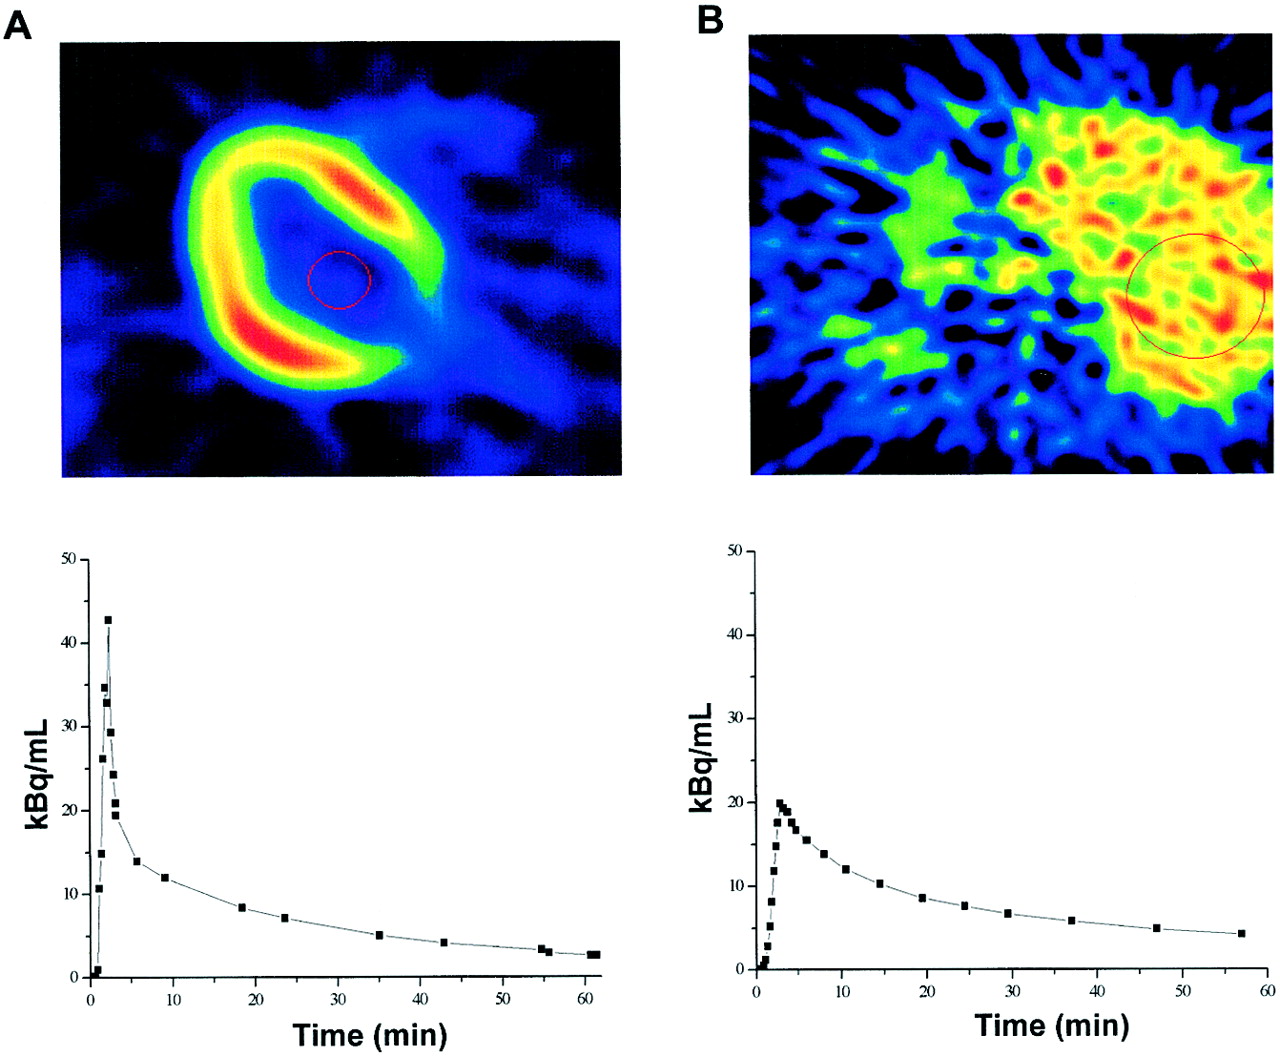
(Top) Transaxial images at level of heart (A) and liver (B) show image quality and ROIs. (Bottom) Time–activity curves were derived from ROIs placed inside left ventricular chamber (A) and right lobe of liver (B).
Data Analysis
Three-Compartment Model.
A 3-compartment model (15–17), modified by the introduction of a blood volume term, was used for the interpretation of 18F-FDG kinetics in the liver. The 3 compartments describe plasma 18F-FDG, tissue 18F-FDG, and tissue 18F-FDG-6-phosphate. Model parameters are related through the following equations:


Ct is activity in tissue at each sampling time point (t), Cp is activity in plasma, and Ce and Cm are the concentrations of, respectively, nonmetabolized and phosphorylated 18F-FDG in tissue. VB is the vascular volume fraction in liver. Because free exchange of solutes and macromolecules between blood and extravascular space occurs in the liver, k1 should reflect blood flow to the organ (mL·min−1·mL−1 of tissue); k2 (min−1) is the reverse rate constant. The rate constants k3 (min−1) and k4 (min−1) reflect 18F-FDG phosphorylation and dephosphorylation, respectively. Kinetic parameters were derived by a nonlinear least squares fit of data. Then, the influx constant (Ki) was calculated as:

Ki was multiplied by the plasma glucose concentration to obtain an index, Ki[G], which is proportional to glucose uptake. Changes in the k3/k4 ratio indicate whether the balance between phosphorylation and dephosphorylation shifts toward one or the other process under different experimental conditions (e.g., fasting vs. clamp).
Graphical Analysis.
Results from the 3-compartment model were compared with those derived by graphical analysis (18). In this model, a graph is generated by plotting:
 where Ct is tissue radioactivity at each sampling time point (t) and Cp is plasma radioactivity. When irreversible influx of 18F-FDG occurs, and the tracer is trapped inside cells, the 2 variables describe a linear relationship after a few minutes of equilibration. The influx constant (Ki) is then given by the slope of the linear fit of the data, excluding the first few values. In line with the literature, plasma insulin levels achieved during a 40 mU·m−2·min−1 clamp are assumed to virtually completely suppress HGO and dephosphorylation of glucose-6-phosphate (or FDG-6-phosphate) (1,6,25), leading to irreversible phosphorylation. If reversible phosphorylation occurs, metabolite loss can be corrected for using the linearization method described by Patlak and Blasberg (26).
Plasma glucose was measured in duplicate by the glucose oxidase technique (GM7 analyzer; Analox Instruments Ltd.). Plasma insulin was quantified by a specific radioimmunoassay (insulin RIA kit; Pharmacia). Serum free fatty acids (FFA) were measured enzymatically (ACS-ACOD; Wako Chemicals GmbH).
Statistical Analysis.
All data are presented as mean ± SD. Differences in paired data were evaluated using the Student paired t test for single repeated measurements. One-way ANOVA was used for unpaired group comparisons. Regression analyses were performed according to standard techniques.
RESULTS
The metabolic characteristics of the study groups are given in Table 1. Plasma glucose levels were similar across all groups. Fasting plasma insulin concentrations were significantly higher in low-IS subjects than in the normal-IS group. Fasting serum FFA were lower in the high-IS group. During hyperinsulinemia, FFA release was significantly inhibited in all groups.
Insulin, IS, and HGU
Rate constants by compartmental modeling and graphical analysis are shown in Table 2. Between the 2 fasting groups and among the 3 clamp groups, no differences were detected in any of the calculated variables. Therefore, comparisons were done, once for each group and once after pooling all fasting versus all clamp data.
Nonlinear Least Squares Fit and Graphical Analysis Parameters
Compared with the values during fasting conditions, k1 and k2 did not change during the clamp between pooled groups, whereas hyperinsulinemia significantly enhanced values of k3 (P = 0.01), Ki (P = 0.005), and Ki[G] (P = 0.02). When groups were analyzed separately, the effect of hyperinsulinemia was especially evident in the group that had undergone a repeated study (Fig. 2).

Single-patient insulin-stimulated hepatic influx rate constant (H-Ki) changes (▿) in subjects who underwent repeated study (low IS) show consistent upward shift in all subjects and significant 98% ± 74% average increase (▪ P < 0.01, Student paired t test).
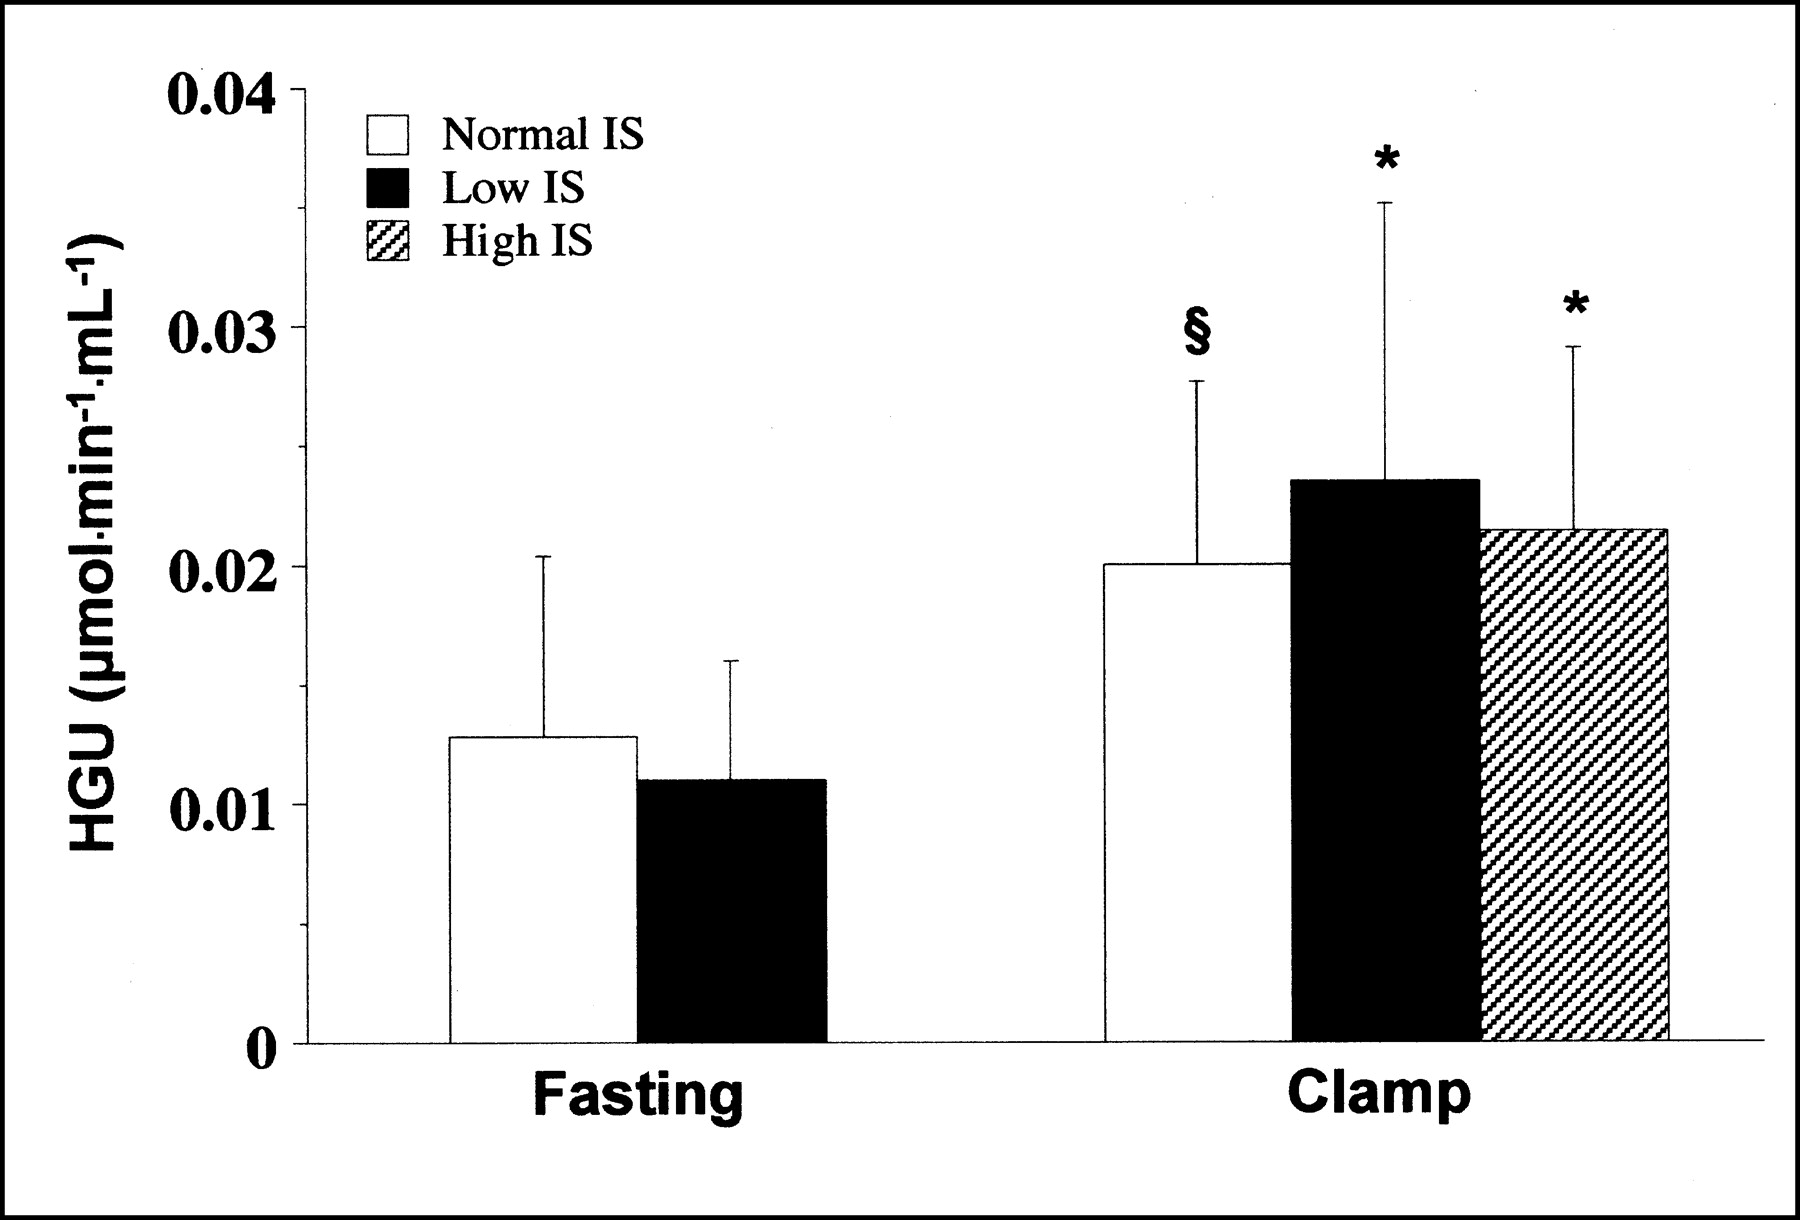
Similar to the 3-compartment modeling findings, graphical analysis (Table 2) resulted in a significant increase of Ki and Ki[G] (P < 0.0005) during the clamp in pooled groups. In single groups, the effect of hyperinsulinemia was particularly evident in normal-IS (P < 0.01) and high-IS (P < 0.005) groups before, and in all groups after, metabolite loss correction (Fig. 3).

Net HGU as measured by graphical analysis in each study population. *P < 0.05 vs. fasting. §P = 0.1 vs. fasting.
During the clamp, k4 values were significantly lower in both normal-IS subjects (2.0 ± 6.0 ·10−4·min−1, P < 0.05) and high-IS subjects (0.09 ± 0.03·10−4·min−1, P < 0.05) than in fasting normal-IS individuals (47 ± 83·10−4·min−1), despite a considerable interindividual variability. The magnitude of this change was 96.0% and 99.8%, respectively. Significantly higher values of k4 were observed during the clamp in low-IS patients than in normal- or high-IS subjects (34 ± 56·10−4·min−1, P < 0.05), and no significant inhibition of dephosphorylation rates (k4) could be detected in these patients. As a consequence, the k3/k4 ratio was significantly lower in this group than in the others during hyperinsulinemia (P < 0.05 vs. normal IS; P < 0.01 vs. high IS). Liver blood pool (VB) values did not change significantly from fasting to clamp (Table 2).
During the clamp, whole-body IS (M values) correlated significantly with the k3/k4 ratio (r = 0.45; P < 0.05) (Fig. 4). Plasma glucose levels were related to k3 (r = 0.43; P < 0.05) during the clamp but not during fasting. Plasma FFA were inversely related to graphical analysis–derived Ki (r = −0.60; P < 0.05) in the fasting state; this relationship was no longer present during the clamp. No relationship was observed between modeling variables and body mass index or age.
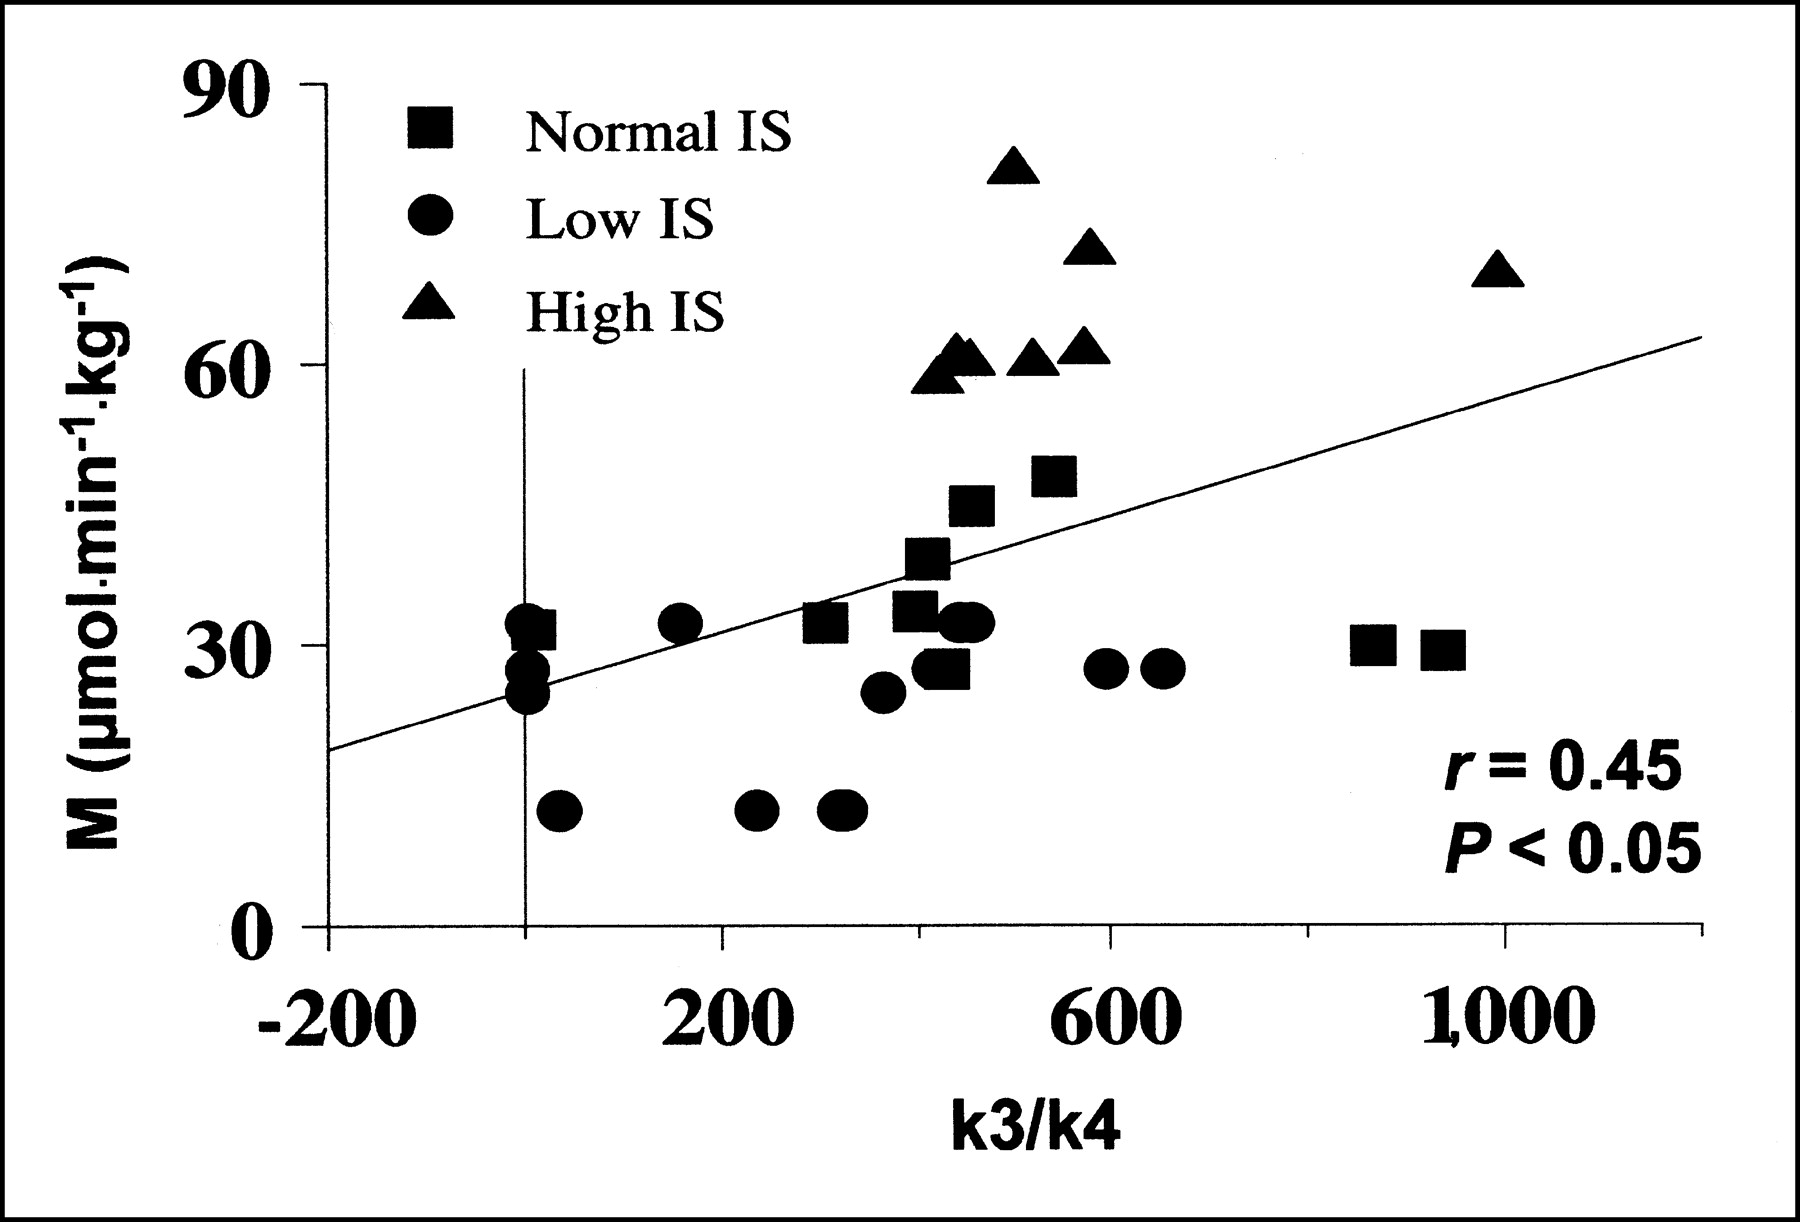
Correlation between whole-body glucose uptake during clamp (M value) and hepatic glucose phosphorylation/dephosphorylation ratios.
Patlak Graphical Analysis Versus Tracer Kinetic Modeling
Goodness-of-fit examples for data from the 3-compartment model and from graphical analysis are shown in Figures 5 and 6, respectively. Mean fitting r values for graphical analysis were 0.81 during fasting and 0.96 during the clamp. Data derived from graphical analysis and compartmental modeling were not significantly different in either condition, though results from graphical analysis (Table 2) tended to be lower than those derived from the model in the fasting state (Table 2). Metabolite loss correction was required in only 4 of 38 studies. Before correction, graphical analysis–derived Ki tended to be smaller in low-IS than in normal-IS subjects during the clamp (0.0032 ± 0.0012 μmol·min−1·mL−1, P = NS vs. normal IS). Data from the 2 mathematic approaches correlated both during fasting and during the clamp (Fig. 7).
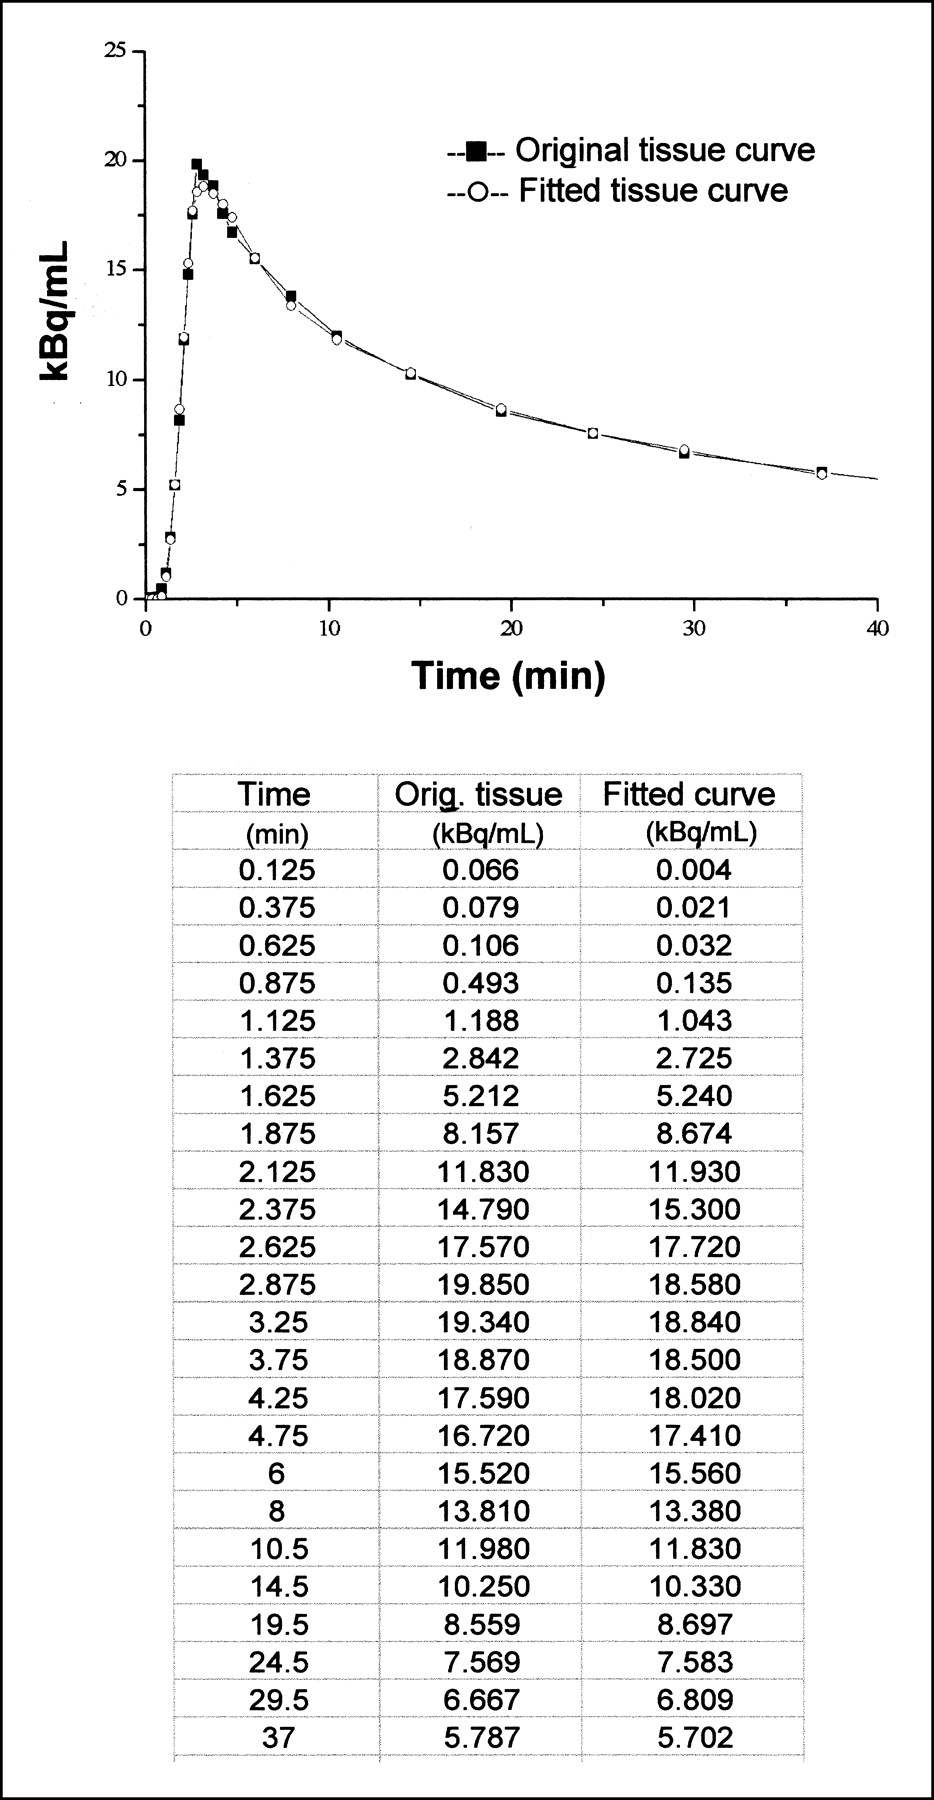
Graph shows nonlinear least squares fit for 3-compartment model and corresponding measured data. Table gives numeric values for the example shown.
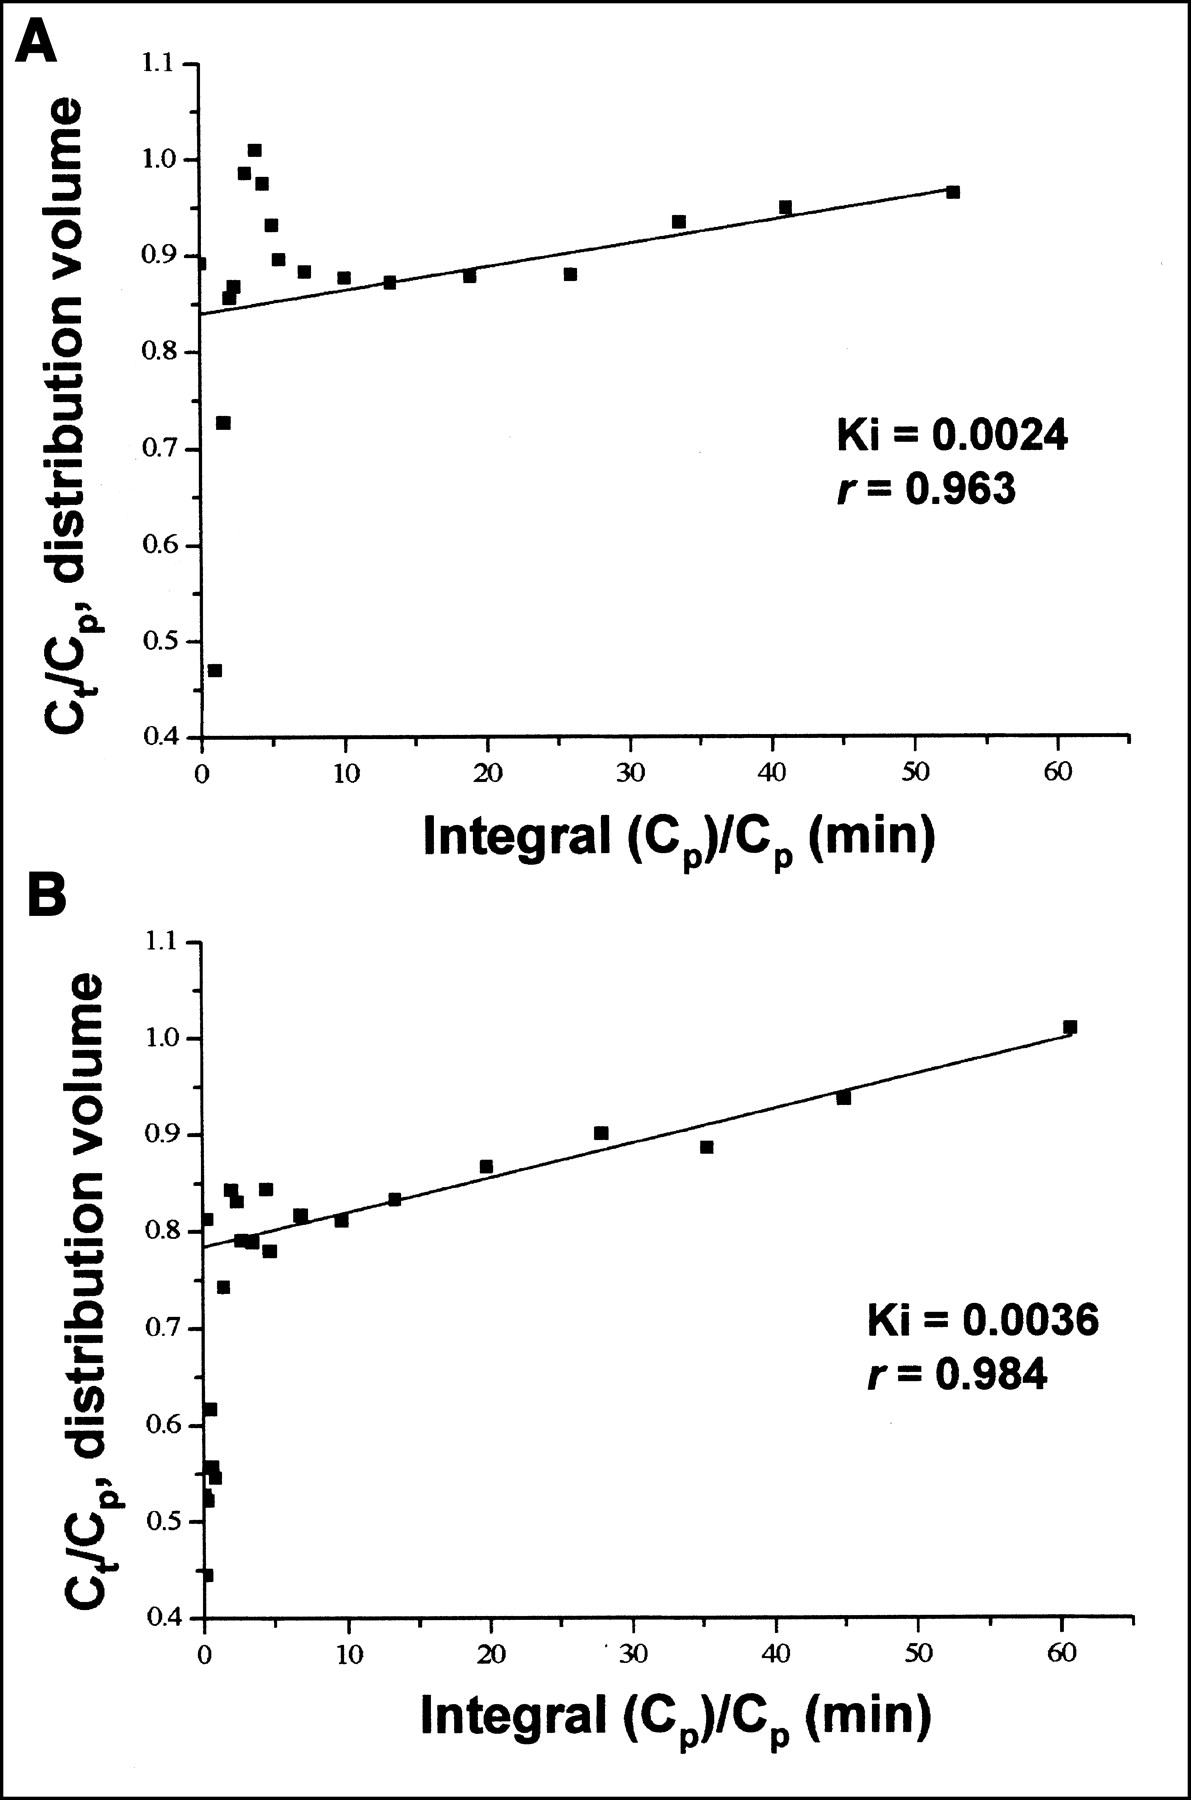
Linear least squares fit for Patlak plot and corresponding measured data during fasting (A) and clamp (B) in 1 study subject.
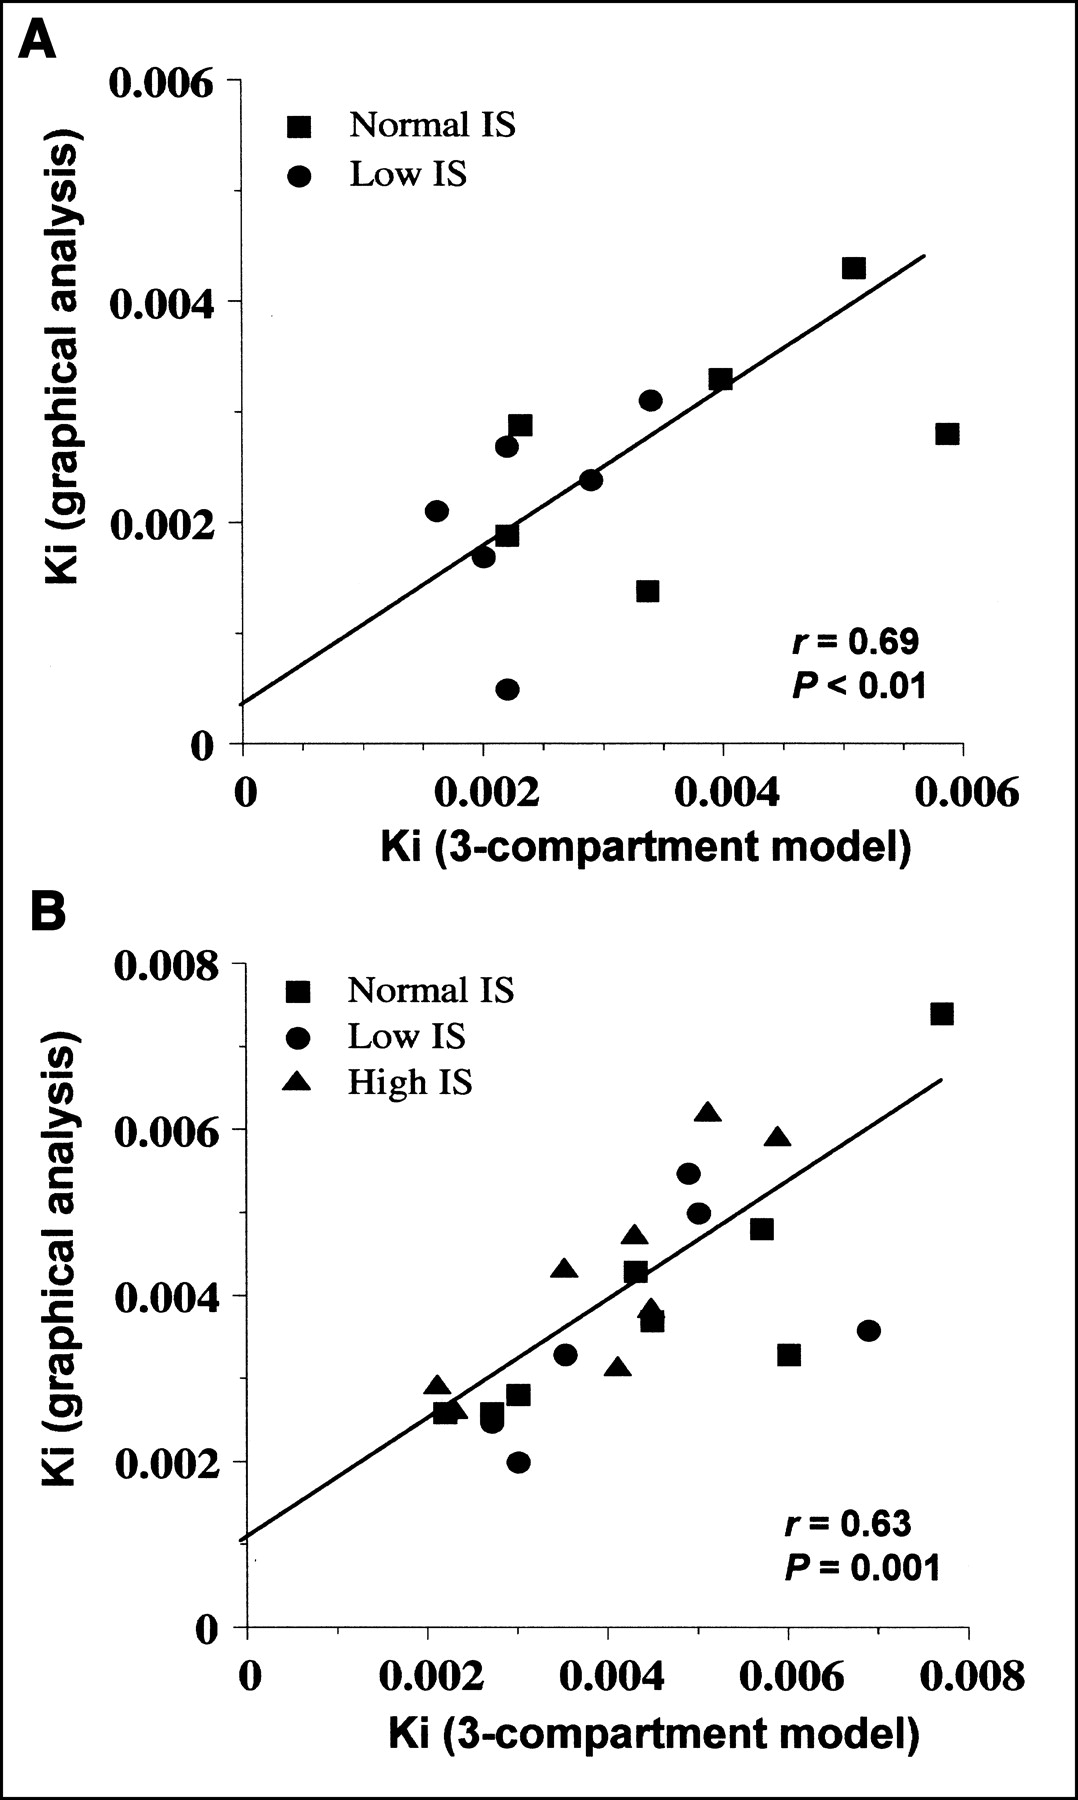
Correlations between 3-compartment model and graphical analysis influx rate constants during fasting (A) and clamp (B) in whole study group.
DISCUSSION
The present study indicated that insulin stimulates glucose uptake in the liver of both insulin-sensitive and insulin-resistant subjects. In addition, our results support the use of PET as a tool to investigate liver glucose metabolism in vivo. To our knowledge, no previous study has addressed the effect of insulin on liver glucose metabolism using a noninvasive method that allows selective targeting of the organ and isolation of the process of interest (e.g., HGU) from its reverse phenomenon (e.g., HGO); this method is in contrast to invasive techniques, which cannot distinguish between liver and splanchnic organs or between net glucose release and total endogenous glucose production.
Administration of insulin stimulated HGU by 50%–75%, regardless of the mathematic approach. HGU can be used interchangeably with Ki[G] because the latter is related to the former through a constant factor, given by the relative affinity of glucose and FDG for glucokinase (27). Using mean Ki[G] data and a liver weight of 1.5 kg, one can calculate a mean glucose influx of 23 μmol·min−1 in the fasting state and of 35 μmol·min−1 in the insulinized state. These values are of the same order of magnitude as those reported for resting skeletal muscle (21,24) and are approximately 20% of the rate of splanchnic glucose uptake measured in studies on healthy volunteers in which hepatic vein catheterization was combined with tracer glucose infusion (6). Taken together, these estimates indicate that nonhepatic splanchnic tissues (e.g., the gut) play a greater role than does the liver in glucose uptake under conditions of euglycemic hyperinsulinemia. However, it remains true that the splanchnic area as a whole contributes <5% of total-body glucose disposal under such conditions, a quantity that only hyperglycemia can raise substantially (6,7).
When subgroups were analyzed separately, hyperinsulinemia enhanced glucose uptake to a similar extent in insulin-sensitive and insulin-resistant subjects. In contrast, IS appeared to modulate the balance between reversible and irreversible glucose trapping, as estimated by the k3/k4 ratio. The high value of the k3/k4 ratio in the fasting state indicates a large dominance of the glucokinase reaction over the glucose-6-phosphatase reaction during our 40-min scanning time; because intrahepatic free glucose concentrations (the substrate for glucokinase) are high relative to intrahepatic glucose-6-phosphate concentrations (the substrate for glucose-6-phosphatase) (28), a high k3/k4 ratio translates into a net irreversible trapping of glucose in the liver. During the clamp, the k3/k4 ratio was moderately (although not statistically significantly) increased in subjects with normal or high IS but was significantly reduced in the insulin-resistant group. Because insulin-stimulated k3 values were similar in sensitive and resistant subjects, the low k3/k4 ratio in the resistant group is compatible with an impaired or delayed ability of insulin to inhibit dephosphorylation in the face of a preserved effect on phosphorylation. These results are in line with a vast literature on the regulation of hepatic glucose metabolism, showing that insulin potently suppresses HGO in healthy individuals (3,6,7) by stimulating glucokinase transcription (8,9) and glycogen synthase activity (10) while inhibiting glucose-6-phosphatase (11) and glycogen phosphorylase (10) in hepatocytes in vitro. Barzilai and Rossetti (29) reported that in both diabetic rats and nondiabetic rats, acute hyperinsulinemia (i.e., a 2-h euglycemic clamp) induced a 2-fold increase of glucokinase messenger RNA and significantly reduced glucose-6-phosphatase messenger RNA. Furthermore, in the pooled data from all our subjects, whole-body glucose uptake correlated with the k3/k4 ratio (Fig. 4). Thus, in our studies the presence of insulin resistance in the peripheral tissues (mostly skeletal muscle (2)) was associated with a shift in the phosphorylation-to-dephosphorylation balance such that glucose influx was enhanced by insulin but irreversible tissue trapping of glucose was blunted because of an unrestrained reverse reaction.
Interestingly, plasma FFA levels were inversely related to HGU at fasting, and HGU tended to increase more in the group in which suppression of FFA release was also more prominent during the clamp. These findings suggest that insulin action on liver glucose uptake might be mediated in part by the suppression of FFA release (30). Compared with normal-IS individuals, low-IS patients tended to have slightly lower fasting HGU despite their 2-fold higher plasma insulin concentrations. In these subjects, fasting plasma FFA levels were comparable to those of the other groups. Persistence of similar FFA release and slightly lower HGU in the face of fasting hyperinsulinemia speaks for a generalized state of insulin resistance.
Perfusion is conveyed to the liver through a dual source, the hepatic artery and the portal vein (7). A single arterial input function was used to model the present data; this might lead to slightly underestimated K1, k2, and VB but does not affect estimation of k3 and k4 (31), which were the target of the present investigation. In addition, the high values of K1 and k2 reported by us and others (15,31) indicate that blood flow and glucose transport are not rate limiting for glucose uptake in the liver (32); in such case, Ki is recognized to be independent of these processes (33) and would not be significantly influenced by the use of a single input function. Though an arterial input has been derived from imaging of the aorta by some authors (34), this choice would not have resolved the above limitation, and we opted for a more conservative approach. Furthermore, no loss of 18F-FDG has been shown to occur as blood flows across the splanchnic compartment before reaching the liver in the fasting state, and complex mathematic approximations of the dual input to the organ have led to great interindividual variability in animal studies (31,35). A measurement time of 40 min was chosen, in agreement with the recent evidence that intracellular accumulation of 18F-FDG metabolites might become a relevant confounding factor after this time (36,37). Prolonging scanning time and analysis up to 60 min (n = 14, data not shown) did not alter group comparisons. Because the present study focused primarily on HGU stimulation, we cannot establish whether k4 variability in insulin-resistant patients might be reduced after further delay. The compartmental modeling approach used in the current study has been previously demonstrated to provide a correct description of glucose-mediated stimulation of HGU in humans during oral glucose loading (15), which is a well-characterized physiologic phenomenon. Our rate-constant results are of the same order of magnitude as those observed in previous human and animal studies (15,31,35). Besides, plasma glucose concentrations were related to glucose phosphorylation during the clamp but not in the fasting state, confirming the well-known role of glucose in the regulation of HGU (2,5–7,15,38) and the importance of insulin as a permissive agent (7,39). Graphical analysis accurately described the data both during fasting and during clamp, confirming previous evidence from animal studies (31). Compared with compartmental modeling, graphical analysis gave similar results, as phosphorylation prevailed over dephosphorylation (k3 ≫ k4) during our 40-min scanning time. Interestingly, the lower levels of HGU in all subjects during fasting and in the low-IS group during the clamp estimated by graphical analysis suggest an influence of net HGU, whereas compartmental modeling reflects total uptake.
Our findings support other authors’ conclusion that both 3-compartmental modeling and graphical analysis are suitable for group comparisons of HGU in vivo in humans (15,31). Though the former more thoroughly describes each step involved, graphical analysis has the great advantages of being independent of single-versus-dual input function (31) and, therefore, of not being influenced by the methodologic problems caused by simultaneous perfusion of the liver by the hepatic artery and the portal vein.
CONCLUSION
Euglycemic hyperinsulinemia enhanced glucose uptake in the liver of our study subjects. Net HGU appeared to be stimulated in insulin-sensitive individuals, whereas higher dephosphorylation rates might have prevented this stimulation in insulin-resistant subjects. IS, rather than glucose transport, appeared to modulate the balance between phosphorylation and dephosphorylation. Finally, our data support the value of PET as a noninvasive technique for the assessment of HGU and demonstrate that graphical analysis can be used as an alternative or complementary approach to the study of liver glucose metabolism.
Footnotes
Received Jun. 17, 2002; revision accepted Nov. 27, 2002.
For correspondence or reprints contact: Patricia Iozzo, MD, Institute of Clinical Physiology, National Research Council (CNR), Via Moruzzi 1, 56100 Pisa, Italy.
E-mail: patricia.iozzo{at}ifc.cnr.it
REFERENCES
In this issue


Jump to section
Related Articles
Cited By...
- Noninvasive Imaging of Drug-Induced Liver Injury with 18F-DFA PET
- Insulin-stimulated glucose uptake in skeletal muscle, adipose tissue and liver: a positron emission tomography study
- Positron Emission Tomography/Computerized Tomography in Newly Diagnosed Patients with Giant Cell Arteritis Who Are Taking Glucocorticoids
- Fasting hepatic glucose uptake is higher in men than women
- Hepatic glucose utilization in hepatic steatosis and obesity
- Fallacy of Quantifying Lymphoma Activity by Scaling to the Liver in [18F]Fluorodeoxyglucose Positron Emission Tomography (Deauville criteria)
- Methodologic Considerations for Quantitative 18F-FDG PET/CT Studies of Hepatic Glucose Metabolism in Healthy Subjects
- Positron emission tomography assessment of large vessel inflammation in patients with newly diagnosed, biopsy-proven giant cell arteritis: a prospective, case-control study
- Bringing Physiology into PET of the Liver
- Liver Fat Content in Type 2 Diabetes: Relationship With Hepatic Perfusion and Substrate Metabolism
- Impact of Intravenous Insulin on 18F-FDG PET in Diabetic Cancer Patients
- Assessment of Large-Vessel Involvement in Giant Cell Arteritis with 18F-FDG PET: Introducing an ROC-Analysis-Based Cutoff Ratio
- 18F-FDG Assessment of Glucose Disposal and Production Rates During Fasting and Insulin Stimulation: A Validation Study
- Alterations in Postprandial Hepatic Glycogen Metabolism in Type 2 Diabetes