


Abstract
PET with the glucose analog 18F-FDG is used to measure regional tissue metabolism of glucose. However, 18F-FDG may have affinities different from those of glucose for plasma membrane transporters and intracellular enzymes; the lumped constant (LC) can be used to correct these differences kinetically. The aims of this study were to investigate the feasibility of measuring human hepatic glucose metabolism with dynamic 18F-FDG PET/CT and to determine an operational LC for 18F-FDG by comparison with 3H-glucose measurements. Methods: Eight healthy human subjects were included. In all studies, 18F-FDG and 3H-glucose were mixed in saline and coadministered. A 60-min dynamic PET recording of the liver was performed for 180 min with blood sampling from catheters in a hepatic vein and a radial artery (concentrations of 18F-FDG and 3H-glucose in blood). Hepatic blood flow was determined by indocyanine green infusion. First, 3 subjects underwent studies comparing bolus administration and constant-infusion administration of tracers during hyperinsulinemic–euglycemic clamping. Next, 5 subjects underwent studies comparing fasting and hyperinsulinemic–euglycemic clamping with tracer infusions. Splanchnic extraction fractions of 18F-FDG (E*) and 3H-glucose (E) were calculated from concentrations in blood, and the LC was calculated as ln(1 – E*)/ln(1 – E). Volumes of interest were drawn in the liver tissue, and hepatic metabolic clearance of 18F-FDG (mL of blood/100 mL of liver tissue/min) was estimated. Results: For bolus versus infusion, E* values were always negative when 18F-FDG was administered as a bolus and were always positive when it was administered as an infusion. For fasting versus clamping, E* values were positive in 4 of 5 studies during fasting and were always positive during clamping. Negative extraction fractions were ascribed to the tracer distribution in the large volume of distribution in the prehepatic splanchnic bed. The LC ranged from 0.43 to 2.53, with no significant difference between fasting and clamping. Conclusion: The large volume of distribution of 18F-FDG in the prehepatic splanchnic bed may complicate the analysis of dynamic PET data because it represents the mixed tracer input to the liver via the portal vein. Therefore, dynamic 18F-FDG data for human hepatic glucose metabolism should be interpreted with caution, but constant tracer infusion seems to yield more robust results than bolus injection.
The liver plays an important role in keeping the blood glucose concentration within a narrow physiologic range. In the postprandial state, the liver takes up glucose from the blood and stores it as glycogen; during fasting, glucose is released. This essential liver function can become impaired in diseases such as diabetes and nonalcoholic fatty liver disease. This potential for disease has led to an increasing interest in methods for the noninvasive functional evaluation of hepatic glucose metabolism (1). The splanchnic balance technique with measurements of concentrations in blood from an artery and a hepatic vein has traditionally been used (2), but this method is invasive and does not provide any information on potential regional differences in glucose metabolism within the liver.
PET is an excellent tool for noninvasive studies of metabolic processes in vivo. PET provides 3-dimensional images that enable studies of regional differences within organs. The glucose analog 18F-FDG is widely used in PET studies of glucose metabolism because the tracer is taken up by the same plasma membrane transporters and phosphorylated by the same intracellular enzymes as glucose. An advantage of using 18F-FDG for glucose metabolism studies is that the metabolism of 18F-FDG essentially stops after 6-phosphorylation, simplifying the kinetic analysis of dynamic 18F-FDG PET data (3). However, the replacement of the 2-hydroxyl group with 18F may cause 18F-FDG to have affinities for plasma membrane transporters and intracellular enzymes different from those of glucose (3). Accordingly, 18F-FDG kinetics may need to be adjusted to infer kinetic rate constants for glucose metabolism. When metabolism is in the steady state, the difference between 18F-FDG kinetics and glucose kinetics can be expressed as the lumped constant (LC), which is defined as the ratio of the intrinsic clearance of the tracer to the intrinsic clearance of glucose (3,4). Through the simultaneous measurement of arterial input and venous output concentrations of the glucose analog tracer (here, 18F-FDG) and a true glucose tracer (here, 3H-glucose), the LC can be determined from the steady-state extraction fractions of the 2 tracers (4). 18F-FDG was previously used in studies of human hepatic glucose metabolism, but the LC for 18F-FDG in liver tissue has only been determined in pigs (5). The main aim of the present study was to determine an operational LC for 18F-FDG in human liver tissue through the simultaneous administration of 18F-FDG and 3H-glucose.
When PET studies of the liver are performed, the dual blood supply to the liver from the portal vein (∼75%) and the hepatic artery (∼25%) may interfere with measurements, primarily because the large volume of distribution in the prehepatic splanchnic bed causes the time course of the radioactivity concentration in portal blood to be significantly different from that in arterial blood (6). As a result, the calculation of extraction fractions from arterial-venous differences for substrates administered as a bolus may be problematic. To address this potential problem, we first investigated the benefits of using constant tracer infusion instead of bolus injection in 3 subjects before conducting studies to determine the LC. Next, we performed dynamic 18F-FDG PET/CT of the liver during fasting and euglycemic–hyperinsulinemic clamping in 5 subjects to determine an operational LC for 18F-FDG in hepatic glucose metabolic PET studies in these 2 physiologically different states.
MATERIALS AND METHODS
Subjects
Eight healthy human subjects (2 women and 6 men; mean age, 57 y; range, 51–63 y) were included after they responded to an advertisement in a local newspaper. None of the subjects was obese or had diabetes or any medical history, symptoms, or signs of liver disease. They were studied after an overnight fast.
The study was approved by the Central Denmark Region Committees on Biomedical Research Ethics and was performed in accordance with the Helsinki II Declaration and Danish legislation. Written informed consent was obtained from each subject. No complications in the procedures were observed.
Study Design and Experimental Procedures
All subjects were investigated twice within 4–20 wk (median, 6 wk); because of the long radioactive half-life of 18F-FDG (109.7 min), only 1 PET study could be performed in the same subject on the same day. In all studies, 18F-FDG and 3H-glucose were mixed in physiologic saline and coadministered. In the first part of the investigation, 3 subjects underwent studies with euglycemic–hyperinsulinemic clamping on both days; 18F-FDG and 3H-glucose were administered either as a constant infusion initiated by a small priming dose or as a bolus (in random order and with the subject unaware of the type of administration). Next, 5 subjects underwent both fasting and clamping studies (in random order and with the subject unaware of the type of study) with 18F-FDG and 3H-glucose coadministered as a constant infusion initiated by a small priming bolus. One subject underwent only a fasting study because a back injury prevented him from participating again.
Catheterizations
For blood sampling, a catheter (Artflon; Becton Dickinson) was placed percutaneously in a radial artery, and a 6F catheter (Cook Medical) was placed in a hepatic vein via an introducer sheet in the right femoral vein. Intravenous lines (Venflon; Becton Dickinson) were placed in both antecubital veins for the administration of tracers and indocyanine green (ICG; Hyson, Wescott and Dunning).
Hyperinsulinemic–Euglycemic Clamping
A constant infusion of insulin (0.6 mU/kg of body weight/min (7)) was started at least 90 min before the tracers were administered. Blood glucose was kept at approximately 5 mmol of glucose per liter of blood by adjusting the infusion of 20% glucose.
18F-FDG PET/CT Protocol and Administration of Tracers
The scanner was a 64-slice Biograph TruePoint PET/CT camera (Siemens AG) with a 21-cm transaxial field of view. A low-dose CT scan (50 [effective] mAs with CARE Dose 4D [Siemens AG]; 120 kV; pitch, 0.8; slice thickness, 5 mm) was performed for the definition of anatomic structures and attenuation correction of PET data.
In bolus studies, median doses of 203 MBq of 18F-FDG (range, 190–225 MBq) and 3 MBq of 3H-glucose were mixed in 10 mL of saline, and the solution was administered intravenously over a time course of 20 s in the beginning of the PET recording. In infusion studies, median doses of 527 MBq of 18F-FDG (range, 230–550 MBq) and 3 MBq of 3H-glucose were dissolved in 60 mL of saline, a priming bolus of 3 mL was given at time zero, and then constant infusion of the solution was initiated; the infusion was administered for 3 h (15 mL/h). The median total radiation dose from all procedures was 8.6 mSv (range, 6.3–9.0 mSv).
Data Processing
PET data were recorded in the list mode and reconstructed with resolution modeling (4 iterations, 21 subsets, 2-mm gaussian filter, separate prompts/randoms), yielding images with 336 × 336 × 109 voxels (each voxel was 2 × 2 × 3 mm3) and a central spatial resolution of 4 mm (full width at half maximum). Measurements were corrected for radioactivity decay back to the start of the scan. The time frame structure was 18 × 5, 15 × 10, 4 × 30, 4 × 60, and 10 × 300 s (total, 60 min).
Blood Samples
For the determination of blood 18F-FDG concentrations, blood samples (0.2 mL) were collected at 18 × 5, 6 × 10, 2 × 30, 3 × 60, 1 × 120, 1 × 240, 1 × 360, 4 × 600, 1 × 950, and 7 × 900 s (total, ∼180 min) from the radial artery and the hepatic vein, and counts were obtained with a well counter (Packard Instruments). Measurements were corrected for radioactive decay back to the start of the PET recording and were used to create time–activity curves of the radioactivity concentrations in blood (time–activity curve; kBq/mL of blood vs. time in min). At 3, 12.5, 28.5, 38.5, 58.5, 90, 120, 150, and 180 min, additional samples of 5 mL of blood were collected from the radial artery and the hepatic vein for the determination of blood 3H-glucose concentrations by liquid scintillation counting (7); an arterial blood sample collected before administration of the tracer was used to determine the background. Blood samples for 3H-glucose were collected in the same tubes as blood samples for 18F-FDG.
Hepatic Blood Flow
Hepatic blood flow was measured by constant intravenous infusion of ICG and the Fick principle (8,9). The ICG infusion was started at least 90 min before the PET/CT study. During the study period of 180 min, 5 pairs of blood samples were collected from the radial artery and the hepatic vein for the determination of plasma ICG concentrations. No systematic variations during the day were observed in any of the subjects, and the mean plasma ICG concentrations in the 2 vessels, corrected for measured hematocrit values, were used to calculate the mean hepatic blood flow (L of blood/min) for each subject (10). Hepatic blood perfusion (mL of blood/min/mL of liver tissue) was calculated by correcting the mean hepatic blood flow for a liver density of 1.07 g/mL of liver tissue and a liver size of 2% of body weight (11).
Data Analysis
18F-FDG PET/CT Data
A volume of interest was drawn within the liver, avoiding the central part of the organ and large intrahepatic blood vessels, and was used to generate a time–activity curve of the radioactivity concentration in liver tissue (time–activity curve for the liver; kBq/mL of liver tissue vs. time in min). Individual volumes of interest were used for each PET recording.
Hepatic systemic clearance of 18F-FDG (K*; mL of blood/100 mL of liver tissue/min) was determined from a Gjedde–Patlak representation of the data (12,13). In this analysis, which assumes irreversible metabolic trapping of the tracer, K* is given as the asymptote fitted to the linear part of the relationship between the radioactivity concentration time course in the tissue (PET) and arterial blood samples at the quasi–steady state (12,13). All individual Gjedde–Patlak plots were visually inspected. In all plots, the quasi–steady state was reached after 15 min; after 40 min, the plots tended to bend compatible with dephosphorylation. Therefore, we used data from 15–40 min after 18F-FDG administration to calculate K*.
From PET data, a steady-state hepatic extraction fraction of 18F-FDG was calculated as K* divided by hepatic blood perfusion.
Blood Samples and LC for 18F-FDG
Splanchnic extraction fractions of 18F-FDG (E*) and 3H-glucose (E) from blood were calculated as (Cartery – Cvein)/Cartery, where Cartery is the concentration in the artery and Cvein is the concentration in the vein, and were corrected for a mean splanchnic transit time of 1 min (14).
For studies in which both E* and E values were positive, the LC was calculated as ln(1 – E*)/ln(1 – E) (4).
Statistics
Linear regression was used to calculate K* from PET data according to the Gjedde–Patlak method (12,13) with maximum-likelihood estimation. Normally distributed data within the same subject were compared with a paired t test. For data that were not normally distributed, the signed rank test was used. A P value of less than 0.05 was interpreted as indicating a statistically significant difference.
RESULTS
Mean hepatic blood flow during fasting was 1.19 L of blood/min (range, 0.93–1.69 L of blood/min) and was not significantly different from mean hepatic blood flow during clamping (1.34 L of blood/min; range, 0.90–1.74 L of blood/min) (P > 0.05). All subjects were normoglycemic during fasting.
Bolus Versus Infusion Administration of Tracers
Blood and Liver Time–Activity Curves
When 18F-FDG was administered as a bolus, both arterial and hepatic venous blood time–activity curves showed a clear peak followed by a continuous decline. The peak in the arterial time–activity curve was observed before that in the venous time–activity curve, in accordance with a delay from the passage through the splanchnic and hepatic beds (Fig. 1A). The time–activity curve for the liver also showed a peak followed by a slow decline over time (Fig. 1A). For 3H-glucose, the peaks were not observed because of fewer blood samples, but both curves showed a continuous decline over time. These observations are consistent with continuous removal of 18F-FDG and 3H-glucose from blood.
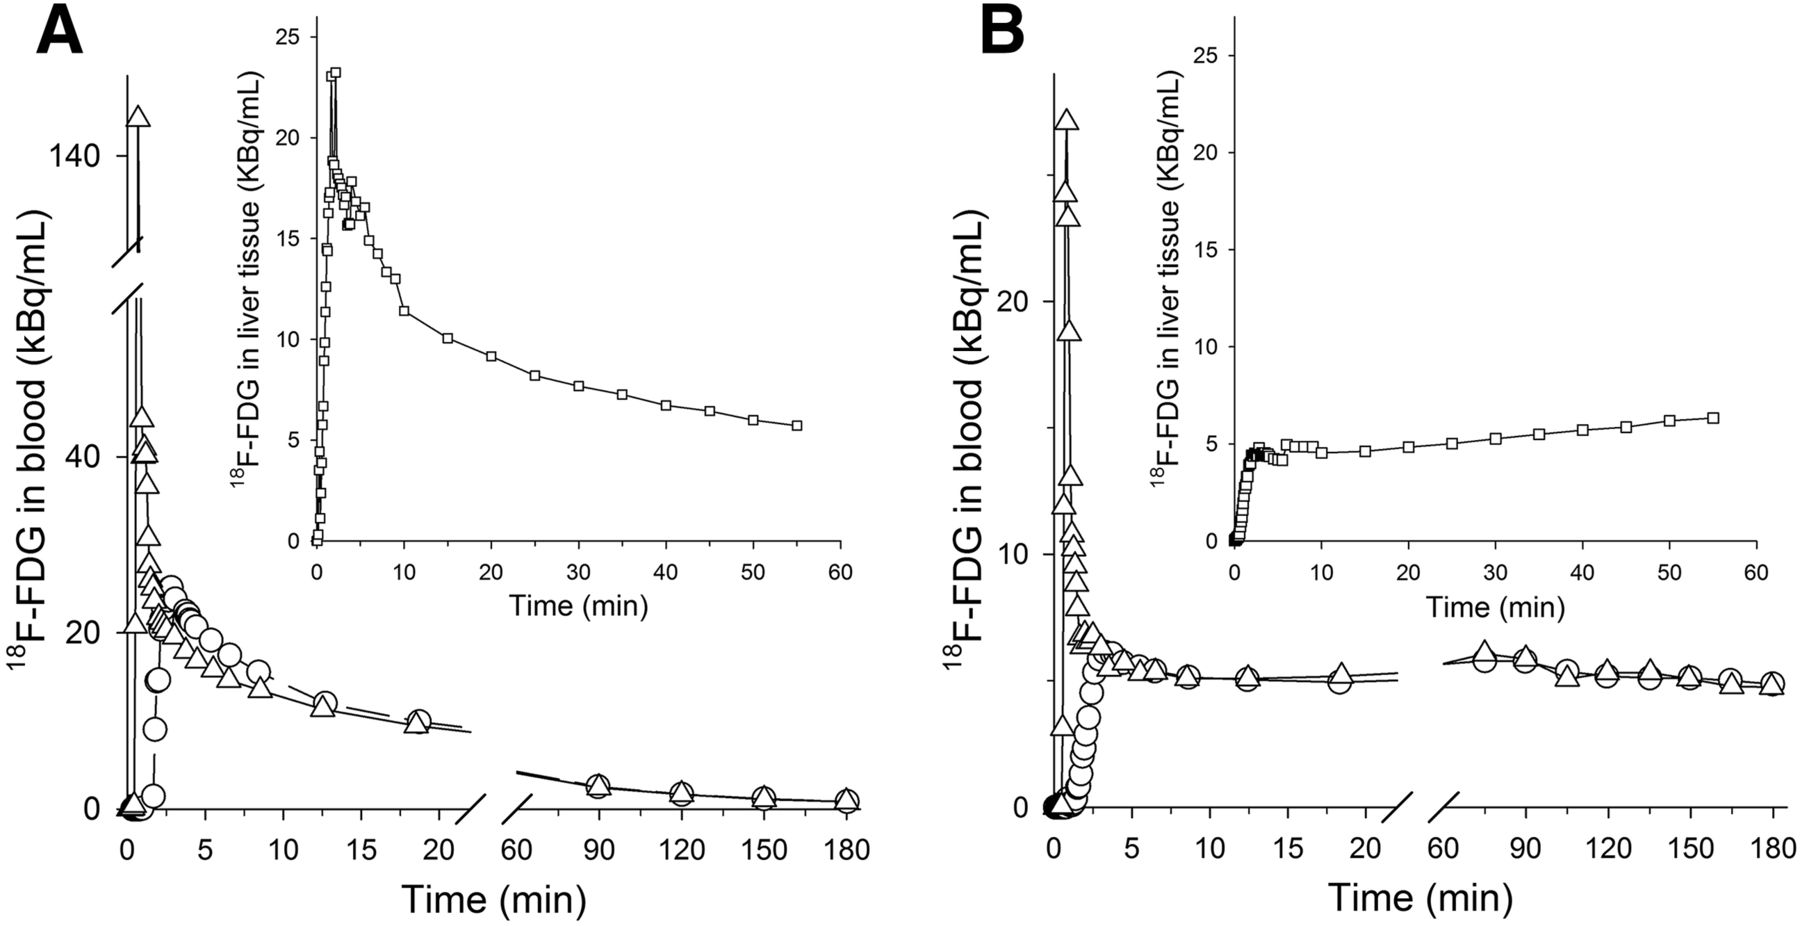
Time–activity curves for 18F-FDG in arterial blood (△), hepatic venous blood (○), and liver tissue (▯, insets) when 18F-FDG was administered either as bolus (A) or as constant infusion initiated by priming bolus (B). Both studies were performed during euglycemic –hyperinsulinemic clamping in same healthy human subject.
In infusion studies, a small peak from the priming dose was seen in both the arterial and the hepatic venous time–activity curves. After this initial peak, both time–activity curves increased until approximately 7–10 min, from which time point they remained constant throughout the study period of 180 min (Fig. 1B). The blood 18F-FDG concentration in the hepatic vein was slightly lower than that in the artery, indicating net hepatic uptake of 18F-FDG (Fig. 1B). After an initial small peak from the priming dose, the time–activity curve for the liver showed continuous accumulation of radioactivity (Fig. 1B). The curve for the blood 3H-glucose concentration was similar to that for 18F-FDG, although the arterial concentration was not always higher than the hepatic venous concentration.
Extraction Fractions of 18F-FDG and 3H-Glucose from Blood Samples
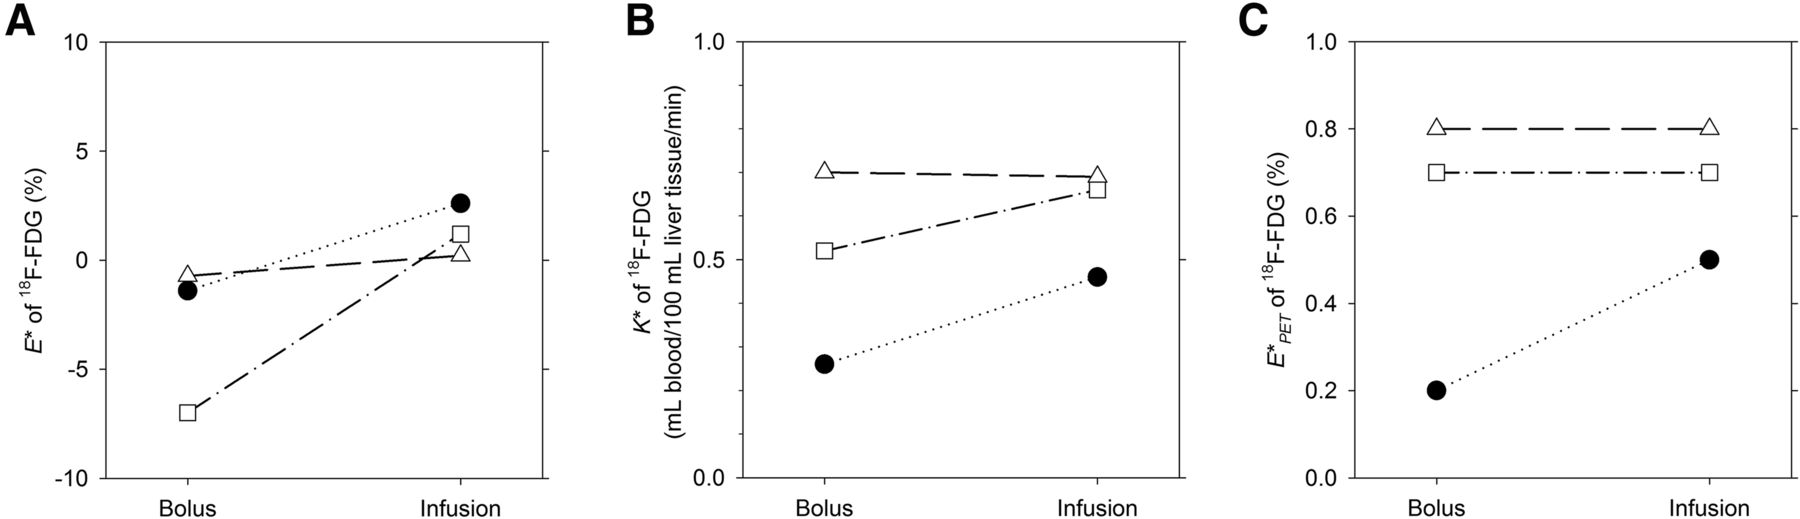
When 18F-FDG was administered as a bolus, E* values were negative during the PET recording (i.e., 60 min) in all subjects (Fig. 2A) and remained so for the remainder of the study. When 18F-FDG was administered as a constant infusion, E* values were positive in all 3 subjects (P = 0.17) (Fig. 2A). When 3H-glucose was administered as a bolus, E values were positive in 2 subjects and negative in 1 subject during the PET study. When 3H-glucose was administered as an infusion, E values were negative in 2 subjects and positive in 1 subject (P = 0.32).

Paired data for extraction fractions of 18F-FDG calculated from arterial and hepatic venous blood samples (A), hepatic systemic clearance of 18F-FDG (B), and extraction fractions of 18F-FDG calculated from PET data (E*PET) (C). Different symbols represent different subjects (n = 3). Left symbol in each pair of symbols represents results from 18F-FDG administered as bolus, and right symbol in each pair of symbols represents results from 18F-FDG administered as constant infusion initiated by small priming bolus.
Hepatic Systemic Clearance of 18F-FDG
K* values were positive in all studies, indicating a net accumulation of 18F-FDG in the liver. When 18F-FDG was administered as a bolus, K* values ranged from 0.26 to 0.70 mL of blood/100 mL of liver tissue/min; when it was administered as a continuous infusion, K* values ranged from 0.46 to 0.69 mL of blood/100 mL of liver tissue/min (P = 0.22) (Fig. 2B). With bolus administration, the steady-state hepatic extraction fraction of 18F-FDG ranged from 0.2% to 0.8%; with administration by continuous infusion, it ranged from 0.5% to 0.8% (P = 0.42) (Fig. 2C).
Fasting Versus Clamping
Although the difference between E* values when 18F-FDG was administered as an infusion versus as a bolus was not statistically significant, we chose to continue with constant infusion because the calculation of LC requires a net removal and thus positive extraction fractions of tracers.
Blood and Liver Time–Activity Curves
During fasting, blood 18F-FDG time–activity curves for both the artery and the hepatic vein showed a peak from the priming bolus followed by a slow, continuous increase during the study period; however, a steady concentration was not reached. The peak in the arterial time–activity curve was observed before the peak in the venous time–activity curve (Fig. 3A). The time–activity curve for the liver also showed a peak followed by a slow increase over time (Fig. 3A). For 3H-glucose, a slow increase in the concentration in blood for both the artery and the hepatic vein was also observed.

Time–activity curves for 18F-FDG in arterial blood (△), hepatic venous blood (○), and liver tissue (▯, insets) when 18F-FDG was administered as constant infusion initiated by small priming bolus during fasting (A) and during euglycemic–hyperinsulinemic clamping (B). Data were from same healthy human subject.
The results from clamping studies were similar to those from infusion studies in the first part of the investigation (Fig. 3B).
Extraction Fractions of 18F-FDG and 3H-Glucose from Blood Samples
When studied during fasting, E* values were positive in 3 of the 4 subjects and remained so throughout the study period (Fig. 4A). When studied during clamping, E* values were positive during PET in all 4 subjects and remained so throughout the study period (Fig. 4A). In 2 subjects, E* values increased from fasting to clamping, and in 2 subject, E* values decreased (P = 0.22). For 3H-glucose, E values were positive in all subjects during fasting and clamping. E values decreased from fasting to clamping in 2 subjects and increased in the other 2 subjects (P = 0.33).

Paired data for extraction fractions of 18F-FDG calculated from arterial and hepatic venous blood samples (A), hepatic systemic clearance of 18F-FDG (B), and extraction fractions of 18F-FDG calculated from PET data (E*PET) (C). 18F-FDG was administered as constant infusion initiated by small priming bolus. Different symbols represent different subjects (n = 4). Left symbol in each pair of symbols represents results obtained during fasting, and right symbol in each pair of symbols represents results obtained during euglycemic–hyperinsulinemic clamping. (1 subject [*] underwent study only during fasting.)
Hepatic Systemic Clearance of 18F-FDG
K* values were positive in all subjects and ranged from 0.32 to 1.5 mL of blood/100 mL of liver tissue/min during fasting and from 0.27 to 0.87 mL of blood/100 mL of liver tissue/min during clamping (P = 0.48) (Fig. 4B). The steady-state hepatic extraction fractions of 18F-FDG ranged from 0.4% to 2.4% during fasting and from 0.2% to 1.4% during clamping (P = 0.34) (Fig. 4C).
LC
Because calculation of the LC is based on Michaelis–Menten kinetics, the calculation can be done only if the extraction fractions of the 2 tracers are both positive (3,4). Accordingly, the LC was calculated only with data from studies of fasting versus clamping and constant infusion. In 1 subject, E* values were negative during fasting, and the LC accordingly was calculated only with data from the remaining subjects. Data from these subjects yielded a mean LC during fasting of 1.31 (range, 0.80–1.75). In all subjects, E* and E values were both positive during clamping, and the mean LC was 1.72 (range, 0.43–2.53); this LC was not significantly different from the LC during fasting (P > 0.7).
DISCUSSION
The results of the present study reveal some important physiologic challenges associated with the use of 18F-FDG PET for the quantitative evaluation of human hepatic glucose metabolism. In humans, the net balance of substrates across the liver can be assessed only from arterial and hepatic vein blood samples, which inevitably include distribution in the whole splanchnic bed. This scenario was demonstrated in the comparison of bolus versus infusion administration of tracers; negative E* values were obtained when 18F-FDG was administered as a bolus.
Hexoses enter hepatocytes very efficiently, with a blood-to-hepatocyte clearance close to that of hepatic blood flow (5,6,15). Because of the relatively low phosphorylation rate, most of the 18F-FDG remains nonmetabolized in hepatocytes and is thus subject to backward flux from hepatocytes to blood (5,6). In a pig study with 18F-FDG and 6,6-deuterated glucose administered as a bolus injection and blood samples from an artery, the portal vein, and a hepatic vein, the extraction fraction values of the 2 tracers across the liver were negative during fasting but became positive during euglycemic–hyperinsulinemic clamping (5). In the present study involving healthy human subjects and measurements from an artery and a hepatic vein, negative E* values were observed after a bolus injection of 18F-FDG, even during the clamping condition. This finding suggests that in humans, it is mainly the distribution in the prehepatic splanchnic bed that contributes to the observed negative extraction fraction values, because the stimulation of hepatic glucose uptake did not result in positive splanchnic extraction fraction values. Because a true steady state is never reached after a bolus injection, we attempted to adjust for the quasi–steady state condition by correcting the measurements of tracer concentrations in arterial and hepatic venous blood by a mean transit time of 1 min (14), which is appropriate for the galactose tracer 2-18F-fluoro-2-deoxy-d-galactose, which is also a hexose (16). However, this adjustment seemed too short for 18F-FDG, because the extraction fraction values remained negative even though the experiments were performed during hyperinsulinemic–euglycemic clamping, which should have stimulated hepatic uptake of 3H-glucose and 18F-FDG (17). For positive E* values to be obtained, a nonphysiologic mean transit time of more than 30 min would have to be applied.
When the tracers were administered as continuous infusions, positive E* values were observed, and we accordingly continued with this method of administering the tracers. However, although this approach yielded positive extraction fraction values, we cannot conclude anything about the concentration in the portal vein and thus the mixed tracer input to the liver, which is important for an analysis of PET data (6).
Compared with fasting, clamping did not affect K* for 18F-FDG. This observation is in agreement with the observation by Iozzo et al., who found K* in the liver to be unaffected by insulin in healthy human subjects with normal insulin sensitivity (18). Our results are also in line with splanchnic balance studies in which insulin did not affect glucose uptake during euglycemic hyperinsulinemia (2,17). Although the graphic analysis of 18F-FDG PET data according to the Gjedde–Patlak method (12,13) indicated that steady state metabolism was reached after 15 min, it was difficult to determine the potential influence of the distribution of the tracer in the prehepatic splanchnic bed on the correct tracer input to the liver, that is, the mixed arterial–portal venous blood tracer concentration at the inlet of the sinusoids. Through direct comparison of arterial and portal blood sampling in pigs, it has been shown that arterial blood 18F-FDG concentrations can replace the dual input from the artery and the portal vein in a data analysis (5,6), but the significant effect of the volume of distribution on E* values in the present study suggests that the same may not be true in humans.
The LC for 18F-FDG was not significantly different from unity, and hyperinsulinemic–euglycemic clamping did not affect the value. These observations are similar to those from in vivo studies of human skeletal muscle (19), but the metabolic fates of 18F-FDG and 3H-glucose in the liver are somewhat different from those in skeletal muscle. Although metabolites of 18F-FDG are observed in liver tissue over time (20), the main metabolic fate of 18F-FDG during the study period of 180 min in the present investigation was phosphorylation, possibly with a minor fraction being dephosphorylated (as indicated by the tendency for the Gjedde–Patlak plots to bend beyond 40 min); however, 3H-glucose, being a true glucose tracer, is subject to both glycolysis and incorporation in glycogen. Accordingly, the calculation of the LC from extraction fractions depends not only on different affinities for plasma membrane transporters and intracellular enzymes but also on differences in intracellular metabolic fates. Because the mixed arterial–portal venous tracer input to the liver cannot be measured directly, a full kinetic analysis of the data, with the determination of specific rate constants, cannot be performed in humans (6). The large range in LC (0.43–2.53), together with the clear influence of the prehepatic splanchnic volume of distribution on the measurements, also brings into question the precision of the calculation of the LC; however, it is probably fair to assume that the LC was not different from unity.
We acknowledge that the number of subjects in the present study was relatively low, but we decided not to include any more subjects because we believed that including more subjects would not have been ethically justifiable due to the invasive nature of the study and the exposure to radiation. Nonetheless, the results of the present study emphasize important issues that must be considered when 18F-FDG PET/CT studies of liver glucose metabolism are performed in humans, by demonstrating both the dramatic effects of the large volume of distribution of the tracer in the splanchnic bed and the difficulty in estimating a robust LC, even in the livers of healthy subjects.
CONCLUSION
The present study brings into question the use of dynamic 18F-FDG PET/CT for the quantitative measurement of hepatic glucose metabolism in human subjects. In particular, the large volume of distribution of 18F-FDG in the prehepatic splanchnic bed may affect data analysis significantly and in an unpredictable manner because it determines the mixed tracer input to the liver via the portal vein and the hepatic artery. A constant infusion of a tracer may yield more valid results than a bolus injection.
DISCLOSURE
The costs of publication of this article were defrayed in part by the payment of page charges. Therefore, and solely to indicate this fact, this article is hereby marked “advertisement” in accordance with 18 USC section 1734. This study was funded in part by the Danish Medical Council (09-073658) and the NIH (R01-DK074419). No other potential conflict of interest relevant to this article was reported.
Footnotes
Published online Jul. 9, 2015.
- © 2015 by the Society of Nuclear Medicine and Molecular Imaging, Inc.
REFERENCES
- Received for publication January 12, 2015.
- Accepted for publication May 21, 2015.


Jump to section
Related Articles
Cited By...
- Dynamic PET of Human Liver Inflammation: Impact of Kinetic Modeling with Optimization-Derived Dual-Blood Input Function
- Fasting hepatic glucose uptake is higher in men than women
- Hepatic glucose utilization in hepatic steatosis and obesity
- How Should Lumped Constant Be Estimated for Hepatic 18F-FDG Glucose in Humans?