
Main menu

  • Home
  • Content
    • Current
    • Ahead of print
    • Past Issues
    • JNM Supplement
    • SNMMI Annual Meeting Abstracts
    • Continuing Education
    • JNM Podcasts
  • Subscriptions
    • Subscribers
    • Institutional and Non-member
    • Rates
    • Journal Claims
    • Corporate & Special Sales
  • Authors
    • Submit to JNM
    • Information for Authors
    • Assignment of Copyright
    • AQARA requirements
  • Info
    • Reviewers
    • Permissions
    • Advertisers
  • About
    • About Us
    • Editorial Board
    • Contact Information
  • More
    • Alerts
    • Feedback
    • Help
    • SNMMI Journals
  • SNMMI
    • JNM
    • JNMT
    • SNMMI Journals
    • SNMMI

User menu

  • Subscribe
  • My alerts
  • Log in
  • My Cart

Search

  • Advanced search
Journal of Nuclear Medicine
  • SNMMI
    • JNM
    • JNMT
    • SNMMI Journals
    • SNMMI
  • Subscribe
  • My alerts
  • Log in
  • My Cart
Journal of Nuclear Medicine

Advanced Search

  • Home
  • Content
    • Current
    • Ahead of print
    • Past Issues
    • JNM Supplement
    • SNMMI Annual Meeting Abstracts
    • Continuing Education
    • JNM Podcasts
  • Subscriptions
    • Subscribers
    • Institutional and Non-member
    • Rates
    • Journal Claims
    • Corporate & Special Sales
  • Authors
    • Submit to JNM
    • Information for Authors
    • Assignment of Copyright
    • AQARA requirements
  • Info
    • Reviewers
    • Permissions
    • Advertisers
  • About
    • About Us
    • Editorial Board
    • Contact Information
  • More
    • Alerts
    • Feedback
    • Help
    • SNMMI Journals
  • View or Listen to JNM Podcast
  • Visit JNM on Facebook
  • Join JNM on LinkedIn
  • Follow JNM on Twitter
  • Subscribe to our RSS feeds
Research ArticleBasic Science Investigation

Hepatic Blood Perfusion Measured by 3-Minute Dynamic 18F-FDG PET in Pigs

Michael Winterdahl, Ole Lajord Munk, Michael Sørensen, Frank Viborg Mortensen and Susanne Keiding
Journal of Nuclear Medicine July 2011, 52 (7) 1119-1124; DOI: https://doi.org/10.2967/jnumed.111.088278
Michael Winterdahl
  • Find this author on Google Scholar
  • Find this author on PubMed
  • Search for this author on this site
Ole Lajord Munk
  • Find this author on Google Scholar
  • Find this author on PubMed
  • Search for this author on this site
Michael Sørensen
  • Find this author on Google Scholar
  • Find this author on PubMed
  • Search for this author on this site
Frank Viborg Mortensen
  • Find this author on Google Scholar
  • Find this author on PubMed
  • Search for this author on this site
Susanne Keiding
  • Find this author on Google Scholar
  • Find this author on PubMed
  • Search for this author on this site
  • Article
  • Figures & Data
  • Info & Metrics
  • PDF
Loading

Abstract

There is an unmet clinical need for an imaging method for quantification of hepatic blood perfusion. The purpose of the present study was to develop and validate a PET method using blood-to-cell clearance (K1) of 18F-FDG, 3-O-11C-methylglucose (11C-MG), or 2-18F-fluoro-2-deoxy-D-galactose (18F-FDGal) as a measure of hepatic blood perfusion without the need for portal venous blood samples. We aimed to make the method as simple as possible with the prospect of future application to clinical studies. For this purpose, we examined the possibility of using a 3-min data acquisition and a model-derived dual input calculated from measurements of radioactivity concentrations in a peripheral artery. Methods: Pigs (40 kg) underwent dynamic PET of the liver with 18F-FDG, 11C-MG, or 18F-FDGal with simultaneous measurements of time–activity curves in blood sampled from a femoral artery and the portal vein (PV); blood flow rates were measured in the hepatic artery (HA) and PV by transit-time flow meters. Two input functions were compared: A measured dual input and a model-derived dual input, the latter with the PV time–activity curve estimated from the measured arterial time–activity curve and a previously validated 1-parametric PV model. K1 was estimated for each tracer by fitting compartmental models to the data, comparing 3-min and 60-min data acquisitions and the 2 dual-input time–activity curves. Results: Agreement between K1 estimated using the measured and the model-derived dual input was good for all 3 tracers. For 18F-FDG and 11C-MG, K1 (3-min data acquisition, model-derived dual input, and 1-tissue compartmental model) correlated to the measured blood perfusion (P = 0.01 and P = 0.07, respectively). For 18F-FDGal, the correlation was not significant. Conclusion: A simplified method for quantification of hepatic blood perfusion using 3-min dynamic 18F-FDG PET or 11C-MG PET with blood sampling from only a peripheral artery was developed. Parametric K1 images were constructed and showed homogeneous blood perfusion in these normal livers.

  • PET kinetics
  • molecular imaging
  • pharmacokinetics
  • liver PET
  • liver hemodynamics

Total hepatic blood flow can be measured in terms of volume per time unit (e.g., mL of blood/min) by various methods such as the use of an infusion of indocyanine green (1) or direct flow-meter measurements (2). Studies have shown that hepatic blood flow tends to be increased in patients with liver cirrhosis (3), but it is not known to what extent the large heterogeneity in liver tissue histopathology (4,5) and intrahepatic portal vein (PV) pressure (6) may be reflected in intrahepatic variations in liver tissue blood perfusion (mL of blood/mL of liver tissue/min). This is relevant for understanding liver pathophysiology and when planning local treatment of patients with liver diseases, inclusive of liver cancer. Compared with other organs, the liver presents challenges in the in vivo measurements of blood perfusion, because the major proportion of its blood supply comes from the PV, which is inaccessible to blood sampling in humans, and only a minor part comes from the hepatic artery (HA). A simplified method for quantification of regional variations in the hepatic blood perfusion is thus needed. PET is an attractive technique for this purpose because it can provide high-resolution 3-dimensional images of kinetic parameters and we can build on experience from previous studies of the dual input of tracer to the liver (7–13).

We and others previously found that PET estimates of hepatic blood-to-cell clearance (K1) of 18F-FDG (7,8), 3-O-11C-methylglucose (11C-MG) (7), and 2-18F-fluoro-2-deoxy-D-galactose (18F-FDGal) (9) are comparable to the hepatic blood perfusion measured simultaneously by surgically placed ultrasound transit-time flow meters in pigs. Because the estimation of K1 is determined by the initial time–activity curves in tissue and input (7), blood sampling from an artery and the PV is required to calculate the correct dual-input time–activity curve to the liver. Because the PV is inaccessible to blood sampling in humans, various approaches have been attempted to overcome this problem. Using dynamic H215O PET (10) and 18F-FDG PET (11), Kudomi et al. developed a noninvasive method to extract tissue-derived hepatic input functions in pigs. The authors modeled the arterial input function by assuming a rectangular tracer administration and a 3-compartmental whole-body model. The PV input function was described by a 1-tissue compartmental model, and hepatic tracer kinetics were analyzed by compartmental models. The combined set of models was fitted to multiple liver tissue time–activity curves using several constrained and fixed parameters. The estimated input functions were shown to compare well with measured dual-input time–activity curves of H215O and 18F-FDG from Kudomi et al. (10,11).

The purpose of the present study was to develop a simplified method using a model-derived dual-input time–activity curve calculated from an arterial time–activity curve with only 2 fixed parameters, namely β (min), which reflects the tracer-specific mean splanchnic transit time (12), and the mean hepatic arterial flow fraction (13). We previously validated replacement of the measured dual-input function with the model-derived dual input using simulated tissue time–activity curves (13). In the present study, we estimated the K1 of 18F-FDG, 11C-MG, and 18F-FDGal from the liver PET data of anesthetized pigs (time–activity curves) using measured and model-derived dual input. We compared the K1 estimates with direct measurements of hepatic blood perfusion and evaluated the use of a 3-min data acquisition instead of the traditional 60-min data acquisition because K1 is determined by the initial data.

MATERIALS AND METHODS

The material comprised raw data from previous PET studies of 6 pigs that underwent both 11C-MG and 18F-FDG PET (7) and 9 pigs that underwent 18F-FDGal PET (9). Data included dynamic PET recordings of the liver and measurements of tracer concentrations in blood samples collected manually from a femoral artery and the PV. The blood flow rates in the HA and PV were continuously recorded by surgically placed ultrasound transit-time flow meters. In Munk et al. (7), 11C-MG PET was performed before 18F-FDG PET because of the radioactive half-lives of the 2 tracers. All studies were performed using an ECAT EXACT HR-47 PET camera (CTI; Siemens Medical Systems, Inc.).

Liver tissue blood perfusion (Q; mL of blood/mL of liver tissue/min) was calculated as the sum of the average flow meter–measured HA and PV blood flow rates during the initial 3 min after tracer administration (mL of blood/min) divided by the wet liver weight (g) corrected for liver tissue density (1.07 g/mL of tissue).

Kinetic Analysis

PET emission data were reconstructed using filtered backprojection, resulting in images with 128 × 128 × 47 voxels of 2.4 × 2.4 × 3.1 mm and a central spatial resolution of 6.7 mm in full width at half maximum. The dynamic recording included 35 time frames: 18 × 10 s, 4 × 30 s, 5 × 1 min, 6 × 5 min, and 2 × 10 min (total, 60 min). A volume of interest (VOI) (107–143 mL) was drawn in the liver, keeping a distance of 1.5–2 cm from the edge of the liver and avoiding the central area where the large vessels are present, and was used to generate a liver tissue time–activity curve (Cliver(t)), corrected for radioactive decay back to start of the PET recording.

The measured dual-input time–activity curve, Cdual(t), was calculated as the flow-weighted mean of the time–activity curves measured in arterial blood, CA(t), and in PV blood, CPV(t), corrected for radioactive decay back to start of the PET recording, and the measured blood flow rates in the HA, FHA, and in the PV, FPV (7):Cdual(t)=fHACA(t)+(1−fHA)CPV(t);fHA=FHA/(FHA+FPV).Eq. 1

Because the blood sampling sites were close to the liver, no time delay was needed. The model-derived PV time–activity curve (C˜PV(t)) was calculated from the arterial time–activity curve (CA(t)) by applying a PV model for the transfer of tracer from the arterial system to the PV (12) and using population means of a tracer-specific parameter for the transfer, β−, being 0.50 min for 18F-FDG, 0.57 min for 11C-MG, and 0.82 min for 18F-FDGal (13):C˜PV(t)=∫0th(t−τ)CA(τ)dτ;h(t)=β−/(t+β−)2.Eq. 2

Using C˜PV(t) and a mean HA blood flow fraction fHA− of 0.25 (13), a model-derived dual-input time–activity curve (C˜dual(t)) was calculated as (13):C˜dual(t)=fHA−CA(t)+(1−fHA−)C˜PV(t).Eq. 3

The kinetic analysis was performed as VOI-based kinetic analysis followed by construction of parametric images of K1 of 18F-FDG and 11C-MG. The VOI-based data analysis focused on the estimation of K1 and its correlation with Q, measured by the flow meters, that is, verifying that K1 can be used as a measure of Q. For 18F-FDG and 18F-FDGal, we used a 2-tissue compartmental model of tracer distribution and metabolism for the 60-min data acquisition with the parameters K1 (mL of blood/mL of liver tissue/min), a rate constant for back-flux of tracer from cell to blood (k2; /min), a rate constant for intracellular phosphorylation of the tracer (k3; /min), a rate constant for intracellular dephosphorylation (k4; /min), and a vascular distribution volume (V0; mL of blood/mL of liver tissue). Because 11C-MG is not metabolized in the liver (14), we used a 1-tissue compartmental model of tracer distribution for the 60-min data acquisition for this tracer with the parameters K1, k2, and V0. Next, a 1-tissue compartmental model with the parameters K1, k2, and V0 was fitted to all 3 tracers using data from the initial 3 min of the PET recordings. The kinetic parameters were estimated by nonlinear fitting of the respective model to the VOI-based liver tissue time–activity curve (Cliver(t)) with Cdual(t) and C˜dual(t).

For the construction of parametric images of hepatic blood perfusion in terms of K1 for 18F-FDG and 11C-MG, noise was reduced by applying an additional gaussian filter (8 mm in full width at half maximum) to the images, thereby reducing the central spatial resolution to 10.5 mm in full width at half maximum, corresponding to a volumetric resolution of around 1 mL. The image of K1 was generated by fitting a linearized 1-tissue compartmental model (15) with the parameters K1, k2, and V0 (16) to the initial 3 min of the 18F-FDG and 11C-MG PET recordings using C˜dual(t) as input. V0 was fixed to 0.40 mL of blood/mL of liver tissue (Michael Winterdahl, unpublished observations, 2010, similar to values reported by Iozzo et al. (8)).

Statistical Analysis

Data are expressed in terms of the mean ± SEM. Differences between K1 values estimated using C˜dual(t) or Cdual(t) were tested by a paired 2-sample t test; differences with a P value of less than 0.05 were considered statistically significant. Correlation between K1 and Q was tested by the Pearson product-moment correlation coefficient, r, with a P value of less than 0.05 considered to indicate a statistically significant correlation. Mean relative deviations of K1 from Q, that is, (K1−Q)/Q, were tested by a 1-sample t test; deviations with a P value of less than 0.05 were considered statistically significant. The mean relative deviation was interpreted as the accuracy of the PET method, and the SEM of the deviation was interpreted as the precision. Differences in variables between animals versus within animals were assessed by ANOVA.

RESULTS

The agreement between K1 estimated using C˜dual(t) or Cdual(t) was good for all combinations of models, tracers, and data acquisition periods using the VOI-based liver tissue time–activity curves (Cliver(t)) (paired t tests, all P > 0.1).

The correlations between K1 for 18F-FDG and Q and between K1 for 11C-MG and Q were not statistically significant when the 60-min analyses and Cdual(t) were used (Table 1). The correlation coefficient for the 60-min 18F-FDG acquisition was similar to a correlation coefficient of 0.57 (P = 0.03) found by Iozzo et al. using a 180-min acquisition (8). The use of a 3-min acquisition, a 1-tissue compartmental model, and Cdual(t) resulted in a better correlation for both tracers; this was further improved by the use of C˜dual(t), and the correlation was statistically significant for 18F-FDG using C˜dual(t) (Table 1). The mean relative deviation of K1 from Q for both 18F-FDG and 11C-MG, that is, (K1−Q)/Q, was positive in all cases but not statistically significantly different from zero except for 11C-MG using a 3-min acquisition and Cdual(t) (Table 1). Figure 1 shows the significant correlations between Q and K1 for 18F-FDG and between Q and K1 for 11C-MG (3-min, 1-tissue compartmental model, C˜dual(t)). The tendency for K1 to overestimate Q for both tracers (Fig. 1) was not statistically significant, in agreement with the accuracy estimates (Table 1).

View this table:
  • View inline
  • View popup
TABLE 1

Blood-to-Cell Clearance of 18F-FDG and 11C-MG as Measure of Hepatic Blood Perfusion in Pigs

FIGURE 1.
  • Download figure
  • Open in new tab
  • Download powerpoint
FIGURE 1.

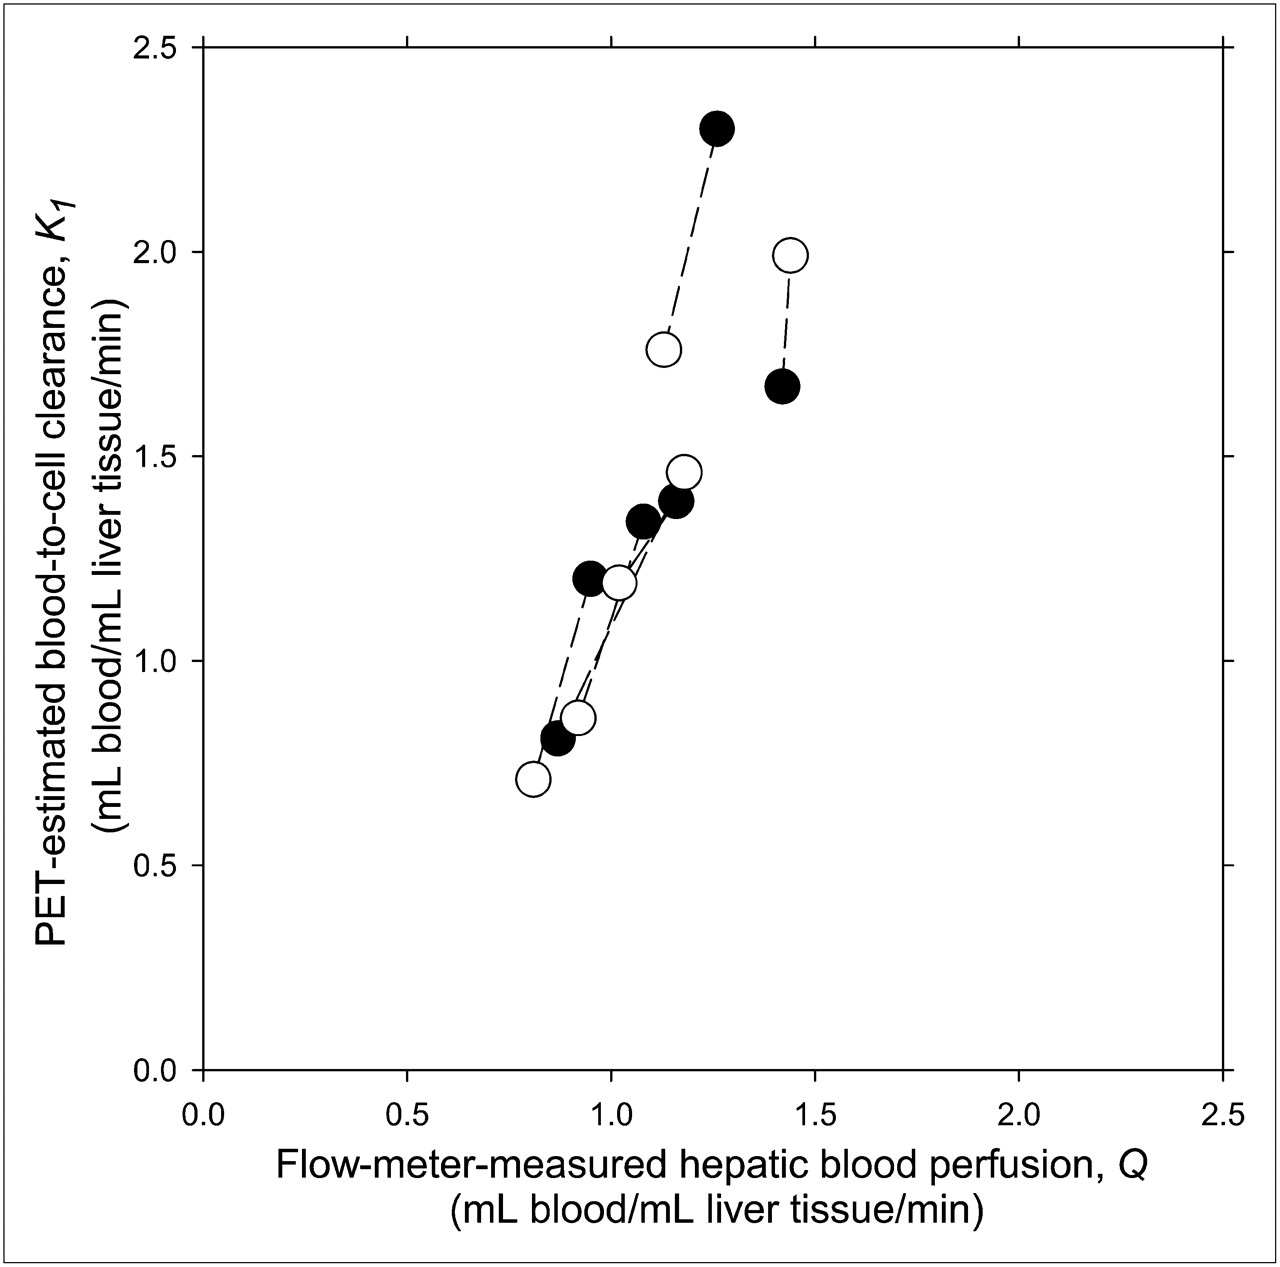
Relationship between VOI-based blood-to-cell clearance for 18F-FDG (•) and 11C-MG (○) and hepatic blood perfusion measured simultaneously by ultrasound transit-time flow meters in six 40-kg pigs. Embedded Imagewas estimated from dynamic PET of liver using model-derived dual input, Embedded Image, 3-min data acquisition, and 1-tissue compartmental model. Measurements from same animal are connected by straight line.

For 18F-FDGal, there was little or no correlation between K1 and Q for any of the analyses, and we did not proceed with examining the use of 18F-FDGal as a flow tracer.

For both 18F-FDG and 11C-MG, the model fit underestimated the initial rise of Cliver(t) when the compartmental 60-min models were used but not when the 3-min models were used. In agreement with this finding, the estimates of K1 for 18F-FDG were on average 5% higher (range, –3% to +23%) for the 3-min acquisition than for the 60-min acquisition for both Cdual(t) and C˜dual(t), and for 11C-MG, K1 was on average 20% higher (range, +11% to +29%) for the 3-min acquisition than for the 60-min acquisition for both Cdual(t) and C˜dual(t).

For the 6 animals that underwent both 18F-FDG and 11C-MG PET, 2.4% of the variance in the relative deviation of K1 from Q was due to variation within individual animals; 72% of the variance was due to interindividual variations. This high reproducibility of the K1 estimates allowed us to regard the 18F-FDG and 11C-MG studies as double determinations within the same animal. In 3 animals, normal physiologic variations in hepatic blood perfusion gave Q values that were higher during the 11C-MG PET acquisition than during the 18F-FDG PET acquisition, and the opposite was true in the other 3 animals. The correlation between changes in Q and changes in K1was highly significant (r = 0.924; P = 0.008). K1 was accordingly able to detect the direction of the changes in perfusion within each animal (Fig. 1). These results are noticeable because changes in Q were only 1%–36%.

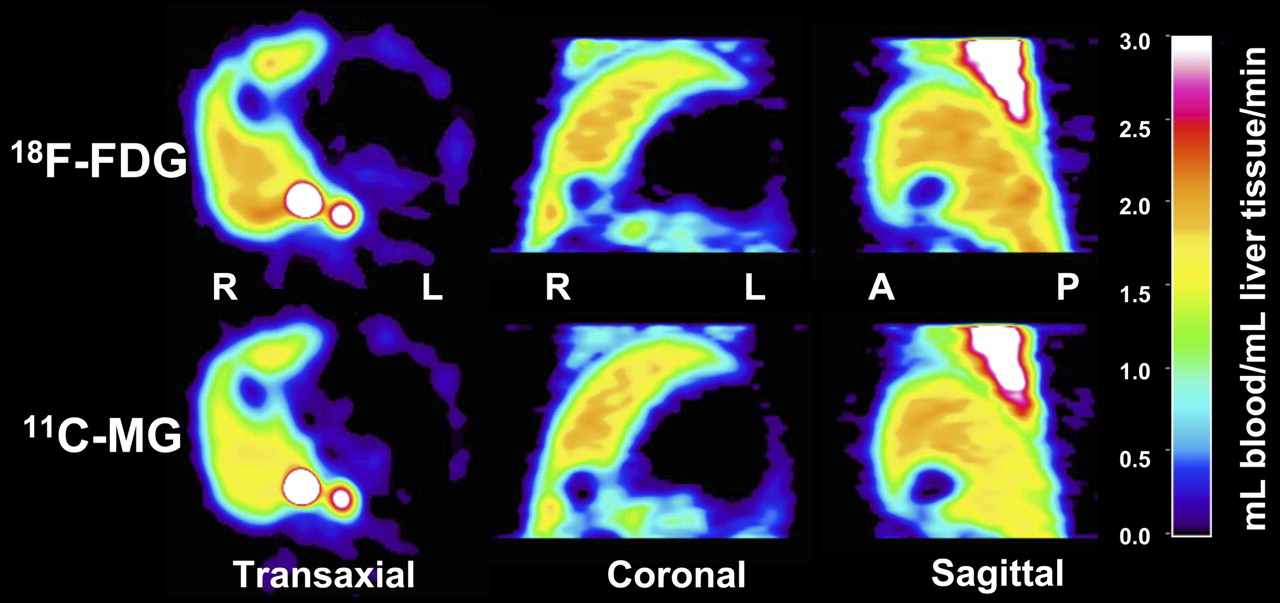
Examples of parametric images of K1 for 18F-FDG and 11C-MG are shown in Figure 2. As the dual input applies only to the liver, the estimates of K1 are valid only for the liver, not for other organs or structures seen in the image. The figure illustrates that the 2 tracers gave similar images of liver tissue blood perfusion and that blood perfusion in the normal pig liver is homogeneous. The coefficient of variation of the mean perfusion estimate was 13% for 18F-FDG and 14% for 11C-MG.

FIGURE 2.
  • Download figure
  • Open in new tab
  • Download powerpoint
FIGURE 2.

In 40-kg pig, hepatic blood perfusion estimated as blood-to-cell clearances, Embedded Image of 18F-FDG and 11C-MG from dynamic PET using model-derived dual input, Embedded Image, calculated from arterial time–activity curve, 3-min data acquisition, and linearized 1-tissue compartmental model. A = anterior; P = posterior.

DISCUSSION

The main results of the present pig study are that for both 18F-FDG and 11C-MG, the measured dual-input time–activity curve could successfully be replaced by the model-derived input time–activity curve, based on a measured arterial time–activity curve. For both tracers, the use of a 3-min data acquisition gave K1 values that correlated better with the measured blood perfusion than the use of 60-min acquisitions.

The physiologic basis for using K1 as an estimate of hepatic blood perfusion is founded on a fast blood-to-cell transfer of glucose, 18F-FDG, and 11C-MG. In contrast to capillaries in other organs, the liver sinusoids are lined by highly fenestrated endothelial cells. Therefore, most blood-borne substances come into close contact with the hepatocyte plasma membrane, which has a huge surface area and contains facilitative glucose transporters (17,18) yielding a large permeability–surface area product (18,19). A reason for the poor correlation between K1 for 18F-FDGal and Q despite equally high permeability for 18F-FDGal (9) could be that the rate constant for hepatocellular metabolism of 18F-FDGal, k3 (9), is much higher than that for the metabolism of 18F-FDG, and this difference may influence the estimation of K1. However, the present data do not allow us to draw any conclusions on this possibility.

In all fitting procedures, we used a uniform weighting according to Yaqub et al. (20), and this choice could explain the tendency toward underestimation of the initial rise of the fitted liver time–activity curve for 18F-FDG and 11C-MG when the 60-min data acquisition was used, compared with the 3-min data acquisition. The accuracy of the K1 estimates is probably more affected by the weighting schemes when data have long acquisition periods than short acquisition periods because the determination of K1 is particularly sensitive to the initial measurements after tracer injection (7). Therefore, for both 18F-FDG and 11C-MG, the use of a 1-tissue compartmental model of distribution and 3-min data acquisitions yielded robust estimations of K1.

It is unlikely that the tendency for K1 to overestimate Q for both 18F-FDG and 11C-MG (3-min, C˜dual(t)) (Fig. 1) is due to underestimation of Q by the flow-meter measurements, because these are highly accurate and precise (21,22). Another explanation is that intrahepatic blood vessels are unavoidably included in the drawing of the VOI and may influence the VOI-based analysis. The combination of dynamic PET with visualization of intrahepatic vessels by contrast-enhanced CT is likely to minimize this problem, but we did not have access to PET/CT at the time of the experiments.

When regarding 18F-FDG and 11C-MG as double determinations in the 6 pigs that underwent PET with both tracers, we found a highly significant correlation between changes in hepatic blood perfusion, Q, and changes in K1 (Fig. 1). In each case, the change in blood perfusion between the 2 PET studies resulted in a corresponding change in the VOI-based K1. Even minor physiologic variations in blood perfusion (1%–36%) were thus detectable by the simplified PET method, indicating potential for the detection of flow changes in small volumes (1 mL) using parametric images, as could be important in, for example, early tumor detection.

Compared with the VOI-based analysis, the parametric images tended to give too-high estimates of K1. Nevertheless, the parametric images yielded information about regional variations in hepatic blood perfusion and are thus a useful supplement to the VOI-based analysis. In general, parametric images are often noisy and biased as a result of large statistical uncertainties in the kinetic parameters of individual voxels. In the present study, we reduced noise in the K1 images by applying a filter that reduced the spatial resolution. Future applications may improve the statistical properties by using direct parametric image reconstruction techniques that allow for the kinetic model to be applied as part of the image reconstruction, including an appropriate weighting scheme (23).

A crucial point for the transfer of this simplified PET method to humans is estimation of the model-derived dual-input time–activity curve, C˜dual(t), from the measured arterial time–activity curve. This process includes estimation of the model-derived PV time–activity curve, C˜PV(t), based on a population mean tracer-specific parameter β−, which reflects the tracer-specific mean splanchnic transit time (12), and a mean HA blood flow fraction of 0.25 (13). In terms of mean HA flow fraction and mean transit time for the PET tracer 15O-carbon monoxide through the splanchnic circulation, human splanchnic circulation (2) is similar to that in pigs (13). We previously showed that the estimation of K1 for 18F-FDG and 11C-MG is insensitive to minor variations in β− and HA blood flow fraction and that it is therefore likely the method can quite readily be transferred to humans despite minor differences in the 2 key parameters (13). This finding is important for potential clinical use of the method in patients whose liver structure is altered by cirrhosis, cancer, steatosis, or other disease, as it indicates that only in cases with profoundly changed model parameters (e.g., end-stage cirrhosis) might the use of population means not be valid. This possibility needs to be quantified and validated in detail in future prospective clinical studies.

An interesting clinical perspective on the present simplified method is that an 18F-FDG bolus injection can be used to combine measurements of hepatic blood perfusion (in terms of K1 from the initial 3-min data) using C˜dual(t) and studies of quasi–steady-state glucose metabolism if the PET recording is continued for 45–60 min. The combination of parametric images of hepatic blood perfusion and metabolism of 18F-FDG using a single arterial input (24,25) allows for simultaneous assessment of regional variations in liver blood perfusion and glucose metabolism. This ability may be clinically useful for early distinction between residual tumor tissue and changes in parenchymal perfusion and metabolism after local treatment of tumors, such as in radiofrequency ablation of colorectal liver metastases. For 11C-MG, the radioactive half-life of 20 min enables repeated measurements—for example, before and after administration of a drug that affects regional hepatic hemodynamics.

Liver tumors are characterized by a predominantly arterial blood perfusion, namely increased fHA. If, nevertheless, 18F-FDG PET data are analyzed for the whole liver using the dual-input time–activity curve, the use of this incorrect and less dynamic input to the tumor will give rise to an artificially high K1 in the tumor, as compared with the correctly estimated blood perfusion in the surrounding nonmalignant tissue. The tumor-to-background ratio for a parametric image of K1 will be enhanced. Validation in prospective studies is needed once the present method has been transferred to humans.

CONCLUSION

We have developed and validated a simplified method to quantify and image blood perfusion in normal pig livers using a 3-min dynamic PET acquisition after intravenous injection of 11C-MG or 18F-FDG, the latter being a commonly available PET tracer. The method does not require sampling of PV blood or measurements of blood flow in the HA or PV; it requires measurements only of the arterial time–activity curve and calculation of the model-derived dual input. Despite the simplicity of the method, estimated hepatic blood perfusion correlated strongly with independently measured hepatic blood perfusion. The parametric images that were constructed allowed for the assessment of regional variations in hepatic blood perfusion, which was homogeneous in normal pig livers. The similarity between the splanchnic circulation in humans and pigs indicates promise for transfer to humans, and moreover, the 3-min perfusion measurement can become an integrated part of a routine clinical 18F-FDG PET/CT examination without additional tracer administration and radiation burden to the patient.

DISCLOSURE STATEMENT

The costs of publication of this article were defrayed in part by the payment of page charges. Therefore, and solely to indicate this fact, this article is hereby marked “advertisement” in accordance with 18 USC section 1734.

Acknowledgments

The study was supported by the National Institutes of Health (R01-DK074419), the Danish Medical Research Council (09-073658), the Novo Nordic Foundation (A10313), Aase and Ejnar Danielsen's Foundation (106309), the A.P. Møller Foundation for the Advancement of Medical Science (070118), and Helga and Peter Korning's Foundation. No other potential conflict of interest relevant to this article was reported.

  • © 2011 by Society of Nuclear Medicine

REFERENCES

  1. 1.↵
    1. Skak C,
    2. Keiding S
    . Methodological problems in the use of indocyanine green to estimate hepatic blood flow and ICG clearance in man. Liver. 1987;7:155–162.
    OpenUrlPubMed
  2. 2.↵
    1. Doi R,
    2. Inoue K,
    3. Kogire M,
    4. et al
    . Simultaneous measurements of hepatic arterial and portal venous flows by transit time ultrasound volume flowmetry. Surg Gynecol Obstet. 1988;167:65–69.
    OpenUrlPubMed
  3. 3.↵
    1. Rodríguez-Vilarrupla A,
    2. Fernández M,
    3. Bosch J,
    4. García-Pagán JC
    . Current concepts on the pathophysiology of portal hypertension. Ann Hepatol. 2007;6:28–36.
    OpenUrlPubMed
  4. 4.↵
    1. Maharaj B,
    2. Maharaj RJ,
    3. Leary WP,
    4. et al
    . Sampling variability and its influence on the diagnostic yield of percutaneous needle biopsy of the liver. Lancet. 1986;I(8480):523–525.
    OpenUrl
  5. 5.↵
    1. Hølund B,
    2. Poulsen H,
    3. Schlichting P
    . Reproducibility of liver biopsy diagnosis in relation to the size of the specimen. Scand J Gastroenterol. 1980;15:329–335.
    OpenUrlPubMed
  6. 6.↵
    1. Keiding S,
    2. Vilstrup H
    . Intrahepatic heterogeneity of hepatic venous pressure gradient in human cirrhosis. Scand J Gastroenterol. 2002;37:960–964.
    OpenUrlCrossRefPubMed
  7. 7.↵
    1. Munk OL,
    2. Bass L,
    3. Roelsgaard K,
    4. Bender D,
    5. Hansen SB,
    6. Keiding S
    . Liver kinetics of glucose analogs measured in pigs by PET: importance of dual-input blood sampling. J Nucl Med. 2001;42:795–801.
    OpenUrlAbstract/FREE Full Text
  8. 8.↵
    1. Iozzo P,
    2. Jarvisalo MJ,
    3. Kiss J,
    4. et al
    . Quantification of liver glucose metabolism by positron emission tomography: validation study in pigs. Gastroenterology. 2007;132:531–542.
    OpenUrlCrossRefPubMed
  9. 9.↵
    1. Sørensen M,
    2. Munk OL,
    3. Mortensen FV,
    4. et al
    . Hepatic uptake and metabolism of galactose can be quantified in vivo by 2-[18F]fluoro-2-deoxy-galactose positron emission tomography. Am J Physiol Gastrointest Liver Physiol. 2008;295:G27–G36.
    OpenUrlAbstract/FREE Full Text
  10. 10.↵
    1. Kudomi N,
    2. Slimani L,
    3. Järvisalo MJ,
    4. et al
    . Non-invasive estimation of hepatic blood perfusion from H215O PET images using tissue-derived arterial and portal input functions. Eur J Nucl Med Mol Imaging. 2008;35:1899–1911.
    OpenUrlCrossRefPubMed
  11. 11.↵
    1. Kudomi N,
    2. Järvisalo MJ,
    3. Kiss J,
    4. et al
    . Non-invasive estimation of hepatic glucose uptake from [18F]FDG PET images using tissue-derived input functions. Eur J Nucl Med Mol Imaging. 2009;36:2014–2026.
    OpenUrlCrossRefPubMed
  12. 12.↵
    1. Munk OL,
    2. Keiding S,
    3. Bass L
    . Impulse-response function of splanchnic circulation with model-independent constraints: theory and experimental validation. Am J Physiol Gastrointest Liver Physiol. 2003;285:G671–G680.
    OpenUrlAbstract/FREE Full Text
  13. 13.↵
    1. Winterdahl M,
    2. Keiding S,
    3. Sørensen M,
    4. et al
    . Tracer input for kinetic modelling of liver physiology determined without sampling portal venous blood in pigs. Eur J Nucl Med Mol Imaging. 2010;38:263–270.
    OpenUrlPubMed
  14. 14.↵
    1. Bender D,
    2. Munk OL,
    3. Feng H,
    4. Keiding S
    . Metabolites of 18F-FDG and 3-O-11C-methylglucose in pig liver. J Nucl Med. 2001;42:1673–1678.
    OpenUrlAbstract/FREE Full Text
  15. 15.↵
    1. Lawson CL,
    2. Hanson RJ
    . Solving Least Squares Problems. Upper Saddle River, NJ: Prentice-Hall; 1974.
  16. 16.↵
    1. Blomqvist G
    . On the construction of functional maps in positron emission tomography. J Cereb Blood Flow Metab. 1984;4:629–632.
    OpenUrlPubMed
  17. 17.↵
    1. Thorens B
    . Glucose transporters in the regulation of intestinal, renal, and liver glucose fluxes. Am J Physiol. 1996;270:G541–G553.
    OpenUrlPubMed
  18. 18.↵
    1. Goresky CA,
    2. Nadeau BE
    . Uptake of materials by the intact liver: the exchange of glucose across the cell membrane. J Clin Invest. 1974;53:634–646.
    OpenUrlPubMed
  19. 19.↵
    1. Rodes J,
    2. Benhamou J-P,
    3. Dufour JF,
    4. Blei A,
    5. Reichen J,
    6. Rizzetto M
    1. Keiding S,
    2. Sørensen M
    . Hepatic removal kinetics: importance for quantitative measurements of liver function. In: Rodes J, Benhamou J-P, Dufour JF, Blei A, Reichen J, Rizzetto M, eds. Textbook of Hepatology: From Basic Science to Clinical Practice. 3rd ed. Oxford, U.K.: Blackwell; 2007:468–478.
  20. 20.↵
    1. Yaqub M,
    2. Boellaard R,
    3. Kropholler MA,
    4. Lammertsma AA
    . Optimization algorithms and weighting factors for analysis of dynamic PET studies. Phys Med Biol. 2006;51:4217–4232.
    OpenUrlCrossRefPubMed
  21. 21.↵
    1. Laustsen J,
    2. Pedersen EM,
    3. Terp K,
    4. et al
    . Validation of a new transit time ultrasound flow-meter in man. Eur J Vasc Endovasc Surg. 1996;12:91–96.
    OpenUrlCrossRefPubMed
  22. 22.↵
    1. Mortensen FV,
    2. Rasmussen JS,
    3. Viborg O,
    4. Laurberg S,
    5. Pedersen EM
    . Validation of a new transit time ultrasound flow-meter for measuring blood flow in colonic mesenteric arteries. Eur J Surg. 1998;164:599–604.
    OpenUrlPubMed
  23. 23.↵
    1. Wang G,
    2. Qi J
    . Generalized algorithms for direct reconstruction of parametric images from dynamic PET data. IEEE Trans Med Imaging. 2009;28:1717–1725.
    OpenUrlCrossRefPubMed
  24. 24.↵
    1. Messa C,
    2. Choi Y,
    3. Hoh CK,
    4. et al
    . Quantification of glucose utilization in liver metastases: parametric imaging of 18F-FDG uptake with PET. J Comput Assist Tomogr. 1992;16:684–689.
    OpenUrlPubMed
  25. 25.↵
    1. Slimani L,
    2. Kudomi N,
    3. Oikonen V,
    4. et al
    . Quantification of liver perfusion with [15O]H2O-PET and its relationship with glucose metabolism and substrate levels. J Hepatol. 2008;48:974–982.
    OpenUrlCrossRefPubMed
  • Received for publication January 20, 2011.
  • Accepted for publication March 24, 2011.
PreviousNext
Back to top

In this issue

Journal of Nuclear Medicine: 52 (7)
Journal of Nuclear Medicine
Vol. 52, Issue 7
July 1, 2011
  • Table of Contents
  • Table of Contents (PDF)
  • About the Cover
  • Index by author
Print
Download PDF
Article Alerts
Sign In to Email Alerts with your Email Address
Email Article

Thank you for your interest in spreading the word on Journal of Nuclear Medicine.

NOTE: We only request your email address so that the person you are recommending the page to knows that you wanted them to see it, and that it is not junk mail. We do not capture any email address.

Enter multiple addresses on separate lines or separate them with commas.
Hepatic Blood Perfusion Measured by 3-Minute Dynamic 18F-FDG PET in Pigs
(Your Name) has sent you a message from Journal of Nuclear Medicine
(Your Name) thought you would like to see the Journal of Nuclear Medicine web site.
Citation Tools
Hepatic Blood Perfusion Measured by 3-Minute Dynamic 18F-FDG PET in Pigs
Michael Winterdahl, Ole Lajord Munk, Michael Sørensen, Frank Viborg Mortensen, Susanne Keiding
Journal of Nuclear Medicine Jul 2011, 52 (7) 1119-1124; DOI: 10.2967/jnumed.111.088278

Citation Manager Formats

  • BibTeX
  • Bookends
  • EasyBib
  • EndNote (tagged)
  • EndNote 8 (xml)
  • Medlars
  • Mendeley
  • Papers
  • RefWorks Tagged
  • Ref Manager
  • RIS
  • Zotero
Share
Hepatic Blood Perfusion Measured by 3-Minute Dynamic 18F-FDG PET in Pigs
Michael Winterdahl, Ole Lajord Munk, Michael Sørensen, Frank Viborg Mortensen, Susanne Keiding
Journal of Nuclear Medicine Jul 2011, 52 (7) 1119-1124; DOI: 10.2967/jnumed.111.088278
Twitter logo Facebook logo LinkedIn logo Mendeley logo
  • Tweet Widget
  • Facebook Like
  • Google Plus One
Bookmark this article

Jump to section

  • Article
    • Abstract
    • MATERIALS AND METHODS
    • RESULTS
    • DISCUSSION
    • CONCLUSION
    • DISCLOSURE STATEMENT
    • Acknowledgments
    • REFERENCES
  • Figures & Data
  • Info & Metrics
  • PDF

Related Articles

  • This Month in JNM
  • PubMed
  • Google Scholar

Cited By...

  • Quantitative Total-Body Imaging of Blood Flow with High-Temporal-Resolution Early Dynamic 18F-FDG PET Kinetic Modeling
  • Quantitative Total-Body Imaging of Blood Flow with High Temporal Resolution Early Dynamic 18F-Fluorodeoxyglucose PET Kinetic Modeling
  • Total-Body PET Multiparametric Imaging of Cancer Using a Voxelwise Strategy of Compartmental Modeling
  • Dynamic PET of Human Liver Inflammation: Impact of Kinetic Modeling with Optimization-Derived Dual-Blood Input Function
  • Hepatobiliary Secretion Kinetics of Conjugated Bile Acids Measured in Pigs by 11C-Cholylsarcosine PET
  • Bringing Physiology into PET of the Liver
  • Hepatic Galactose Metabolism Quantified in Humans Using 2-18F-Fluoro-2-Deoxy-D-Galactose PET/CT
  • Google Scholar

More in this TOC Section

  • Designed Ankyrin Repeat Protein–Mediated Peptide Nucleic Acid–Based Pretargeting: A Proof-of-Principle Study
  • [11C]ZTP-1: An Effective Short-Lived Radioligand for PET of Rat and Monkey Brain Phosphodiesterase Type 4 Subtype B
  • Reduced Renal Uptake of Various Radiopharmaceuticals with Sodium Paraaminohippurate Coadministration in a Rat Model
Show more Basic Science Investigation

Similar Articles

SNMMI

© 2025 SNMMI

Powered by HighWire