


Abstract
Hypoxia is a characteristic feature of malignant tumors that should be evaluated before the start of therapy. 18F-labeled fluoroerythronitroimidazole (FETNIM) is a possible candidate for imaging tumor hypoxia with PET. Quantitative analysis of [18F]FETNIM uptake in vivo is necessary before proceeding to assays predicting hypoxia. Methods: Eight patients with untreated head and neck squamous cell carcinoma were enrolled in the study. All patients underwent dynamic PET imaging with [18F]FETNIM, coupled with measurements of blood flow with [15O]H2O and blood volume with [15O]CO. The metabolically active tumor volume was determined from [18F]FDG PET performed on a separate day. [18F]FETNIM uptake in the tumor was correlated with that in neck muscles and arterial plasma and compared with the findings of other PET studies. Results: Blood flow in tumor was 5- to 30-fold greater than in muscle, in contrast to blood volume, which did not significantly differ in the 2 tissues. With [18F]FETNIM PET, muscle activity remained invariably less than plasma activity, whereas activity in whole tumors was always greater than that in muscle. In 4 instances, the maximum tumor uptake of [18F]FETNIM was 1.2–2.0 times higher than plasma activity in the late dynamic phase. A kinetic model developed for calculation of distribution volume of reversibly trapping tracers was successfully applied in the [18F]FETNIM studies. Tumor distribution volume correlated strongly with the standardized uptake value of [18F]FETNIM between 60 and 120 min and with blood flow but not with the standardized uptake value of [18F]FDG. The relationship between [18F]FETNIM uptake and the blood flow of the tumor was less obvious on a pixel-by-pixel level. Conclusion: Uptake of [18F]FETNIM in head and neck cancer is highly variable and seems to be governed by blood flow at least in the early phase of tissue accumulation. Maximum tumor-to-muscle tracer uptake ratios > 180 min were in the range of 1–4, comparing favorably with those reported previously for [18F]fluoromisonidazole. Assessment of the distribution volume of [18F]FETNIM after the initial blood-flow phase is feasible for subsequent evaluation of hypoxia-specific retention.
It has been well established both in experimental and in clinical studies that most tumors—unlike healthy tissues—have a considerable proportion of hypoxic cells that can be resistant to both radiotherapy and chemotherapy (1). Hypoxia induces angiogenesis and adds to the invasive and metastatic potential of neoplastic cells (2). There have been attempts to overcome hypoxic radioresistance with blood transfusions, hyperbaric oxygen, vasoactive agents, and various radiosensitizers, but none of these procedures currently has an established role in the clinical treatment of cancer patients (3). However, a recent metaanalysis of 10,602 patients in 83 randomized trials showed that modification of tumor hypoxia significantly improved the outcome of radiotherapy in head and neck, cervical, and bladder cancer (3,4). The challenge is to find those among all cancer patients whose failure in treatment is primarily caused by the hypoxia of the tumor cells.
None of the methods to measure the hypoxic fraction in human tumors is currently used routinely (5). Recent reviews (5,6) have presented histomorphometric methods, a polarographic microelectrode technique, cytologic analysis of DNA strand breaks, and hypoxia markers that can be detected by external imaging either with magnetic spectroscopy or with radionuclide labeling. Of these, a commercially available microelectrode system (Eppendorf-Netheler-Hinz GmbH, Hamburg, Germany) has been designated as the gold standard. In this system, a thin-needle electrode is inserted into the tumor and gives signals that are proportional to the oxygen partial pressure in the tissue. Disadvantages include difficulties in distinguishing between measurements made in necrotic and viable regions and poor access to deep-seated tumor sites such as primaries in the esophagus, larynx, and lungs (7).
Recently, great interest has arisen in developing radiolabeled markers of the hypoxic fraction for noninvasive imaging of solid tumors (6). The advantage of PET is the ability to image tumor metabolism quantitatively in any part of the body. For example, the primary tumor and the lymph node metastases can be imaged simultaneously in head and neck cancer and in lung cancer (8,9) with PET and [18F]FDG, a glucose analog commonly used in oncologic PET studies. In vitro experiments show that hypoxia increases uptake of [3H]FDG in cell lines established from patients with melanoma, ovarian carcinoma, and head and neck carcinoma because glucose is the preferred fuel for energy metabolism under low-oxygen concentrations (10,11). The use of [18F]FDG for detection of hypoxia is, however, impeded by many other factors—such as cellular viability and growth—that contribute to [18F]FDG uptake in tumors.
Hypoxic cells can be specifically imaged with PET using radiolabeled nitroimidazole compounds (12–14), of which 18F-labeled fluoromisonidazole ([18F]FMISO) has been introduced in the clinical setting (12,15,16). So far, [18F]FMISO has been used to study patients with head and neck, lung, prostate, and brain tumors. Although clearly having potential as a probe for detection of hypoxia, [18F]FMISO may have a low target-to-background ratio because of the lipophilicity that causes neurotoxicity in its parent drug when used as a radiosensitizer in pharmacologic doses (17). 18F-labeled fluoroerythronitroimidazole (FETNIM), originally developed by Yang et al. (13), was found to be more hydrophilic than [18F]FMISO and is eliminated rapidly from well-oxygenated tissues, resulting in higher tumor-to-liver and tumor-to-blood ratios in rat mammary cancer than are obtained with [18F]FMISO. These original observations prompted us to study the uptake and metabolism of [18F]FETNIM in tumor-bearing mammals (18) and, finally, in cancer patients. Our goal was to study the time course of [18F]FETNIM uptake in relation to blood flow and glucose metabolism in head and neck cancer and to validate a noninvasive approach to the assessment of hypoxic retention of [18F]FETNIM, which appears to show predominantly reversible binding in tumors in the first 2–3 h after injection.
MATERIALS AND METHODS
Patients
Eight patients with newly diagnosed head and neck cancer participated in the study between November 1999 and October 2000. The patients were admitted to the Department of Oncology and Radiotherapy, Turku University Central Hospital (Turku, Finland), for definitive or preoperative radiotherapy, and all PET studies were performed before initiation of the treatment. Patients who were in good or moderate clinical condition (Zubrod classification 0–2 (19)) were eligible to participate. The histologic diagnosis was squamous cell carcinoma in every case. Each patient underwent conventional diagnostic staging, including panendoscopy, contrast-enhanced CT of the primary tumor site and the neck, and chest radiography. The locations of the primary tumor and the clinical stages according to the criteria of the International Union Against Cancer (20) are given in Table 1. The study protocol was approved by the joint ethical committee of Turku University (Turku, Finland) and Turku University Central Hospital, and permission to use [18F]FETNIM in patient studies was granted by the Finnish National Agency for Medicines. All patients gave written informed consent before entering the study.
Patient Characteristics
Radiochemical Synthesis of Tracers
Production of [15O]H2O and [15O]CO.
A low-energy deuteron accelerator, Cyclone 3 (Ion Beam Applications, Louvain-La-Neuve, Belgium), was used for production of 15O-labeled compounds. [15O]H2O for perfusion imaging was synthesized using a dialysis technique in a constantly working water module (21). [15O]CO was processed from 15O-labeled oxygen in a charcoal oven at 950°C. The radioactivity of products was recorded online for each patient examination with a low-voltage ionization chamber (22). Sterility and pyrogen tests were routinely performed to verify the purity of the products.
[18F]FDG.
[18F]FDG was synthesized with a computer-controlled apparatus by a previously described nucleophilic substitution procedure (23). The radiochemical purity of [18F]FDG always exceeded 98%, and the specific radioactivity at the end of radiosynthesis was >40 GBq/μmol.
[18F]FETNIM.
[18F]FETNIM was synthesized from 1-(2′-nitro-1′-imidazolyl)-2,3-O-isopropylidene-4-tosyloxybutane by nucleophilic displacement of the tosyloxy-group with [18F]F−. The method of radiochemical synthesis was a modification of the method of Yang et al. (13) and was reported separately (18). The radiochemical purity of [18F]FETNIM exceeded 95%, and the specific radioactivity exceeded 300 GBq/μmol.
PET Acquisition
PET was performed using an Advance scanner (General Electric Medical Systems, Milwaukee, WI) operated in 2-dimensional mode. The scanner consists of 18 rings of bismuth germanate detectors yielding 35 transverse slices spaced by 4.25 mm. The imaging field of view is 55 cm in diameter and 15.2 cm in axial length (24).
All measurements were corrected for scatter, random counts, and dead time (25). Attenuation correction was performed with 2 rotating rod sources containing 68Ge/68Ge (total, 350 million counts). Image reconstruction for the central 30-cm field of view was performed using a transaxial Hanning filter with a cutoff frequency of 4.6 mm to a 128 × 128 image matrix, which resulted in image pixels of 2.34 × 2.34 mm.
PET Imaging
All PET imaging was performed while the patients were fasting. Before [18F]FETNIM studies, patients were advised to fast at least 4 h, and before [18F]FDG studies, preferably overnight. The plasma glucose level was monitored during the beginning of each study. Seven patients had a normal plasma glucose concentration during both [18F]FDG PET and [18F]FETNIM PET, with a median of 5.3 mmol/L (range, 4.75–6.5 mmol/L). By contrast, 1 patient (patient 3) was found to be hyperglycemic both before the [18F]FDG study (plasma glucose level, 8.8 mmol/L) and before the [18F]FETNIM study (plasma glucose level, 9.8 mmol/L). A line was placed into the antecubital vein for injection of the 18F-labeled tracers and the [15O]H2O. In [18F]FETNIM studies, a catheter was placed in the contralateral radial artery for frequent blood sampling. The tumor was located by inspection; palpation; anatomic landmarks; and, if necessary, CT.
PET studies with [18F]FETNIM and [18F]FDG were performed within 20 d of each other (median, 5 d; range, 1–20 d) in random order during the planning phase of radiation treatment. In [18F]FDG studies, the tracer was injected as a 15-s bolus (median dose, 368 MBq; dose range, 355–379 MBq). A static emission scan consisting of three 5-min frames was acquired 45–60 min after injection and was followed by a 10-min transmission scan. [18F]FETNIM studies were performed sequentially with blood-flow and blood-volume measurements, which were obtained using [15O]H2O and [15O]CO, respectively. Laser-guided landmarks and felt pen markings were used, if feasible, so that the positioning of the patient for the second PET study could be the same as for the first.
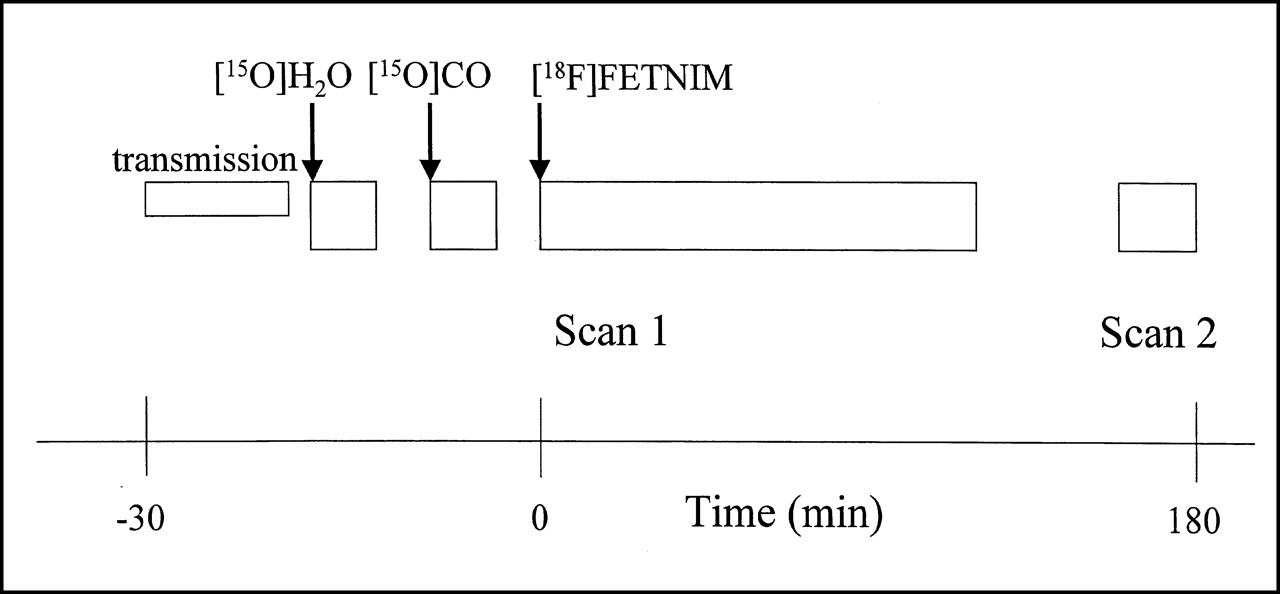
The sequence of PET acquisition for [18F]FETNIM and blood-flow and blood-volume studies is shown in Figure 1. The study started with a 10-min transmission scan. Thereafter, perfusion was measured with [15O]H2O (median dose, 1,152 MBq; dose range, 1,014–1,800 MBq). Arterial blood was withdrawn with a pump (Alitea, Stockholm, Sweden) at a speed of 6 mL/min to obtain the input function. Blood radioactivity concentration was measured using a 2-channel online detector (General Electric Medical Systems, Uppsala, Sweden). The procedure was recently depicted in more detail (26). The blood volume was measured using inhalation of [15O]CO (0.14%) mixed with room air through a 3-way inhalation flap-valve (median dose, 2,699 MBq; dose range, 2,496–2,992 MBq), as previously described (27). During the scan, 3 arterial samples were taken at 4, 6, and 8 min from the beginning of the inhalation to measure the radioactivity concentration in the blood. An additional blood sample was withdrawn to measure plasma radioactivity to verify that the [15O]CO was bound to red cells and had not transformed into CO2 (27). When the blood volume study was finished, a slow (15 s) bolus of [18F]FETNIM was injected (median dose, 366 MBq; range, 289–385 MBq). During [18F]FETNIM image acquisition, 29 blood samples were withdrawn through the arterial line to measure the time course of the tracer concentration and metabolites in plasma. [18F]FETNIM data were collected continuously from injection until 120 min. The frame rate for the first scan was 4 × 30 s, 3 × 60 s, 5 × 180 s, 8 × 300 s, and 6 × 600 s. Afterward, the patient was allowed to rest for 40 min before the second scan, which was obtained between 160 and 180 min and at a frame rate of 3 × 400 s (Fig. 1).

Diagram of imaging protocol for [15O]H2O, [15O]CO2, and [18F]FETNIM PET shows 2-phase acquisition of [18F]FETNIM data, with scan 1 obtained at 0–120 min and scan 2 obtained at 160–180 min. For clarification, time scale is different on both sides of time 0.
Image Analysis
Identification of Metabolically Active Tumor with [18F]FDG.
All primary tumors in 8 patients were readily detectable visually as an area of increased focal [18F]FDG uptake. The frame between 55 and 60 min after [18F]FDG injection was used to define the regions of interest (ROIs). Tracer accumulation was measured as standardized uptake value (SUV), which is the ratio of the measured radioactivity concentration to the estimated body tracer concentration, assuming a uniform distribution throughout the entire body volume (28). ROIs were defined by isodensity contour using an SUV of 4 as a threshold value, which covered the entire visually detected tumor in all cases. The volumes of these ROIs were summed over all planes in which the tumor was visible to obtain the metabolically active tumor volume, which is known to correlate strongly with the volume determined by CT (29). Within these ROIs, a 3 × 3 pixel (7.04 × 7.04 mm) maximum ROI was defined with an automated system to represent the highest radioactivity concentration in the tumor. The plane with the highest SUV on the 9-pixel-maximum ROI, along with the 2 adjacent planes, was chosen for further analysis.
Definition of ROIs in Blood-Flow, Blood-Volume, and [18F]FETNIM Studies.
Whole-tumor ROIs from the 3 consecutive planes with the highest radioactivity as determined by the [18F]FDG study were carefully matched with the corresponding planes on the flow images. Anatomic landmarks seen on transmission scans, such as vocal cords, mandible, cervical vertebrae, nasal cavities, shoulders, and the tumors themselves, were used to confirm the matching of planes between the [18F]FDG and [15O]H2O images. The size and shape of ROIs were not allowed to change during transfer, and this requirement was met more easily by the tumors’ invariably showing an increased radioactivity signal on flow images. Large elliptic ROIs (size, 11.5–13.5 cm2) were defined on dorsal neck muscles in 3 adjacent planes of the transmission scan. The selected muscle ROIs were remote from known tumors and large neck vessels to avoid contamination of radioactivity in muscles by spillover from tissues with high radioactivity. The same whole-tumor ROIs were then transferred to both the corresponding blood-volume image planes and the corresponding [18F]FETNIM image planes. Appropriate locations for tumor ROIs on [18F]FETNIM images were chosen by correlation with anatomic landmarks because of the possibility of patient movement during scanning.
Calculation of Blood Flow.
The methods of measuring blood flow with [15O]H2O are based on the principle of inert gas exchange between blood and tissues (30). The autoradiographic method was chosen to calculate the parametric blood-flow images using a 250-s integration time and an arterial input curve (31). In the autoradiographic method, the tissue curve and integral are calculated from the measured decay-corrected arterial time–radioactivity curve for different flow levels, assuming a constant value of 1.0 for the partition coefficient of water in muscle. The integral values and respective blood-flow values are written to a lookup table. The integral of the measured decay-corrected tissue time–radioactivity curve is calculated for each image pixel, and a corresponding blood-flow value is retrieved from the table and written to the flow image. The measured arterial input curve suffers from dispersion in the sampling system, and there is also a delay between the measured input curve and the real entrance of the tracer into the tissue (26,32). The input function for the tissue was corrected for the measured external dispersion in the tubing (2.5 s) by deconvolution with an exponential function (32). The delay was solved by fitting the input curve into the measured tissue curve (32).
Calculation of Blood Volume.
The average blood volume of the tumor was calculated using the equation BV = (average radioactivity in tumor ROI/average radioactivity in blood) × 1/r, where BV is the average blood volume of the tumor and r is the tissue–to–large-vessel hematocrit ratio. A value of 0.91 was adopted from previous studies (26).
Dynamic [18F]FETNIM Imaging.
SUVs for [18F]FETNIM were measured from the whole-tumor and whole-muscle ROIs. Furthermore, a 3 × 3 pixel ROI with the maximum radioactivity within the previously determined whole-tumor ROIs was used for steady-state and kinetic analyses. The time course of tumor-to-muscle retention ratios was then calculated over different time frames using both maximum and whole-tumor ROIs.
Nitroimidazoles are reduced intracellularly in all viable cells; however, retention occurs only in the tissues with a low oxygen concentration, because reoxidation of the original compound is slowed. This retention leads to the formation of reactive and charged products, which may bind covalently to molecules under hypoxic conditions or diffuse more slowly from the tissue (33). Because the graphic analysis of [18F]FETNIM time–radioactivity data showed no irreversible trapping of tracer in tumor or other tissues during the PET study, the graphic analysis for reversible tracers (34,35) was applied. In this model-independent analysis, the plot of the radioactivity ratio of tissue integral to tissue versus the radioactivity ratio of plasma integral to tissue is linear at equilibrium. The slope of the linear phase of the plot equals the distribution volume (DV) of the tracer (35). In our studies, the plot became linear about 20 min after the tracer injection, and the slope was determined from the data measured after 20 min. For a coarse estimate of the DV during 2 periods, the ratio of tissue and plasma radioactivity curves was calculated at the end of the 2 dynamic acquisition phases (90–120 and 160–180 min after injection). Finally, a pixel-by-pixel analysis was applied to study the relationship between blood flow and [18F]FETNIM uptake within the tumor 90 min after the injection.
Statistical Analysis.
Pearson product moment correlation was used to analyze linear correlations between the variables. The results are expressed using medians, minimums, and maximums.
RESULTS
The long acquisition protocol was well tolerated, and all scheduled dynamic scans were obtained except that of 1 patient whose blood volume study was technically suboptimal. He had trouble breathing through the mask and refused the second part of [18F]FETNIM scan between 150 and 180 min after injection because of discomfort.
Assessment of Glucose Metabolism, Perfusion, and Blood Volume in Tumor and Muscle
Pertinent findings for the PET studies are given in Table 2. The PET images and corresponding CT scans of 2 patients are shown in Figure 2. In all cases, the primary tumor was clearly visualized on the blood-flow and [18F]FDG scans, and there was good contrast in perfusion and glucose metabolism between tumor and muscle tissues. Because of high tracer uptake in tumors on [18F]FDG scans, we could define the metabolically active tumor volume using an SUV of 4 as a threshold (29). The median metabolically active tumor volume was 15 mL (volume range, 2–400 mL; Table 1). For patients 2 and 8, however, the true volume may have been underestimated by this approach because of partial-volume effects. The tumor-to-muscle blood-flow ratio was invariably high, with a median of 9.1 and a range of 5.4–28.3.


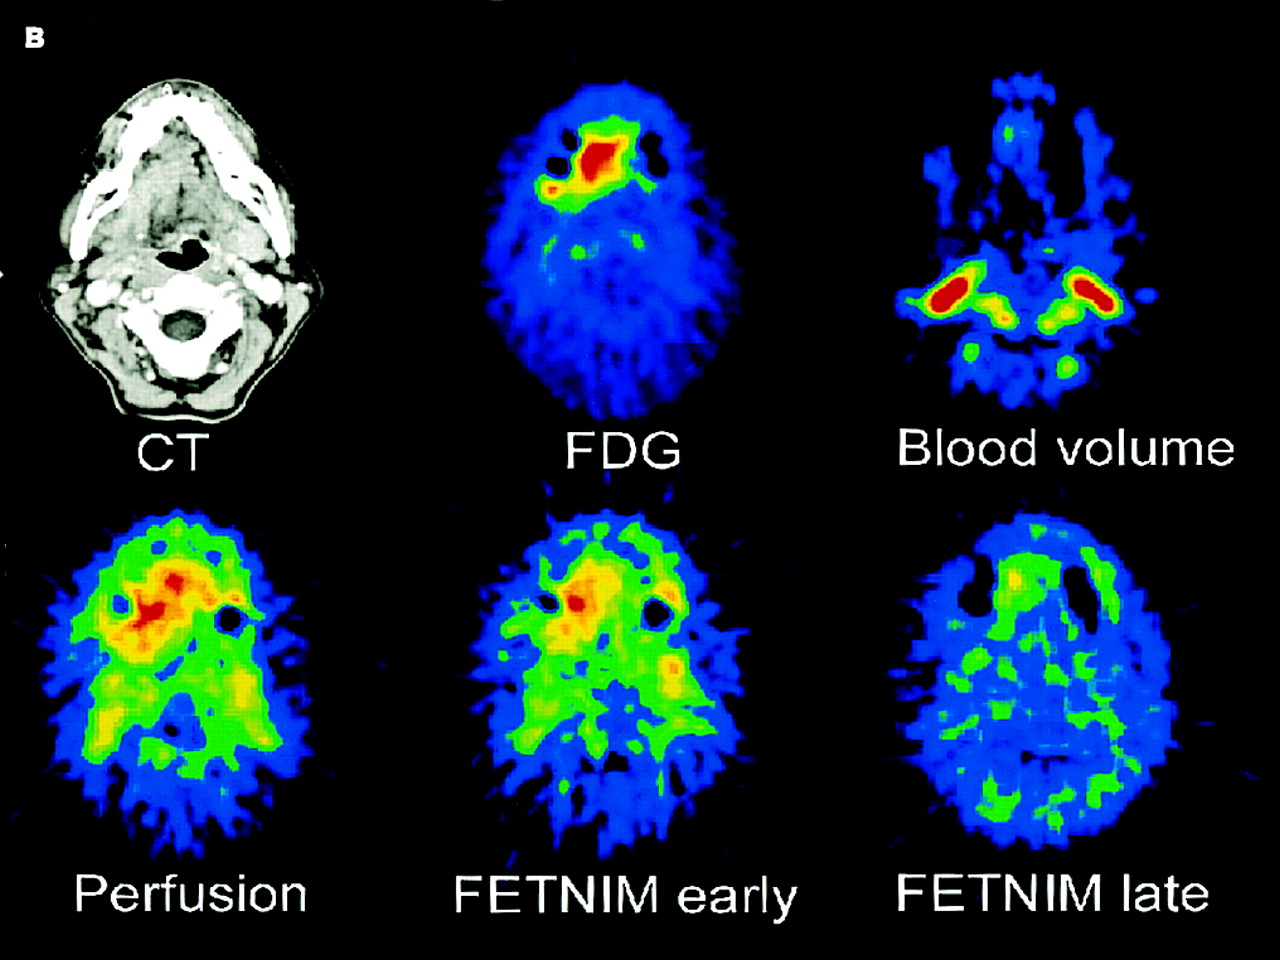
Multiple tomographic PET images of 2 untreated patients with head and neck cancer. Corresponding axial CT scans are depicted in upper left of both image sets. (A) Supraglottic laryngeal cancer (T1 N0) shows high uptake of [18F]FDG (top row, middle) and increased blood flow (bottom row, left). Early distribution pattern of [18F]FETNIM 5–8 min from injection allows easy delineation of tumor (bottom row, middle), whereas in later phase, 120 min from injection (bottom row, right), [18F]FETNIM is distributed more evenly between tumor and ambient tissues in neck and base of mouth. PET images also show transfer of ROI (red line circling tumor) from [18F]FDG image to other PET studies. (B) Right lingual cancer (T4 N1) likewise shows high uptake of [18F]FDG (top row, middle) and high blood flow (bottom row, left). Early [18F]FETNIM image obtained 5–8 min from injection (bottom row, middle) closely resembles that of corresponding perfusion image, whereas later phase [18F]FETNIM image at 120 min (bottom row, right) shows focal uptake, especially in apex of tumor. Tumor is hardly visible in [15O]CO blood volume images (top rows, right) of both (A) and (B).
Quantitative Analysis of PET Findings for Head and Neck Tumors
Blood volumes for tumor and neck muscle were comparable, with a median of 5.7 mL/100 g of tumor tissue (range, 4.1–7.5 mL) and 4.8 mL/100 g of muscle tissue (range, 2.9–6.4 mL). Patient 3 showed the maximum difference in blood volume—2-fold higher in tumor than in muscle (7.5 mL/100 g of tumor tissue vs. 3.5 mL/100 g of muscle tissue). Overall, the ratio between blood volumes for tumor and blood volumes for muscle varied widely among patients (median, 1.3; range, 0.7–2.1).
Dynamic Uptake of [18F]FETNIM
In early phases (i.e., 5–8 min after injection), the pattern of [18F]FETNIM uptake closely resembled perfusion images. On late images, [18F]FETNIM activity in tumor was more equal to that of background mucosal surfaces and neck muscles. Tumor uptake was difficult to distinguish in 3 patients (38%) (Fig. 2A), whereas the remaining 5 patients showed focally increased and visually detectable uptake in at least some parts of the tumor.
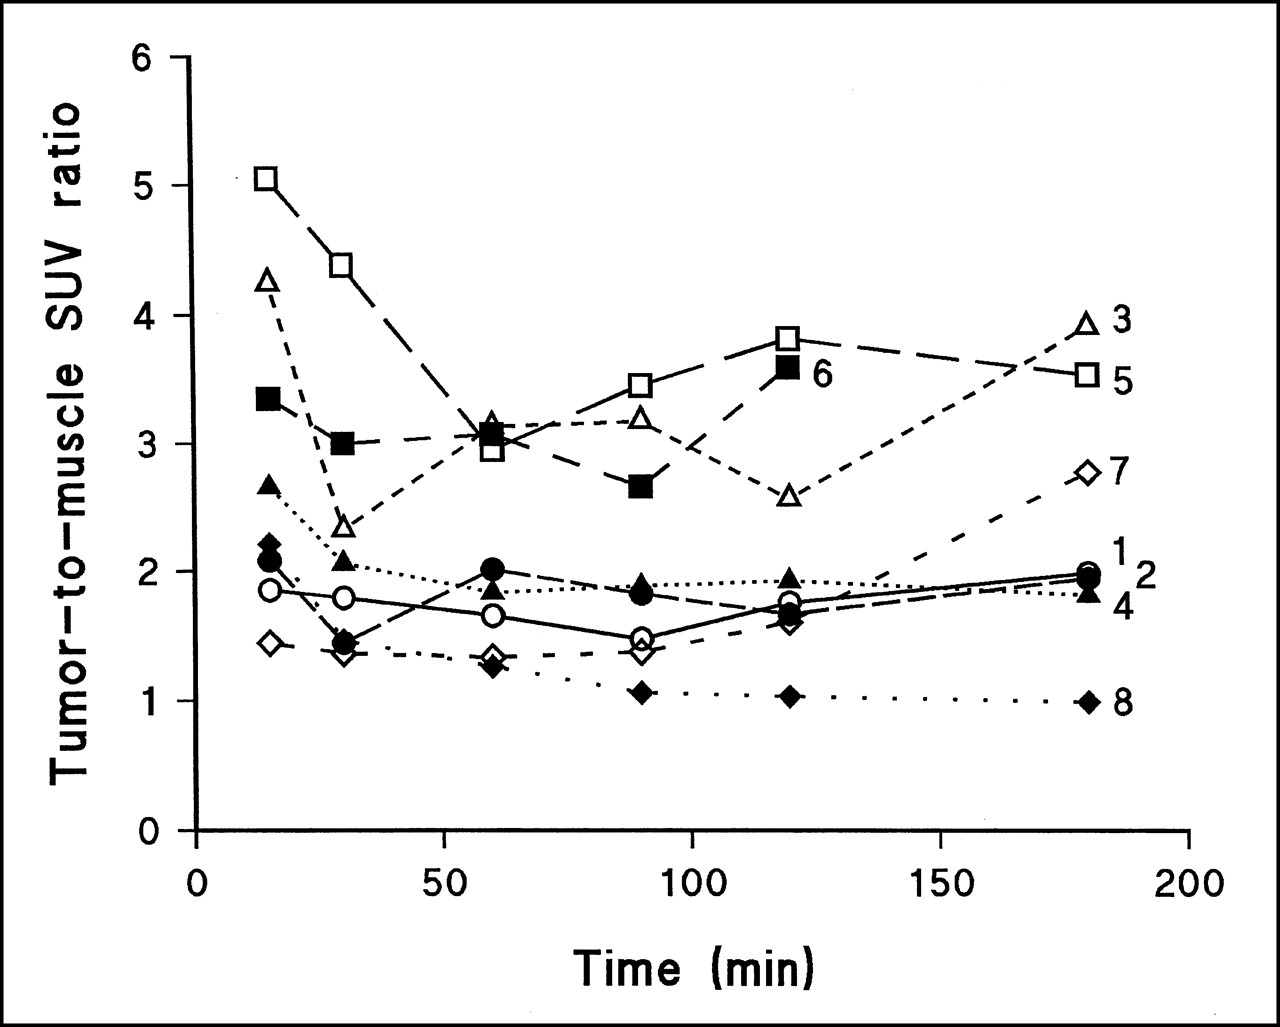
Dynamic uptake of [18F]FETNIM by arterial blood, muscle, and tumor in a representative patient (patient 5) is depicted in Figure 3. The plasma concentration of 18F radioactivity peaked immediately with injection and then rapidly redistributed. We could show radiochromatographically that no major metabolites were in the plasma (18).18F activity remained lower in muscle tissue than in plasma during the whole acquisition for all patients. Whole-tumor 18F activity was always higher than muscle 18F activity but was comparable with plasma activity until 120 min for 4 patients and until 180 min for 2 patients and was lower than plasma activity for the remaining patients (Table 2). Maximum tumor activity was higher than plasma activity for 4 patients and close to plasma activity for 4 patients. In the beginning of the study the tumor curve peaked slightly, whereas the muscle curve rose slowly throughout the study to the final level. Maximum tumor-to-muscle SUV ratios at different times are expressed in Figure 4.
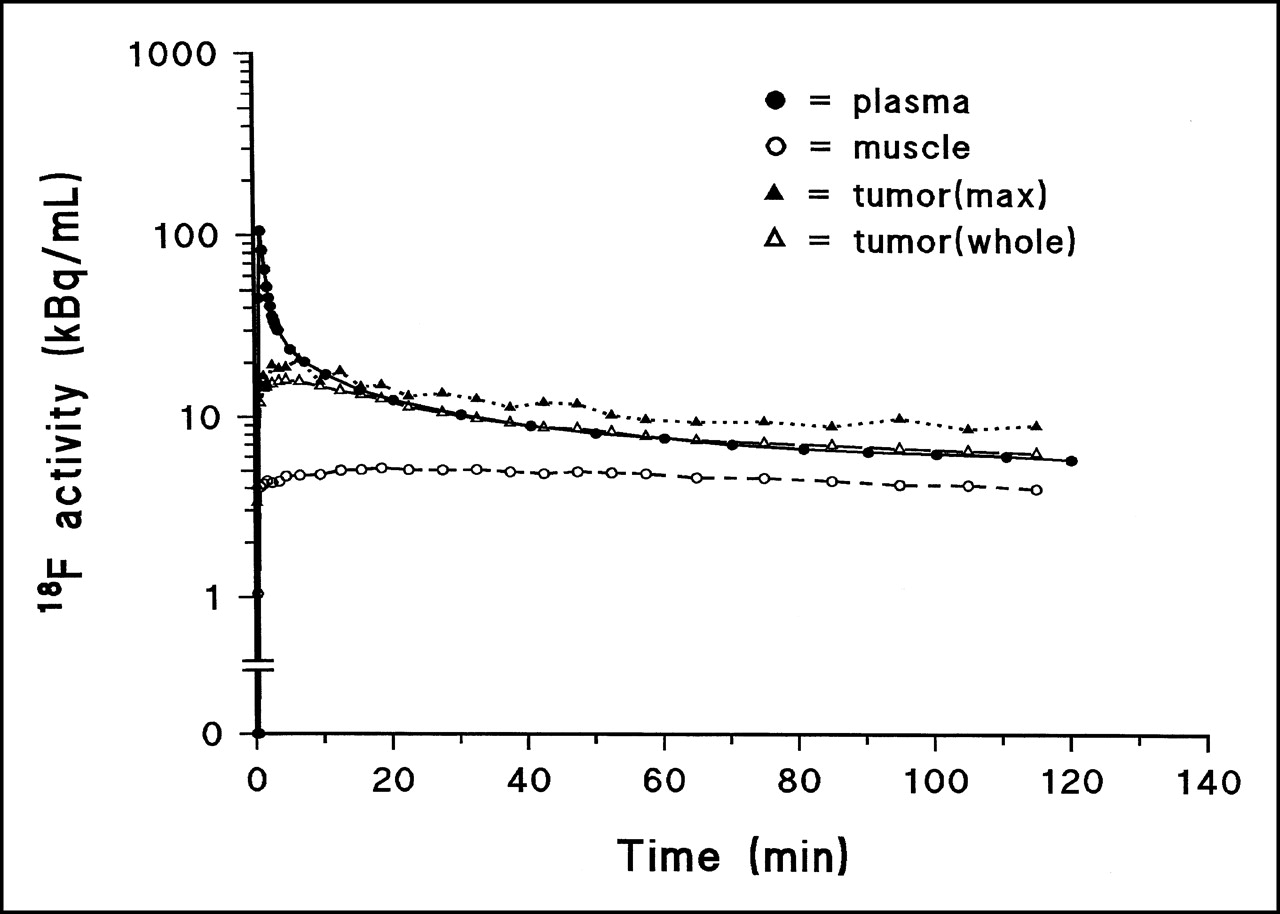
Time course of uptake of [18F]FETNIM in patient with hypopharyngeal carcinoma. Whole and maximum (max) tumor activity are shown separately.

Time course of [18F]FETNIM uptake expressed as tumor-to-muscle SUV ratio. Numbers within frame refer to patients as numbered in Table 1.
Tumor DVs were calculated using the graphic analysis applied by Logan et al. (34) and Logan (35) for 2 periods excluding the early phase of peak [18F]FETNIM activity. The calculated DVs in the maximum tumor ROIs between the 2 periods were almost identical, as can be seen in Table 2. Excellent fits for the plots were reached over these phases. The Pearson correlation coefficients for the fitted plots were typically in the range of 0.99–1.00. The DVs calculated using graphic analysis correlated well (r2 = 0.880; P = 0.0006) with the more robust tissue-to-plasma ratios calculated at the end of the first dynamic study. In the late accumulation phase (160–180 min), the association was weaker (r2 = 0.554; P = 0.06).
A strong correlation was found between the DV and [18F]FETNIM uptake as calculated using SUV between 60 and 120 min. The highest correlation was found at 90 min (r2 = 0.935; P < 0.0001; Fig. 5). The correlation did not improve at 180 min (r2 = 0.524; P = 0.066).

Relationship between DV of [18F]FETNIM and maximum (max) SUV in tumor at different times during dynamic study.
Comparison of Blood Flow and Glycolytic Metabolism with Uptake of [18F]FETNIM
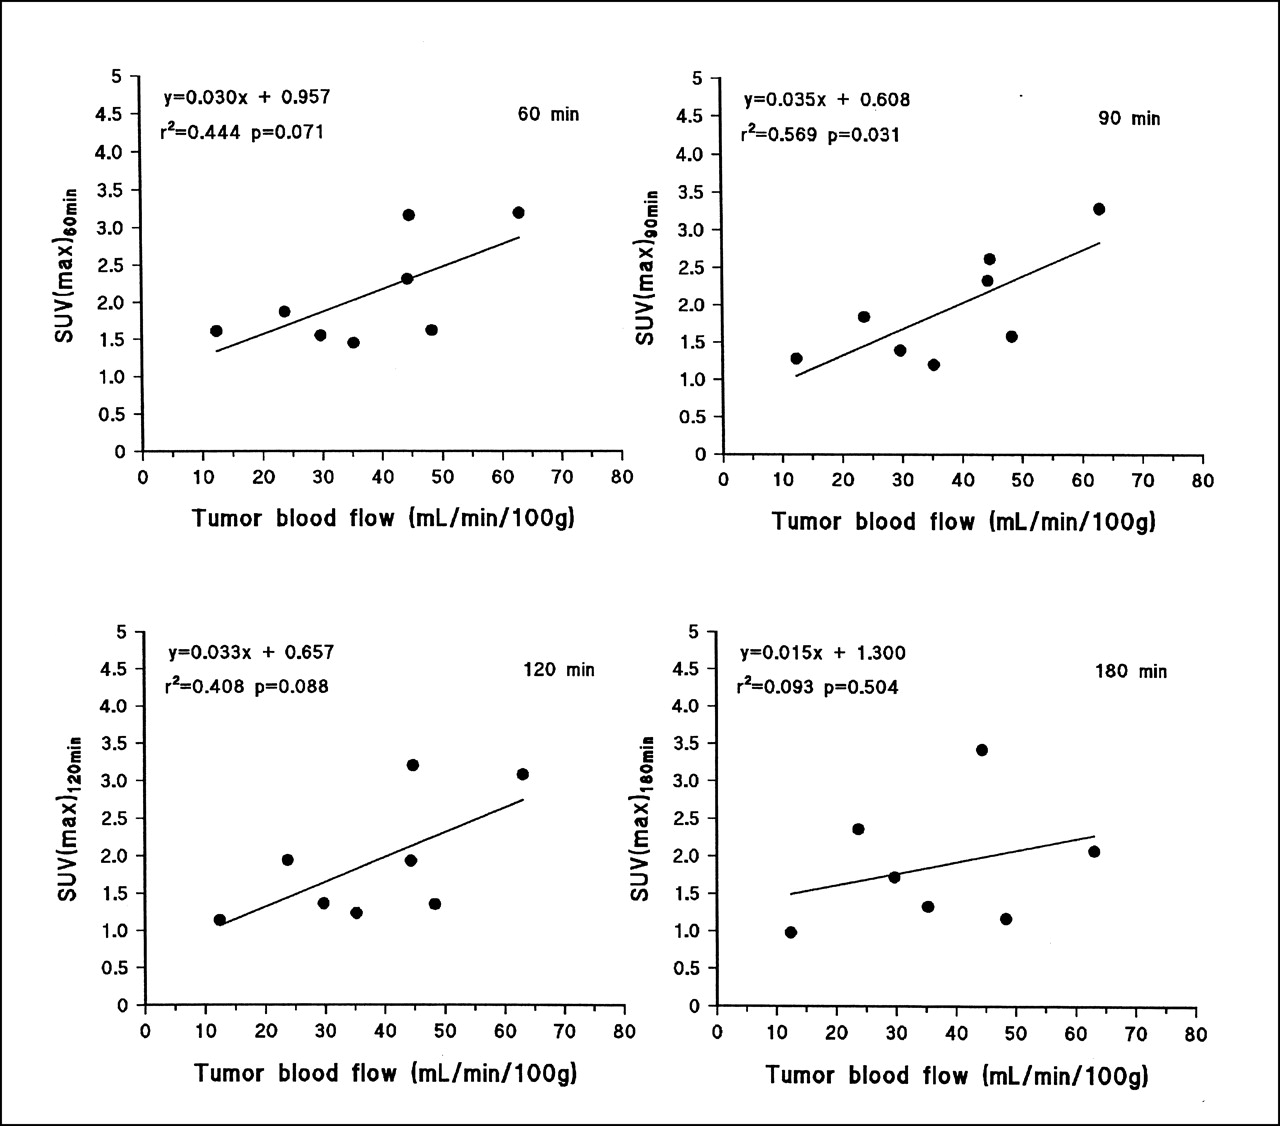
A correlation was observed between the DV of [18F]FETNIM uptake between 20 and 120 min and whole-tumor blood flow (n = 8; r2 = 0.728; P = 0.04). The correlation was weaker when DV between 160 and 180 min and flow were compared (n = 7; r2 = 0.462; P = 0.09). A similar trend for weaker correlation between flow and [18F]FETNIM uptake was observed when maximum SUV in tumor tissue at different times (Fig. 6) was compared, with the only significant association occurring at 90 min (r2 = 0.462; P = 0.03). However, the DV did not correlate with the steady-state uptake of [18F]FDG (SUV) or metabolically active tumor volume. In a pixel-by-pixel analysis of whole-tumor images, the association between tumor blood flow and [18F]FETNIM uptake (at 90 min) was not consistent, although some tumors had statistically significant probability values, as can be seen in Table 3.

Relationship between uptake of [18F]FETNIM expressed as maximum (max) SUV and blood flow at different times during dynamic study.
Pixel-by-Pixel Comparison of Blood Flow and [18F]FETNIM Uptake in Head and Neck Tumors 90 Minutes After Tracer Injection
DISCUSSION
Substantial evidence for hypoxia in cancer has accumulated over the past few decades. Hypoxic cancer cells may be resistant to traditional oncologic therapies and contribute to the failure of radiation and cytotoxic drugs to eradicate tumor. Great efforts have been made to recognize these cells, because therapy targeted against hypoxia might improve outcome (2). Specifically, noninvasive methods to detect hypoxia using radionuclide probes and PET or SPECT have been a focus of interest lately (6). Imaging of hypoxia with nuclear medicine assays is especially attractive for evaluation of deep-seated tumors not easily accessible to techniques requiring tissue sampling (36). Radiolabeled nitroimidazole compounds have already shown feasibility for PET studies, the most-used compound being [18F]FMISO (16,37).
In our study, another nitroimidazole compound, [18F]FETNIM, was used to image patients with head and neck cancer before the start of radiotherapy. [18F]FETNIM may theoretically be a more potent indicator of hypoxia than is [18F]FMISO because of greater hydrophilicity and more favorable pharmacokinetics (13,18). On the basis of these 2 studies, both [18F]FMISO and [18F]FETNIM show late hypoxia-specific accumulation at 120–240 min in experimental mammary tumors. However, [18F]FETNIM had not been evaluated in cancer patients previously. Therefore, we undertook a long, dynamic study to learn the optimal time window for assessment of [18F]FETNIM uptake in tumors and surrounding normal tissues. On the basis of this knowledge, we aim to develop a clinically feasible imaging protocol for future PET studies to evaluate hypoxia-specific binding of [18F]FETNIM in cancer patients.
In addition to the [18F]FETNIM study, concurrent perfusion and blood volume imaging and, on a separate day, [18F]FDG PET were performed on all patients. We studied tumor blood flow using [15O]H2O to assess the interrelationship between flow and [18F]FETNIM uptake, and with the aid of [18F]FDG, the metabolically active tumor volume could be defined and the tumor could be more precisely localized for image correlation with other studies.
We found that blood volume in tumors did not significantly differ from that in muscles and the mucosal surfaces of adjacent neck areas. Neither did tumor blood volume correlate with metabolic characteristics depicted by [18F]FDG and [18F]FETNIM imaging. By contrast, tumor blood flow as assessed with a bolus injection of [15O]H2O was high. Most patients had flow rates between 30 and 65 mL/100 g/min, whereas the flow rate in neck muscle was typically <5 mL/100 g/min. Similarly, high rates of blood flow have been reported for cervical and breast tumors using [15O]H2O autoradiography and a dynamic technique, respectively (38,39). The high apparent flow may be caused by high cellularity and a relatively high water-to-lipid content ratio in tumors (39). In fact, parts of tumors may still remain severely hypoxic because of a low oxygen extraction ratio, as studies on cerebral gliomas have suggested (40).
In tumors with a high regional [18F]FETNIM uptake, the average blood flow tended to be high. This relationship was evident in comparison with not only the early phase of [18F]FETNIM uptake but also, to a somewhat lesser extent, the late retention phase. Our observation has several explanations. First, because [18F]FETNIM is hydrophilic, it is no surprise that initial uptake in tissue is governed by blood flow. Second, in the presence of hypoxia, angiogenesis is enhanced and may result in high average blood flow on the macroscopic level. High blood flow, in turn, is associated with neovascularization, which may foretell an even greater hypoxic fraction of the tumor in regions with high apparent flow but low oxygen extraction. To better understand the relationship, we performed a pixel-by-pixel comparison of whole-tumor radioactivity between the corresponding perfusion and [18F]FETNIM images obtained 90 min after injection. The lack of relationship between regional flow and distribution of 18F activity within tumors suggests that flow and retention of [18F]FETNIM may not be coupled. Furthermore, PET is not sensitive in detecting heterogeneity at the microscopic level because autoradiographic images of experimental tumors usually show an inverse relationship between flow and nitroimidazole labeling. In addition, the relative short imaging time—180 min—may not allow sufficiently high covalent binding of [18F]FETNIM to cellular macromolecules (6).
For the kinetic analysis of [18F]FETNIM uptake, we applied a graphic analysis for reversible tracers (34,35). The graphic analysis for irreversible tracers showed slopes around zero, implying that the irreversible compartment for labeled [18F]FETNIM metabolites is negligible in the studied tissue types (41). The graphic analysis for reversible tracers has been developed and until now applied in the brain receptor studies, but it is not dependent on a particular model (35). Indeed, it provided excellent linear fits for tumor and muscle data in the current study. The resulting DV is assumed to be relatively independent of blood flow. However, at low rates of blood flow, a longer equilibration time may delay the linear phase of the plot. The lower the oxygen concentration in tissue, the longer the [18F]FETNIM metabolites stay in tissue, leading to higher DV and, thus, a positive image of hypoxia.
The calculated DVs correlated significantly with tumor-to-muscle SUV ratios obtained between 90 and 120 min after injection, suggesting that the SUV approach may be used as a surrogate for kinetic analysis in patients for whom blood sampling is not desirable. However, SUV ratios tended to increase over time in some patients (Fig. 4), and the optimal time for steady-state analysis of [18F]FETNIM uptake is not easy to determine. Recognizing the limitations of the SUV calculations, we consider it too early to recommend this index for general use in [18F]FETNIM PET studies (28). Until more confirmatory data are available, estimation of [18F]FETNIM DVs may be safer with the Logan analysis or with measurement of tissue-to-plasma ratios in the late accumulation phase, which requires only a few blood samples (Table 2).
CONCLUSION
We analyzed dynamic uptake of [18F]FETNIM in patients with head and neck cancer for whom definitive or preoperative radiotherapy was being planned. [18F]FETNIM is a new, hydrophilic 2-nitroimidazole analog with hypoxia-specific binding in experimental tumors (13). We found that initial uptake of [18F]FETNIM is governed by blood flow and that subsequent and, presumably, hypoxia-specific retention becomes evident some 60–90 min after injection. Uptake of [18F]FETNIM in tumors varied widely, with time-dependent tumor-to-muscle ratios varying between 1 and 4 and a tendency to higher ratios appearing at later times in some, but not all, patients. Time dependency could be eliminated through a volume-of-distribution analysis previously applied to reversible tracers. The high variability of [18F]FETNIM uptake in untreated head and neck cancer clearly supports further evaluation of [18F]FETNIM PET in this disease, for which poor oxygenation has a proven effect on treatment outcome. Future studies must be combined with evidence of hypoxia-specific binding of [18F]FETNIM in human tissues to justify development of this radionuclide method for noninvasive assessment of tumor hypoxia.
Acknowledgments
The authors thank the technologists and laboratory staff of the Turku PET Centre for their skillful assistance and cooperation and Prof. Michael R. Horsman, from Aarhus University Hospital (Aarhus, Denmark), for sharing his expertise on tumor oxygenation. This study was supported in part by the Finnish Cancer Foundation, the Southwestern Finnish Cancer Foundation, and Turku University Foundation.
Footnotes
Received Feb. 5, 2001; revision accepted May 14, 2001.
For correspondence or reprints contact: Heikki Minn, MD, PhD, Turku PET Centre, Turku University Central Hospital, P.O. Box 52, FIN-20521 Turku, Finland.
REFERENCES
In this issue


Jump to section
Related Articles
Cited By...
- Multiparametric Imaging of Tumor Hypoxia and Perfusion with 18F-Fluoromisonidazole Dynamic PET in Head and Neck Cancer
- 2-18F-Fluoroethanol Is a PET Reporter of Solid Tumor Perfusion
- Multiparametric Analysis of the Relationship Between Tumor Hypoxia and Perfusion with 18F-Fluoroazomycin Arabinoside and 15O-H2O PET
- 18F-Alfatide II and 18F-FDG Dual-Tracer Dynamic PET for Parametric, Early Prediction of Tumor Response to Therapy
- PET Imaging of Chemokine Receptors in Vascular Injury-Accelerated Atherosclerosis
- PET of Hypoxia: Current and Future Perspectives
- Quantitative Assessment of Hypoxia Kinetic Models by a Cross-Study of Dynamic 18F-FAZA and 15O-H2O in Patients with Head and Neck Tumors
- Innovations in Radiotherapy Planning of Head and Neck Cancers: Role of PET
- 18F-EF5: A New PET Tracer for Imaging Hypoxia in Head and Neck Cancer
- Reproducibility of Tumor Perfusion Measurements Using 15O-Labeled Water and PET
- Reproducibility of Tumor Blood Flow Quantification with 15O-Water PET
- Application of PET/CT in the Development of Novel Anticancer Drugs
- Prognostic Impact of Hypoxia Imaging with 18F-Misonidazole PET in Non-Small Cell Lung Cancer and Head and Neck Cancer Before Radiotherapy
- Hypoxia-Specific Tumor Imaging with 18F-Fluoroazomycin Arabinoside
- Assessment of Inter- and Intrapatient Variability in C15O2 Positron Emission Tomography Measurements of Blood Flow in Patients with Intra-abdominal Cancers
- Positron emission tomographic imaging of angiogenesis and vascular function
- Nuclear medicine in imaging head and neck malignancies
- 18F-Fluoroerythronitroimidazole Radiation Dosimetry in Cancer Studies
- On Measuring Hypoxia in Individual Tumors with Radiolabeled Agents